| Param | Original file | Final file |
|---|---|---|
| Filename | modeM0/AS1A12_054T03_9000005516_40006cztM0_level2.fits | modeM0/AS1A12_054T03_9000005516_40006cztM0_level2_quad_clean.evt |
| Size (bytes) | 353,632,320 | 91,627,200 |
| Size | 337.3 MB | 87.4 MB |
| Events in quadrant A | 3,245,605 | 603,493 |
| Events in quadrant B | 3,169,918 | 611,831 |
| Events in quadrant C | 2,722,209 | 612,365 |
| Events in quadrant D | 3,512,748 | 551,919 |
| Mode M9 | |||
|---|---|---|---|
| Quadrant | BADHDUFLAG | Total packets | Discarded packets |
| A | 0 | 27 | 0 |
| B | 0 | 27 | 0 |
| C | 0 | 27 | 0 |
| D | 0 | 28 | 0 |
| Mode SS | |||
|---|---|---|---|
| Quadrant | BADHDUFLAG | Total packets | Discarded packets |
| A | 0 | 114 | 0 |
| B | 0 | 114 | 0 |
| C | 0 | 114 | 0 |
| D | 0 | 114 | 0 |
| Mode M0 | |||
|---|---|---|---|
| Quadrant | BADHDUFLAG | Total packets | Discarded packets |
| A | 0 | 13294 | 3 |
| B | 0 | 13457 | 2 |
| C | 0 | 11690 | 2 |
| D | 0 | 14512 | 2 |
| Quadrant | Total seconds | Saturated seconds | Saturation percentage |
|---|---|---|---|
| A | 5645 | 171 | 3.029229% |
| B | 5645 | 236 | 4.180691% |
| C | 5645 | 20 | 0.354296% |
| D | 5645 | 213 | 3.773251% |
Noise dominated data is calculated using 1-second bins in cleaned event files. If a bin has >2000 counts, and if more than 50% of those come from <1% of pixels, then it is considered to be noise-dominated and hence unusable.
| Quadrant | # 1 sec bins | Bins with >0 counts | Bins with >2000 counts | High rate bins dominated by noise | Noise dominated (total time) | Noise dominated (detector-on time) | Marked lightcurve |
|---|---|---|---|---|---|---|---|
| A | 7227 | 5646 | 111 | 111 | 1.54% | 1.97% | 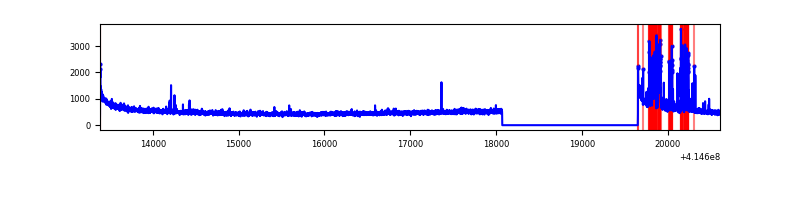 |
| B | 7227 | 5646 | 126 | 126 | 1.74% | 2.23% | 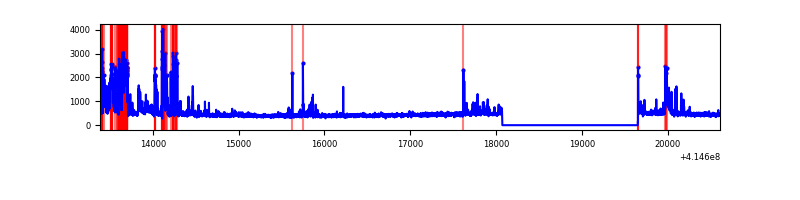 |
| C | 7227 | 5646 | 16 | 16 | 0.22% | 0.28% | 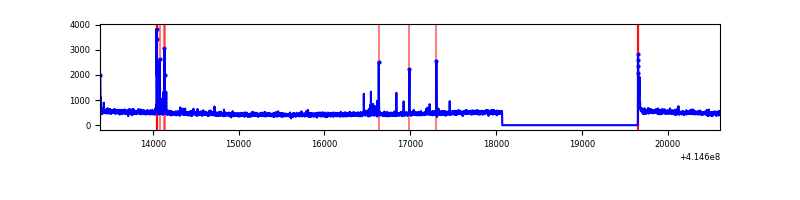 |
| D | 7227 | 5646 | 210 | 210 | 2.91% | 3.72% | 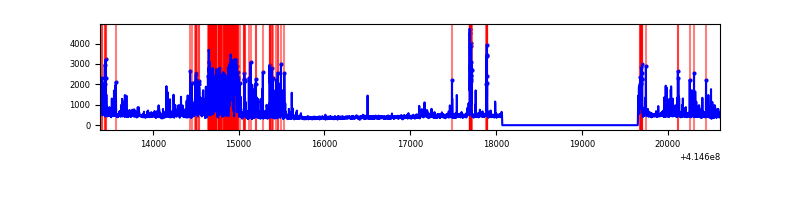 |
Top three noisy pixels from each quadrant. If the there are fewer than three noisy pixels in the level2.evt file, extra rows are filled as -1
| Pixel properties | Quadrant properties | ||||||
|---|---|---|---|---|---|---|---|
| Quadrant | DetID | PixID | Counts | Sigma | Mean | Median | Sigma |
| A | 10 | 83 | 463162 | 3697.72 | 611 | 598 | 125.1 |
| A | 13 | 248 | 384622 | 3069.87 | 611 | 598 | 125.1 |
| A | 2 | 79 | 13299 | 101.53 | 611 | 598 | 125.1 |
| B | 4 | 171 | 717033 | 6095.33 | 606 | 590 | 117.5 |
| B | 15 | 35 | 26318 | 218.89 | 606 | 590 | 117.5 |
| B | 0 | 230 | 19892 | 164.22 | 606 | 590 | 117.5 |
| C | 15 | 214 | 233966 | 1642.57 | 607 | 611 | 142.1 |
| C | 0 | 10 | 32164 | 222.1 | 607 | 611 | 142.1 |
| C | 14 | 254 | 24622 | 169.01 | 607 | 611 | 142.1 |
| D | 12 | 227 | 690681 | 4676.2 | 598 | 582 | 147.6 |
| D | 13 | 249 | 219380 | 1482.6 | 598 | 582 | 147.6 |
| D | 2 | 250 | 119984 | 809.08 | 598 | 582 | 147.6 |
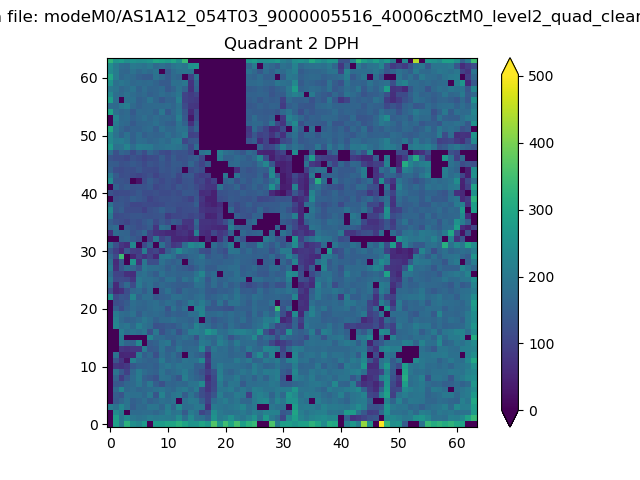
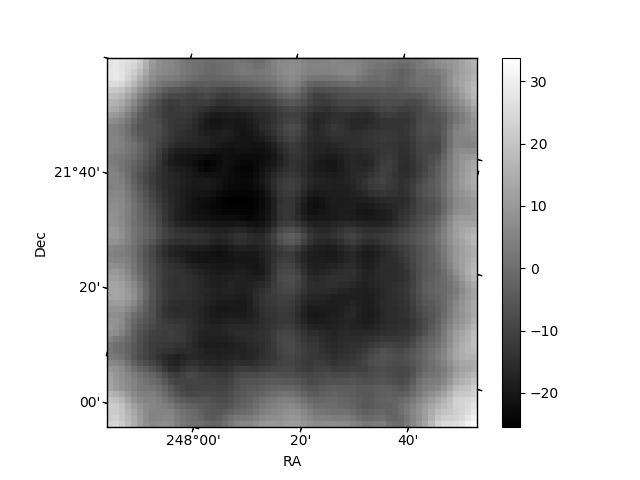
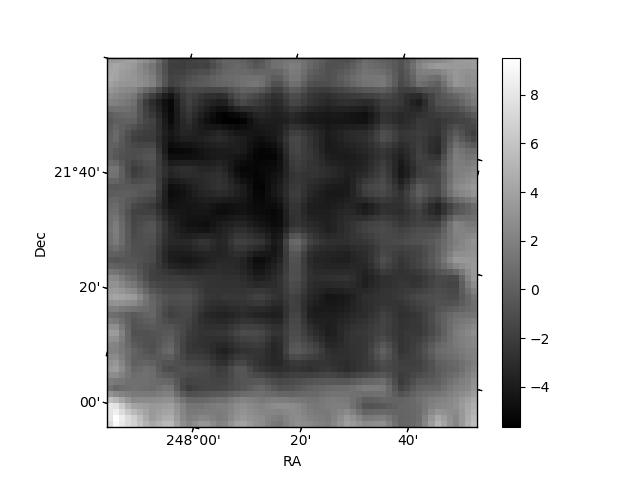
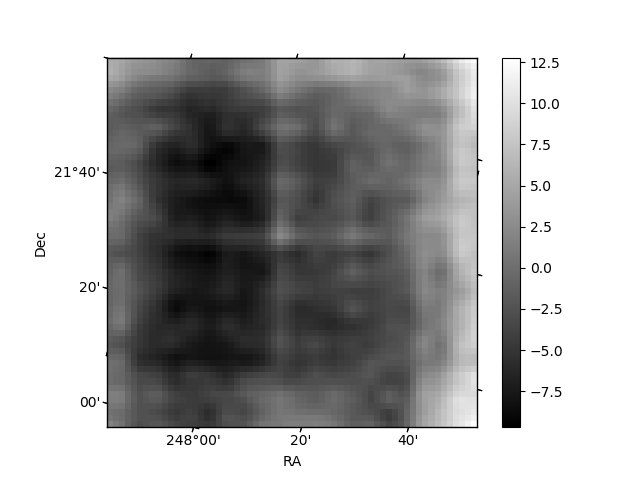
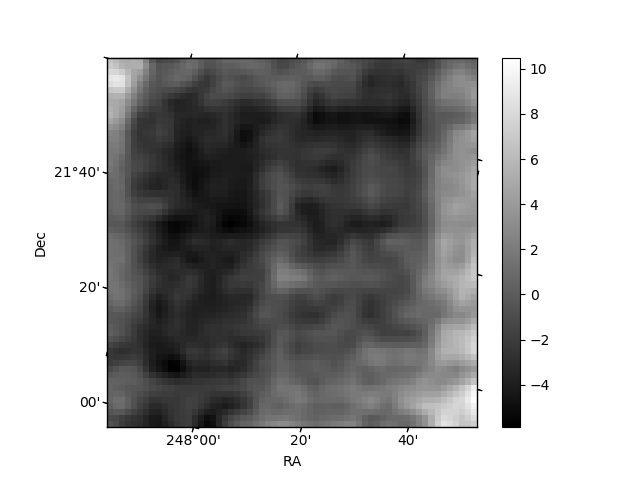
Histogram calculated using DETX and DETY for each event in the final _common_clean file
| Quadrant A | 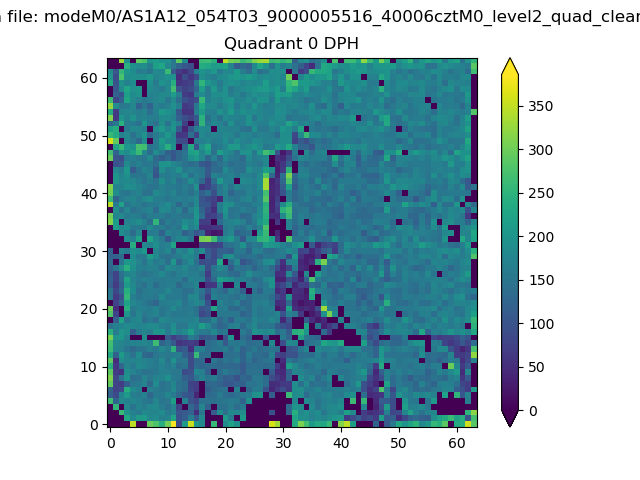 |
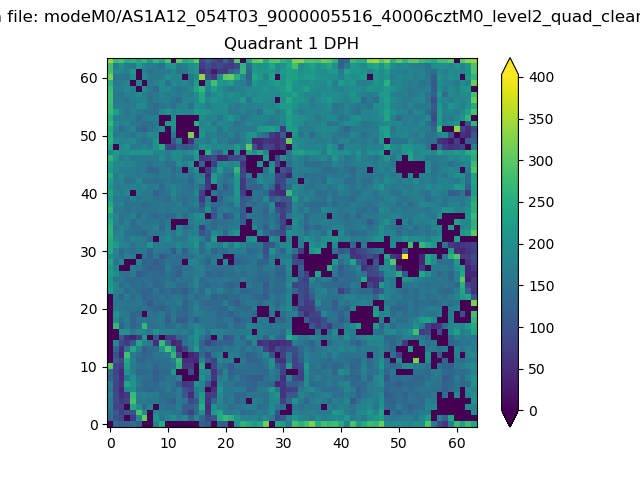 |
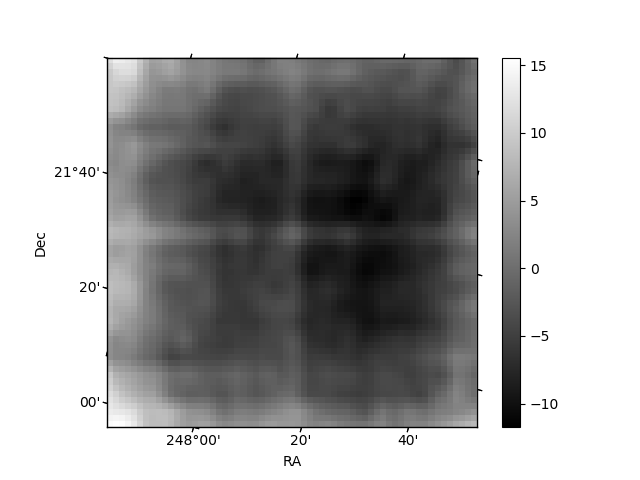
Quadrant B |
|---|---|---|---|
| Quadrant D | 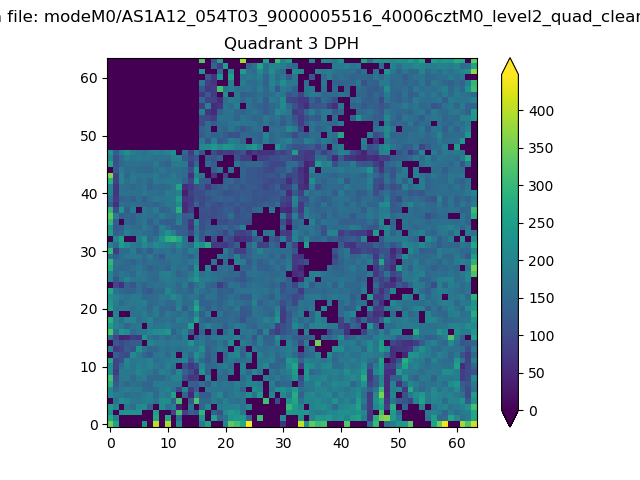 |
 |
Quadrant C |
| Plot type | Count rate plots | Images |
|---|---|---|
| Comparison with Poisson distribution Blue bars denote a histogram of data divided into 1 sec bins. Red curve is a Poisson curve with rate = median count rate of data. |
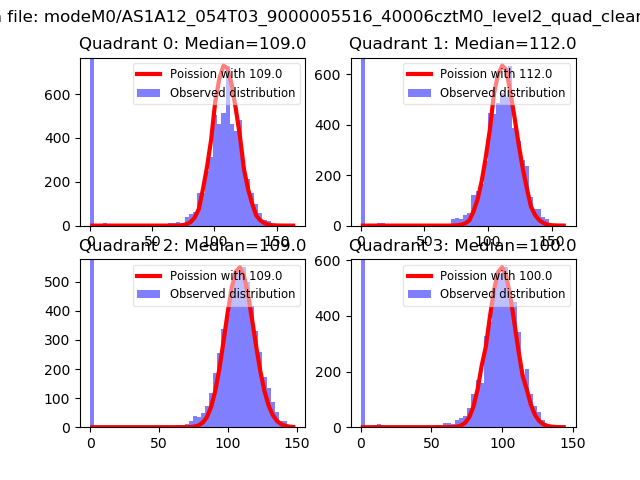 |
 |
| Quadrant-wise count rates Data is divided into 100 sec bins |
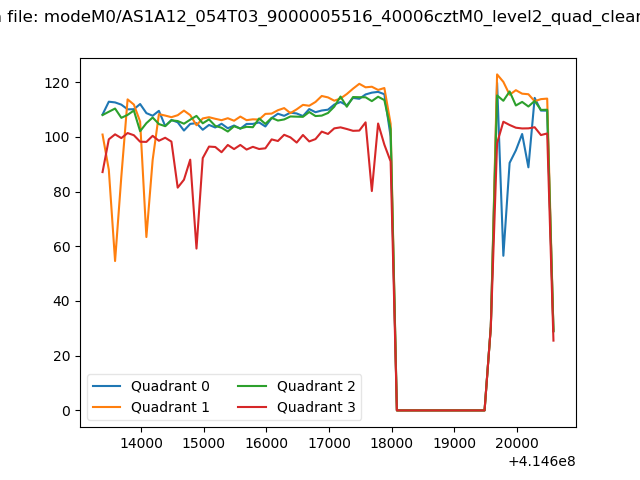 |
|
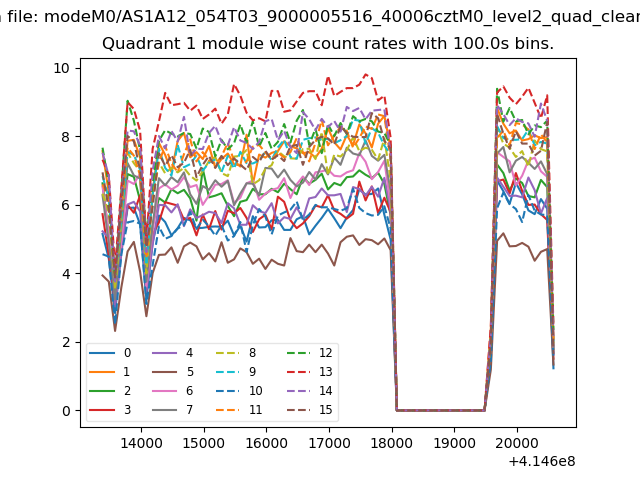
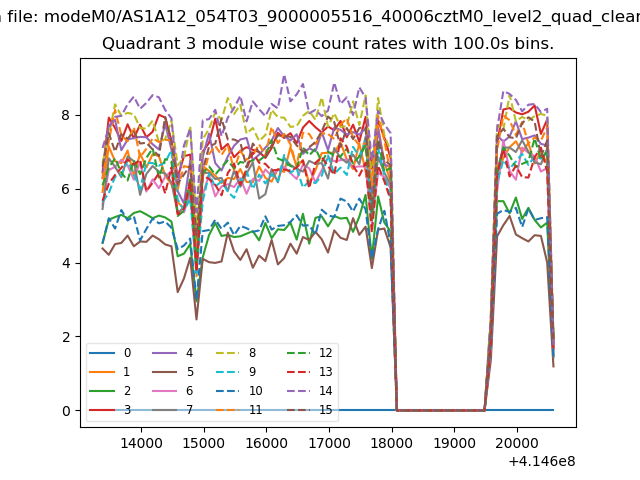
| Module-wise count rates for Quadrant A Data is divided into 100 sec bins |
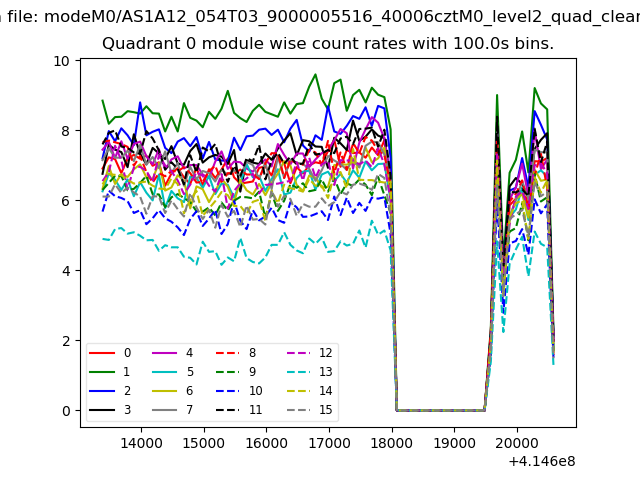 |
 |
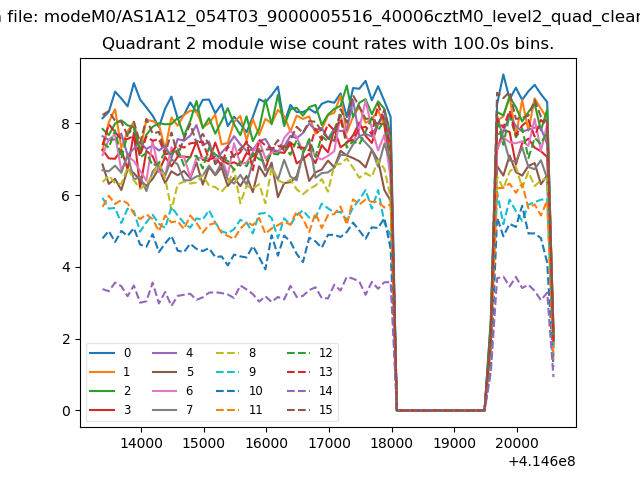
| Module-wise count rates for Quadrant B Data is divided into 100 sec bins |
 |
 |
| Module-wise count rates for Quadrant C Data is divided into 100 sec bins |
 |
 |
| Module-wise count rates for Quadrant D Data is divided into 100 sec bins |
 |
 |
| Parameter | Plot |
|---|---|
| CZT HV Monitor | 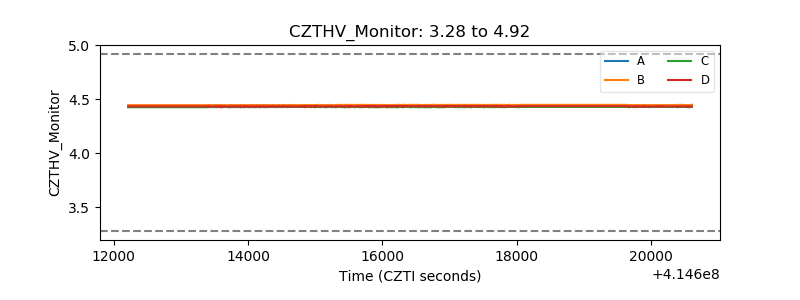 |
| D_VDD | 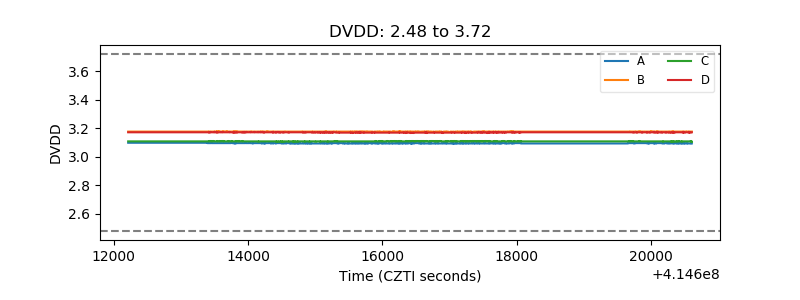 |
| Temperature 1 | 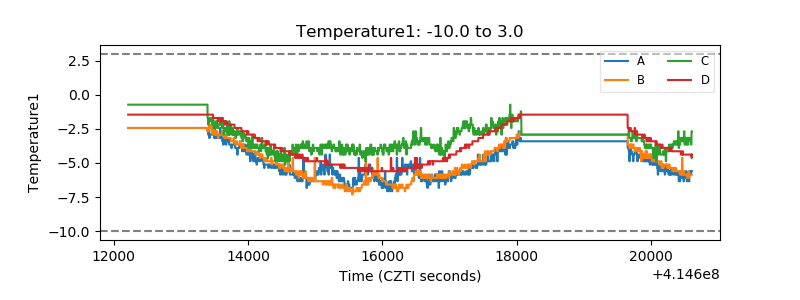 |
| Veto HV Monitor | 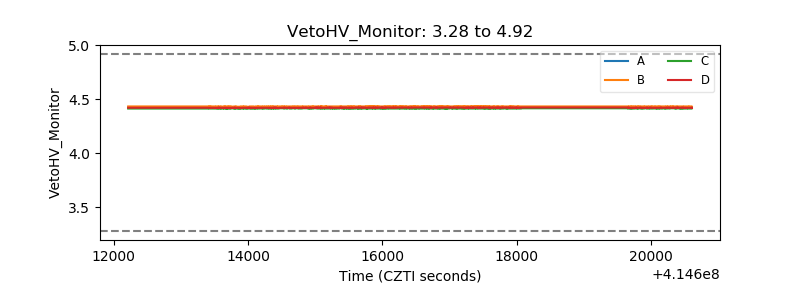 |
| Veto LLD | 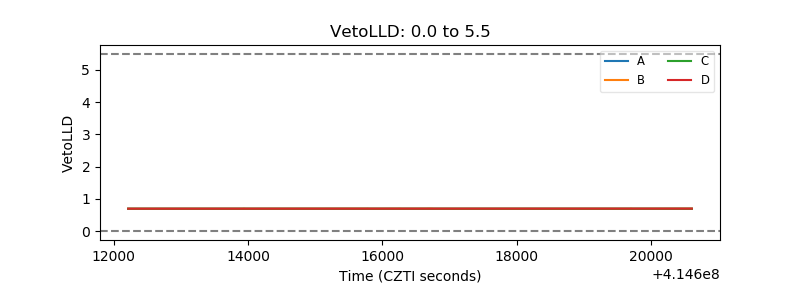 |
| Alpha Counter | 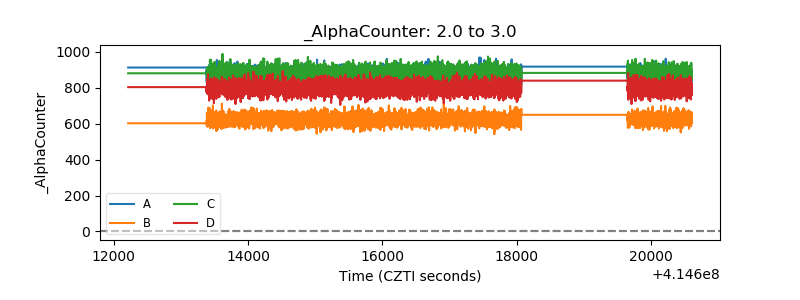 |
| _CPM_Rate | 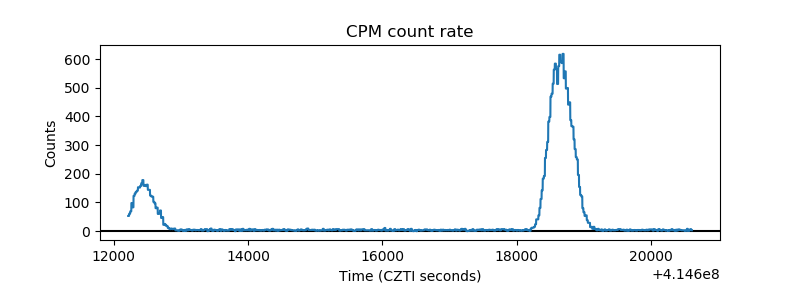 |
| CZT Counter | 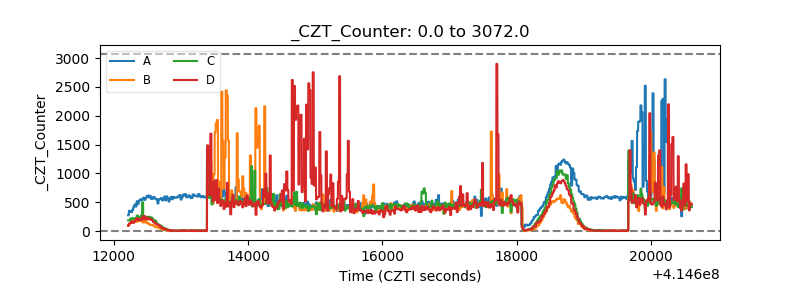 |
| +2.5 Volts monitor | 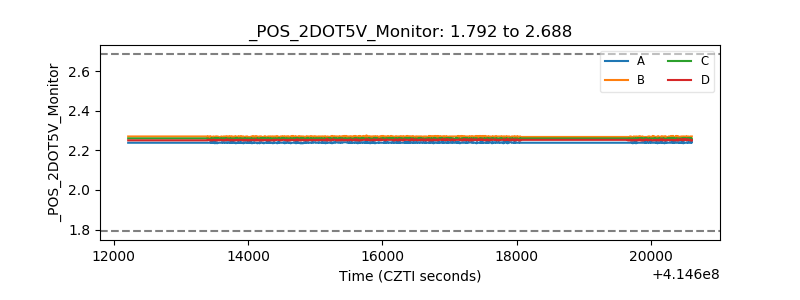 |
| +5 Volts monitor | 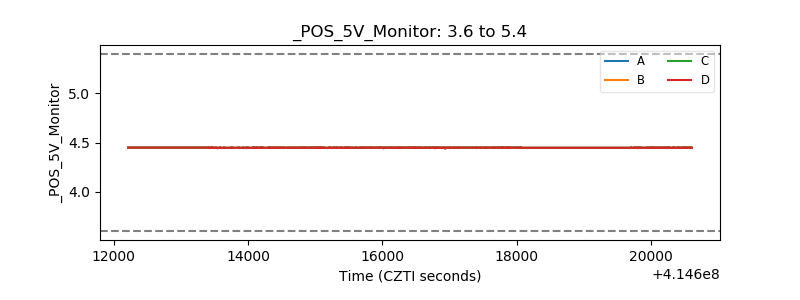 |
| _ROLL_ROT | 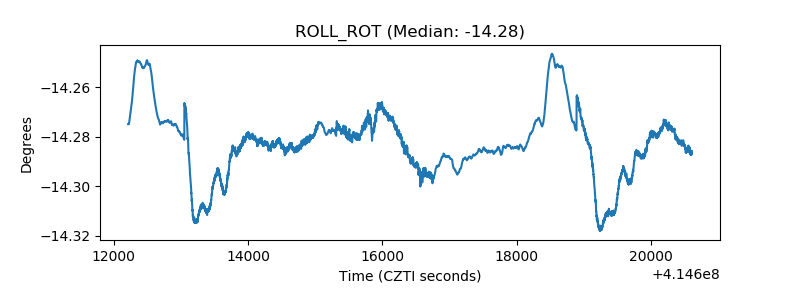 |
| _Roll_DEC | 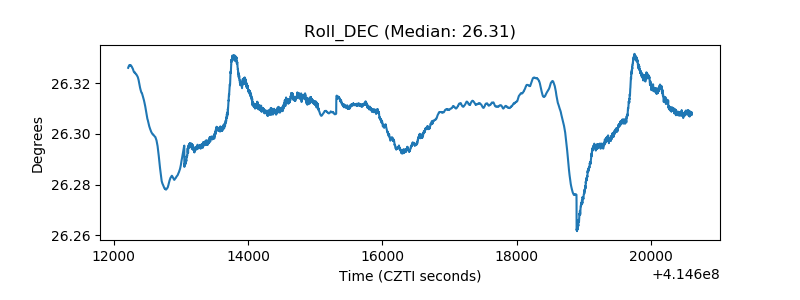 |
| _Roll_RA | 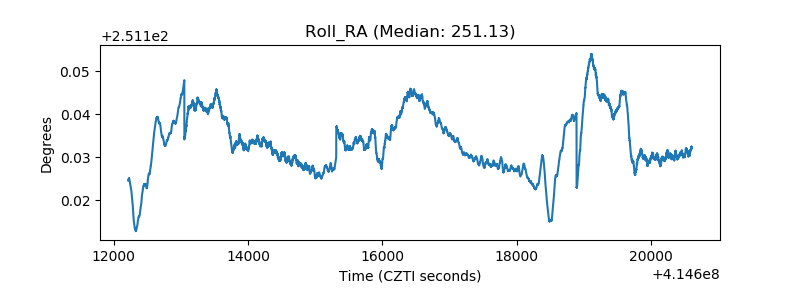 |
| Veto Counter | 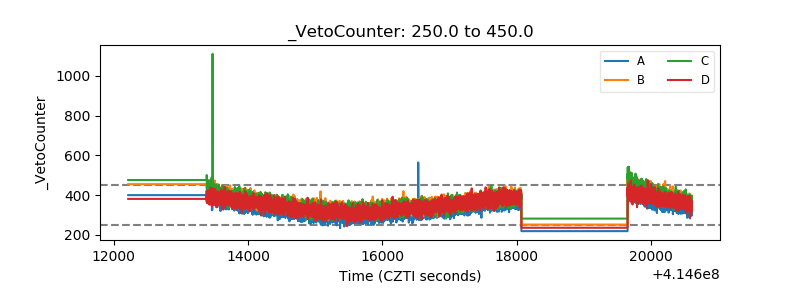 |