| Param | Original file | Final file |
|---|---|---|
| Filename | modeM0/AS1A12_054T03_9000005516_40007cztM0_level2.fits | modeM0/AS1A12_054T03_9000005516_40007cztM0_level2_quad_clean.evt |
| Size (bytes) | 342,711,360 | 87,865,920 |
| Size | 326.8 MB | 83.8 MB |
| Events in quadrant A | 3,252,986 | 573,622 |
| Events in quadrant B | 2,799,273 | 606,959 |
| Events in quadrant C | 2,677,321 | 591,415 |
| Events in quadrant D | 3,542,229 | 516,423 |
| Mode M9 | |||
|---|---|---|---|
| Quadrant | BADHDUFLAG | Total packets | Discarded packets |
| A | 0 | 24 | 0 |
| B | 0 | 24 | 0 |
| C | 0 | 24 | 0 |
| D | 0 | 25 | 0 |
| Mode SS | |||
|---|---|---|---|
| Quadrant | BADHDUFLAG | Total packets | Discarded packets |
| A | 0 | 108 | 0 |
| B | 0 | 108 | 0 |
| C | 0 | 108 | 0 |
| D | 0 | 108 | 0 |
| Mode M0 | |||
|---|---|---|---|
| Quadrant | BADHDUFLAG | Total packets | Discarded packets |
| A | 0 | 13184 | 3 |
| B | 0 | 12059 | 2 |
| C | 0 | 11353 | 2 |
| D | 0 | 14356 | 2 |
| Quadrant | Total seconds | Saturated seconds | Saturation percentage |
|---|---|---|---|
| A | 5315 | 228 | 4.289746% |
| B | 5315 | 84 | 1.580433% |
| C | 5315 | 10 | 0.188147% |
| D | 5315 | 341 | 6.415804% |
Noise dominated data is calculated using 1-second bins in cleaned event files. If a bin has >2000 counts, and if more than 50% of those come from <1% of pixels, then it is considered to be noise-dominated and hence unusable.
| Quadrant | # 1 sec bins | Bins with >0 counts | Bins with >2000 counts | High rate bins dominated by noise | Noise dominated (total time) | Noise dominated (detector-on time) | Marked lightcurve |
|---|---|---|---|---|---|---|---|
| A | 7018 | 5316 | 158 | 158 | 2.25% | 2.97% | 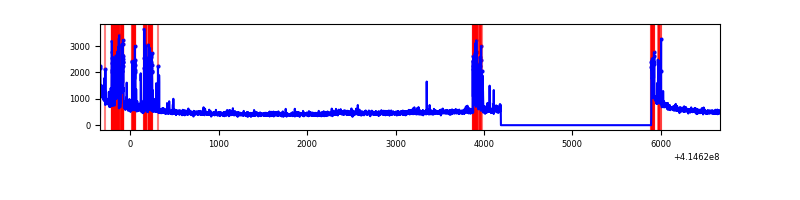 |
| B | 7018 | 5316 | 71 | 71 | 1.01% | 1.34% | 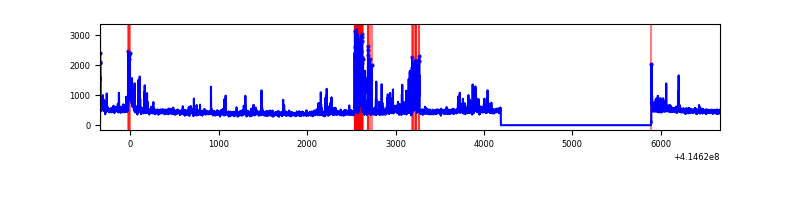 |
| C | 7018 | 5316 | 6 | 6 | 0.09% | 0.11% | 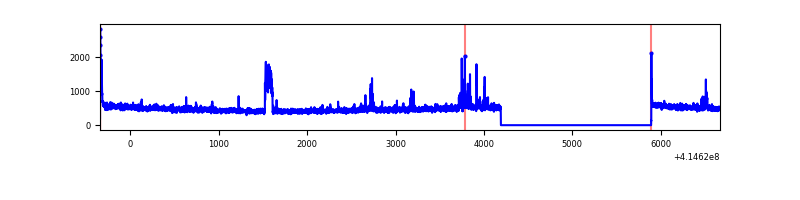 |
| D | 7018 | 5316 | 292 | 292 | 4.16% | 5.49% | 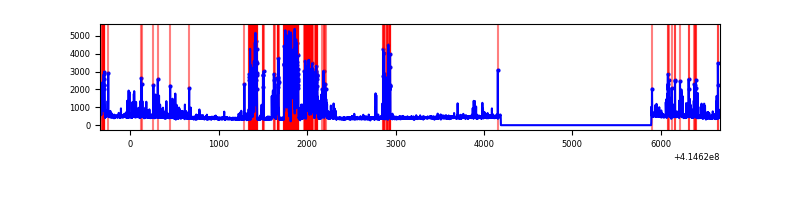 |
Top three noisy pixels from each quadrant. If the there are fewer than three noisy pixels in the level2.evt file, extra rows are filled as -1
| Pixel properties | Quadrant properties | ||||||
|---|---|---|---|---|---|---|---|
| Quadrant | DetID | PixID | Counts | Sigma | Mean | Median | Sigma |
| A | 13 | 248 | 578484 | 4901.55 | 572 | 562 | 117.9 |
| A | 10 | 83 | 431106 | 3651.59 | 572 | 562 | 117.9 |
| A | 2 | 79 | 17261 | 141.63 | 572 | 562 | 117.9 |
| B | 4 | 171 | 497429 | 4395.42 | 580 | 566 | 113.0 |
| B | 12 | 111 | 14128 | 119.97 | 580 | 566 | 113.0 |
| B | 11 | 111 | 12878 | 108.92 | 580 | 566 | 113.0 |
| C | 15 | 214 | 219959 | 1626.88 | 574 | 577 | 134.8 |
| C | 9 | 54 | 151690 | 1120.61 | 574 | 577 | 134.8 |
| C | 0 | 10 | 29731 | 216.2 | 574 | 577 | 134.8 |
| D | 12 | 227 | 1013787 | 7455.03 | 553 | 538 | 135.9 |
| D | 2 | 250 | 186367 | 1367.25 | 553 | 538 | 135.9 |
| D | 13 | 249 | 110952 | 812.38 | 553 | 538 | 135.9 |
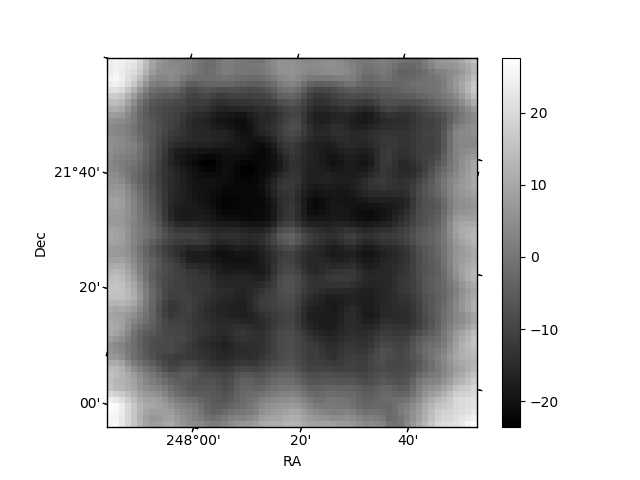
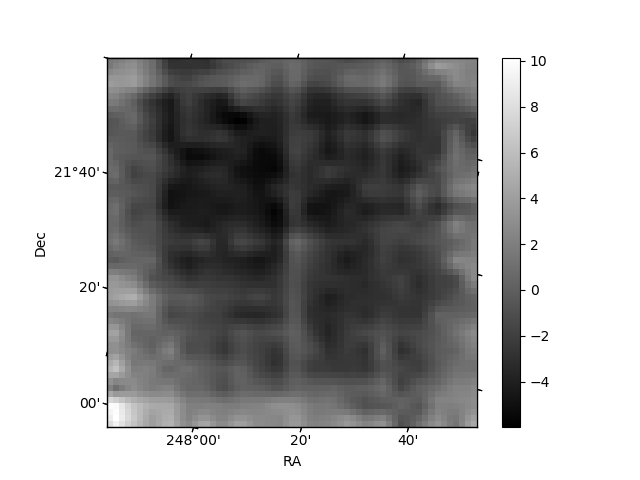
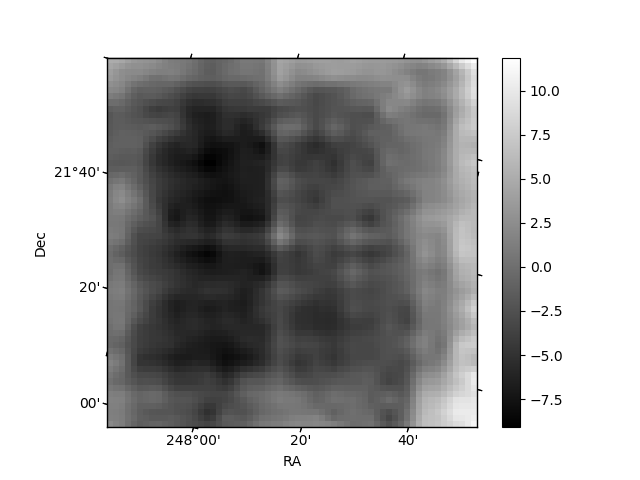
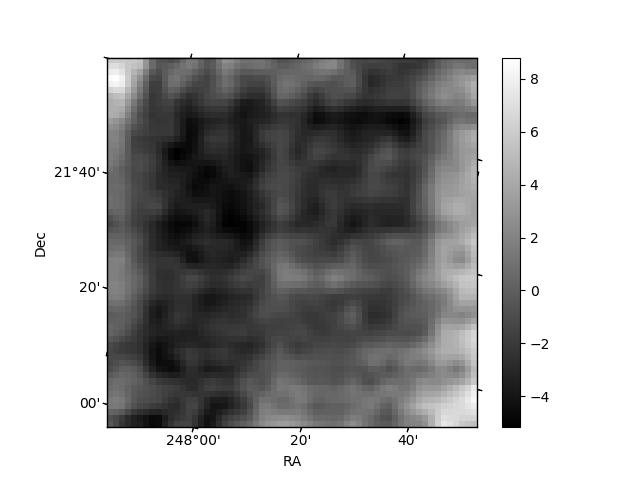
Histogram calculated using DETX and DETY for each event in the final _common_clean file
| Quadrant A | 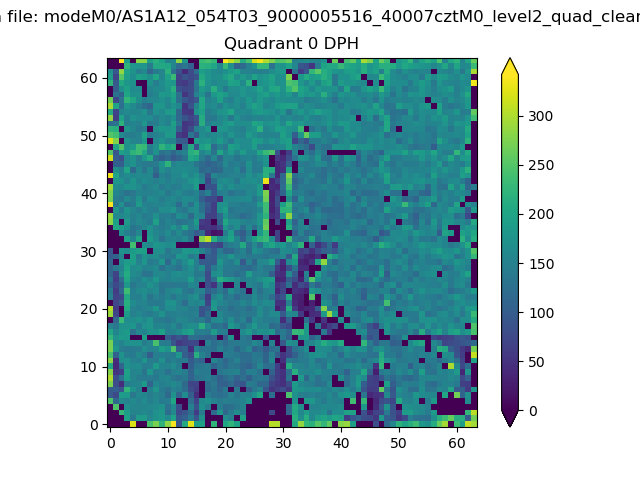 |
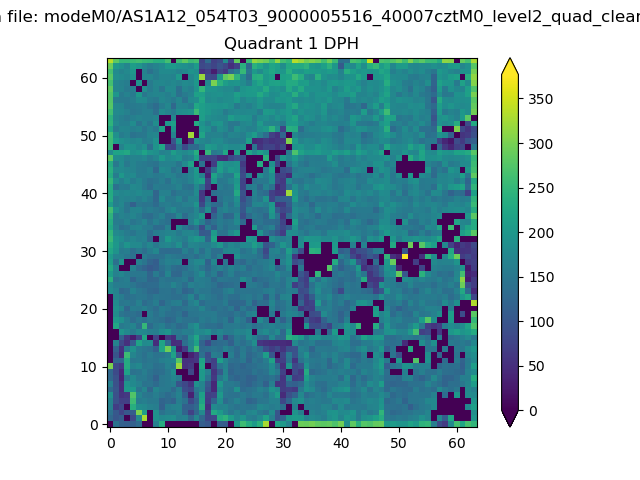 |
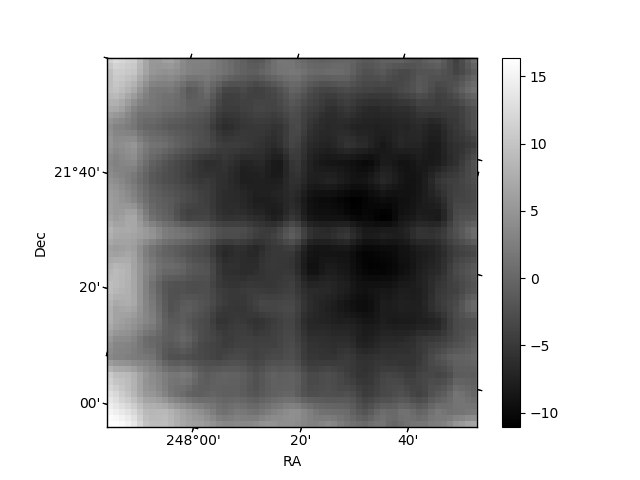
Quadrant B |
|---|---|---|---|
| Quadrant D | 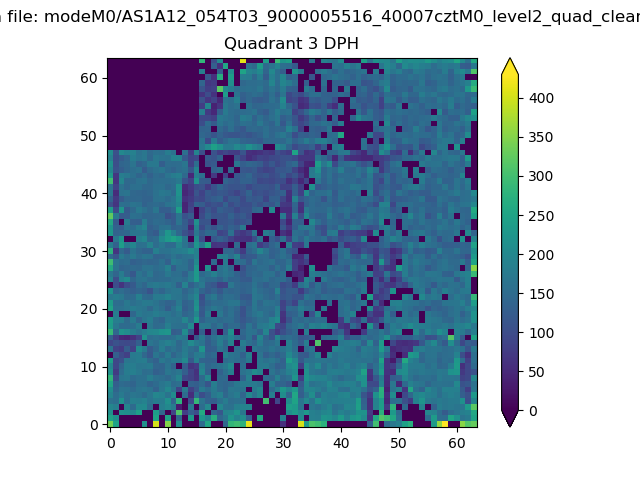 |
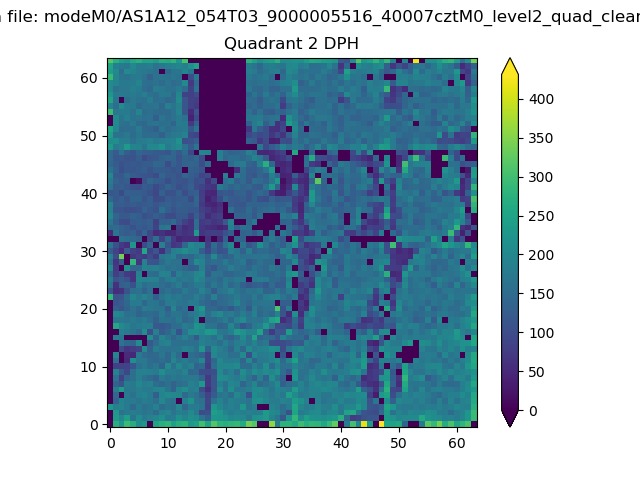 |
Quadrant C |
| Plot type | Count rate plots | Images |
|---|---|---|
| Comparison with Poisson distribution Blue bars denote a histogram of data divided into 1 sec bins. Red curve is a Poisson curve with rate = median count rate of data. |
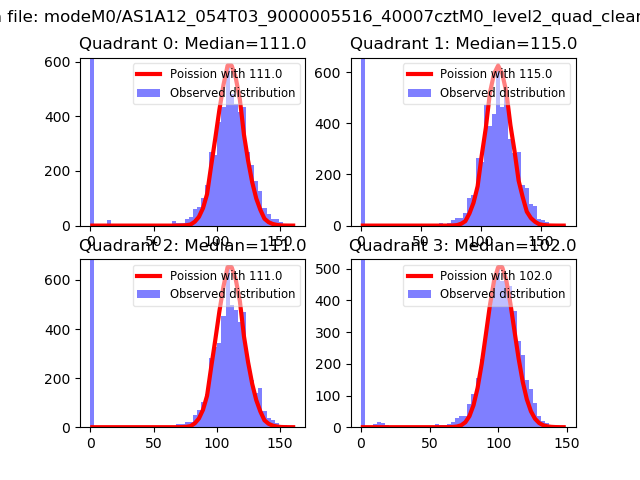 |
 |
| Quadrant-wise count rates Data is divided into 100 sec bins |
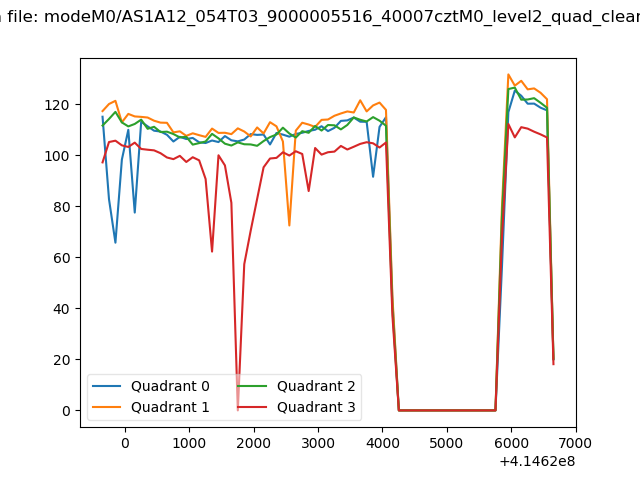 |
|
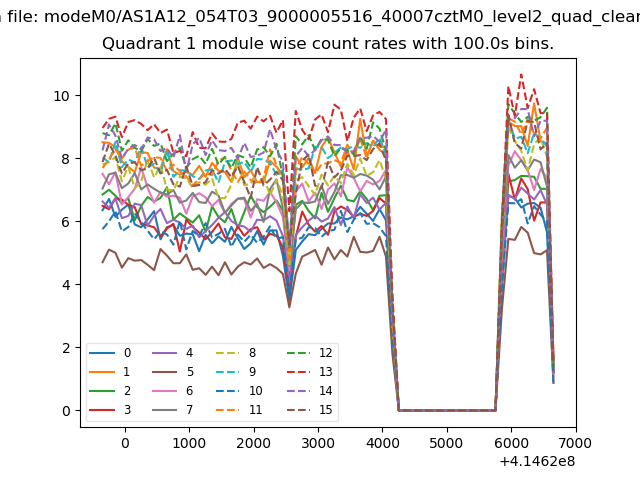
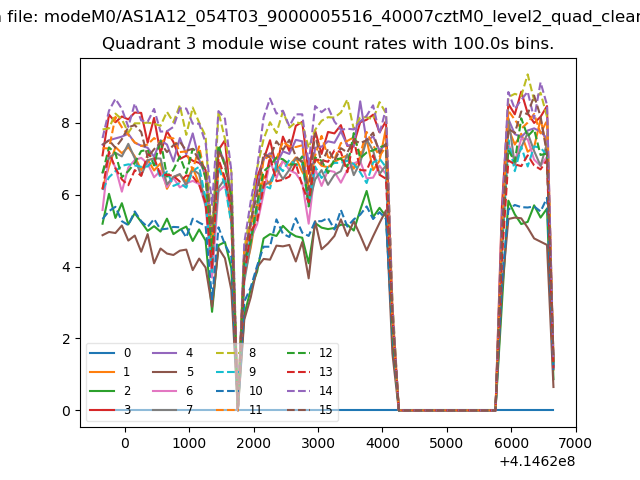
| Module-wise count rates for Quadrant A Data is divided into 100 sec bins |
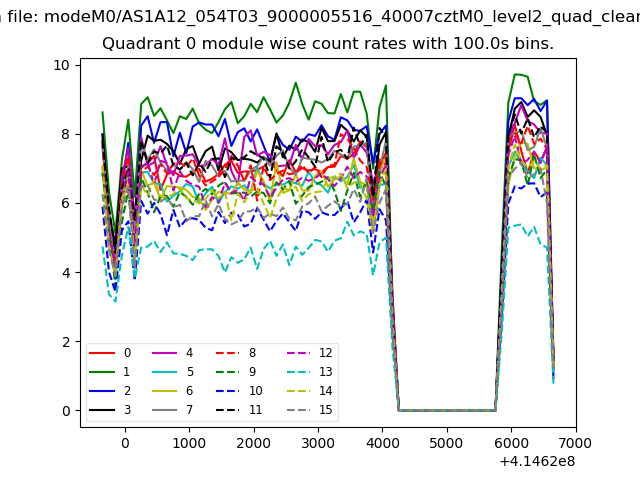 |
 |
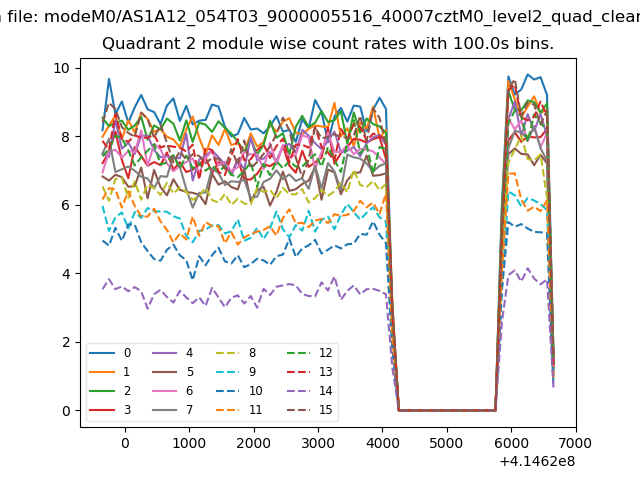
| Module-wise count rates for Quadrant B Data is divided into 100 sec bins |
 |
 |
| Module-wise count rates for Quadrant C Data is divided into 100 sec bins |
 |
 |
| Module-wise count rates for Quadrant D Data is divided into 100 sec bins |
 |
 |
| Parameter | Plot |
|---|---|
| CZT HV Monitor | 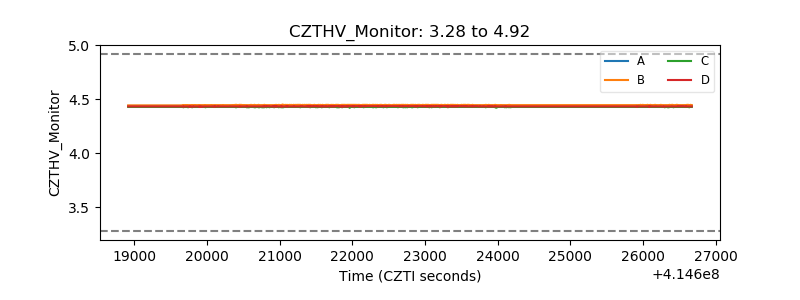 |
| D_VDD | 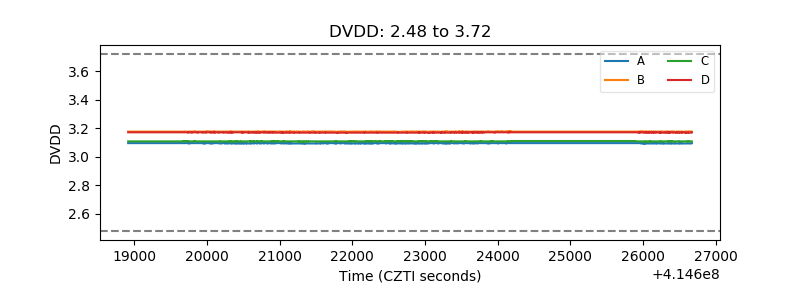 |
| Temperature 1 | 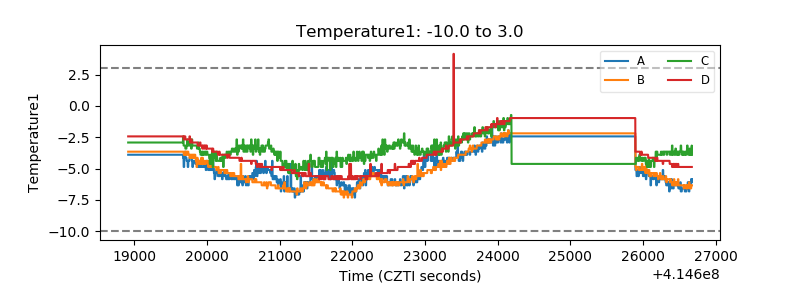 |
| Veto HV Monitor | 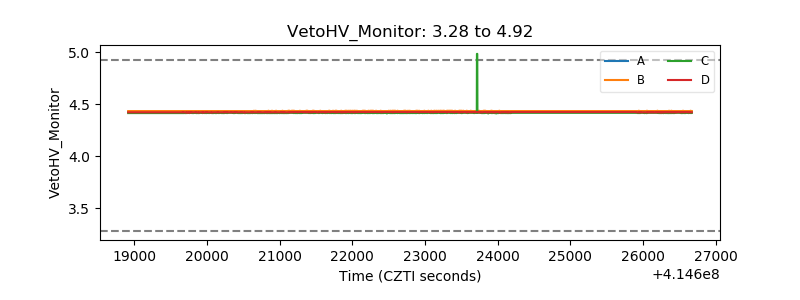 |
| Veto LLD | 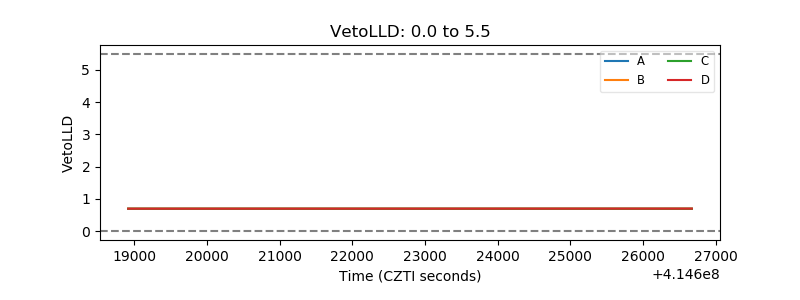 |
| Alpha Counter | 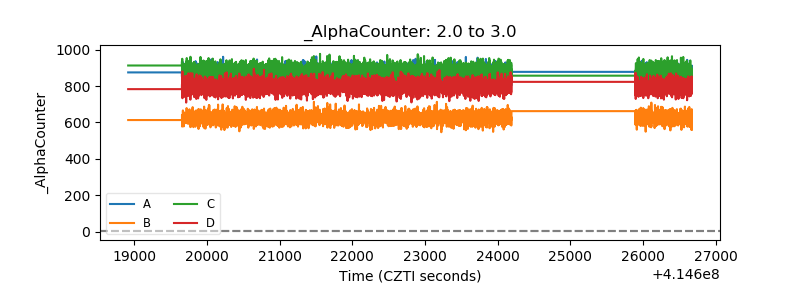 |
| _CPM_Rate | 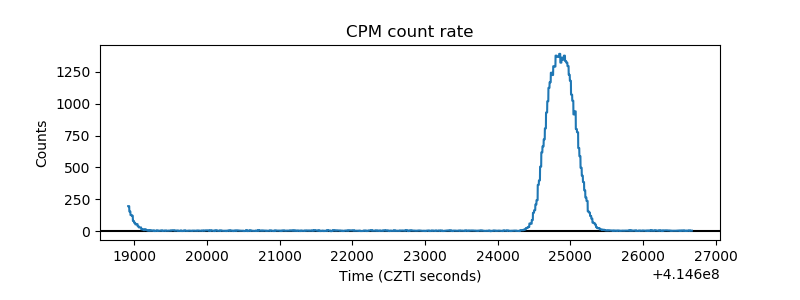 |
| CZT Counter | 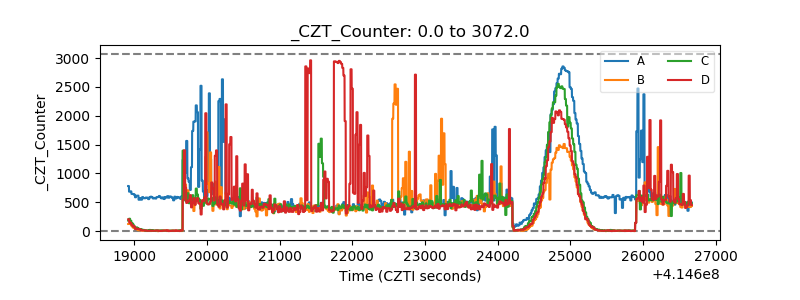 |
| +2.5 Volts monitor | 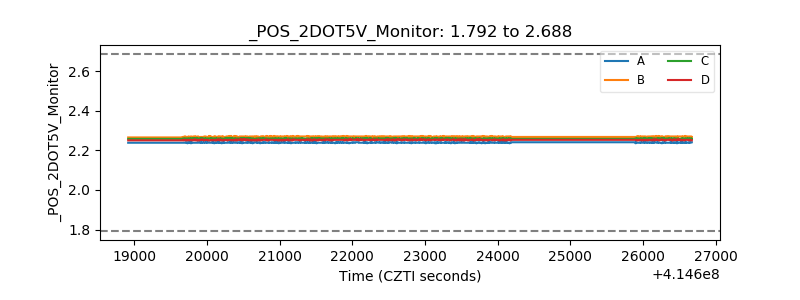 |
| +5 Volts monitor | 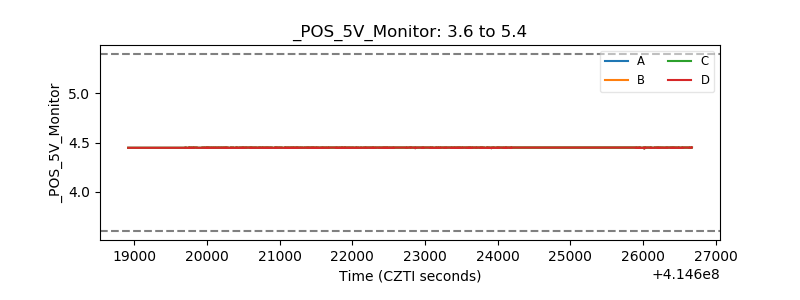 |
| _ROLL_ROT | 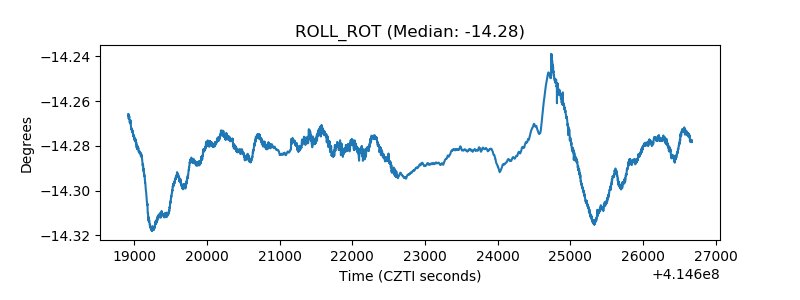 |
| _Roll_DEC | 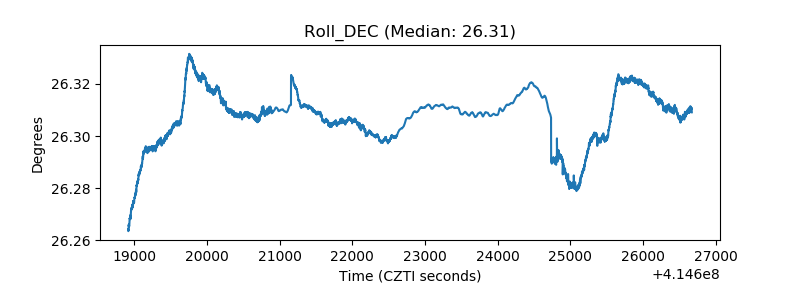 |
| _Roll_RA | 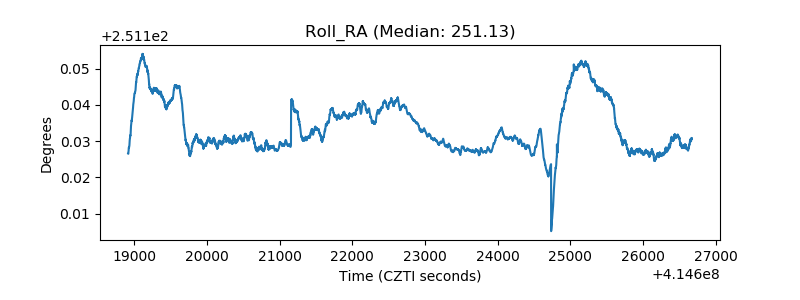 |
| Veto Counter | 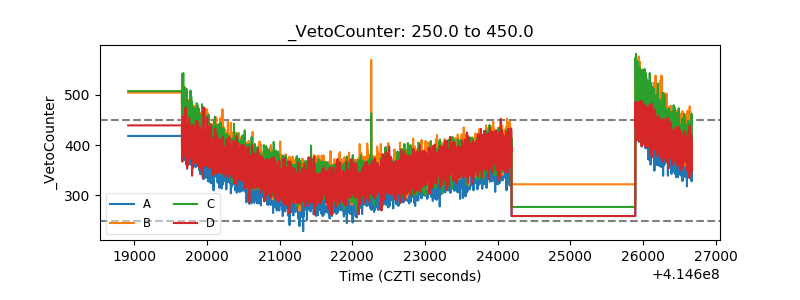 |