| Param | Original file | Final file |
|---|---|---|
| Filename | modeM0/AS1A12_054T03_9000005516_40010cztM0_level2.fits | modeM0/AS1A12_054T03_9000005516_40010cztM0_level2_quad_clean.evt |
| Size (bytes) | 302,901,120 | 91,555,200 |
| Size | 288.9 MB | 87.3 MB |
| Events in quadrant A | 2,856,910 | 614,876 |
| Events in quadrant B | 2,775,231 | 638,341 |
| Events in quadrant C | 2,498,780 | 613,490 |
| Events in quadrant D | 2,683,237 | 547,834 |
| Mode M9 | |||
|---|---|---|---|
| Quadrant | BADHDUFLAG | Total packets | Discarded packets |
| A | 0 | 29 | 0 |
| B | 0 | 29 | 0 |
| C | 0 | 29 | 0 |
| D | 0 | 30 | 0 |
| Mode SS | |||
|---|---|---|---|
| Quadrant | BADHDUFLAG | Total packets | Discarded packets |
| A | 0 | 104 | 0 |
| B | 0 | 104 | 0 |
| C | 0 | 104 | 0 |
| D | 0 | 104 | 0 |
| Mode M0 | |||
|---|---|---|---|
| Quadrant | BADHDUFLAG | Total packets | Discarded packets |
| A | 0 | 11706 | 3 |
| B | 0 | 11635 | 2 |
| C | 0 | 10551 | 2 |
| D | 0 | 11767 | 2 |
| Quadrant | Total seconds | Saturated seconds | Saturation percentage |
|---|---|---|---|
| A | 5108 | 49 | 0.959280% |
| B | 5108 | 108 | 2.114330% |
| C | 5108 | 16 | 0.313234% |
| D | 5108 | 106 | 2.075176% |
Noise dominated data is calculated using 1-second bins in cleaned event files. If a bin has >2000 counts, and if more than 50% of those come from <1% of pixels, then it is considered to be noise-dominated and hence unusable.
| Quadrant | # 1 sec bins | Bins with >0 counts | Bins with >2000 counts | High rate bins dominated by noise | Noise dominated (total time) | Noise dominated (detector-on time) | Marked lightcurve |
|---|---|---|---|---|---|---|---|
| A | 7079 | 5109 | 31 | 31 | 0.44% | 0.61% | 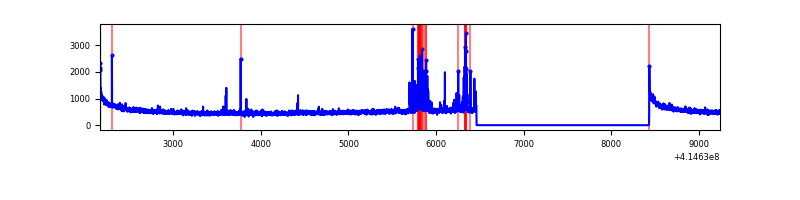 |
| B | 7079 | 5109 | 74 | 74 | 1.05% | 1.45% | 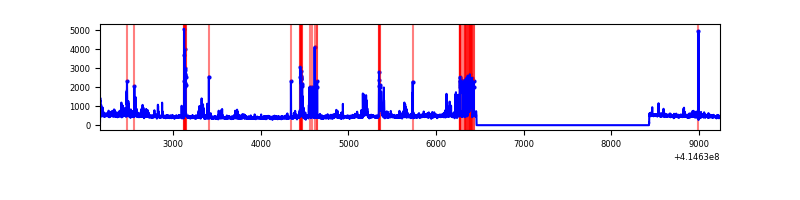 |
| C | 7079 | 5109 | 13 | 13 | 0.18% | 0.25% | 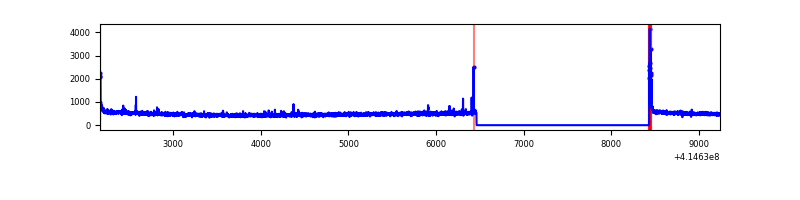 |
| D | 7079 | 5109 | 82 | 82 | 1.16% | 1.61% |  |
Top three noisy pixels from each quadrant. If the there are fewer than three noisy pixels in the level2.evt file, extra rows are filled as -1
| Pixel properties | Quadrant properties | ||||||
|---|---|---|---|---|---|---|---|
| Quadrant | DetID | PixID | Counts | Sigma | Mean | Median | Sigma |
| A | 10 | 83 | 430419 | 3681.13 | 574 | 562 | 116.8 |
| A | 13 | 248 | 175870 | 1501.27 | 574 | 562 | 116.8 |
| A | 6 | 10 | 11496 | 93.63 | 574 | 562 | 116.8 |
| B | 4 | 171 | 360939 | 3259.46 | 578 | 563 | 110.6 |
| B | 6 | 203 | 128609 | 1158.12 | 578 | 563 | 110.6 |
| B | 12 | 111 | 13509 | 117.09 | 578 | 563 | 110.6 |
| C | 15 | 214 | 212556 | 1598.09 | 566 | 572 | 132.6 |
| C | 0 | 10 | 32649 | 241.82 | 566 | 572 | 132.6 |
| C | 10 | 20 | 24120 | 177.52 | 566 | 572 | 132.6 |
| D | 2 | 250 | 239450 | 1772.45 | 552 | 537 | 134.8 |
| D | 12 | 227 | 170875 | 1263.7 | 552 | 537 | 134.8 |
| D | 13 | 249 | 112737 | 832.39 | 552 | 537 | 134.8 |
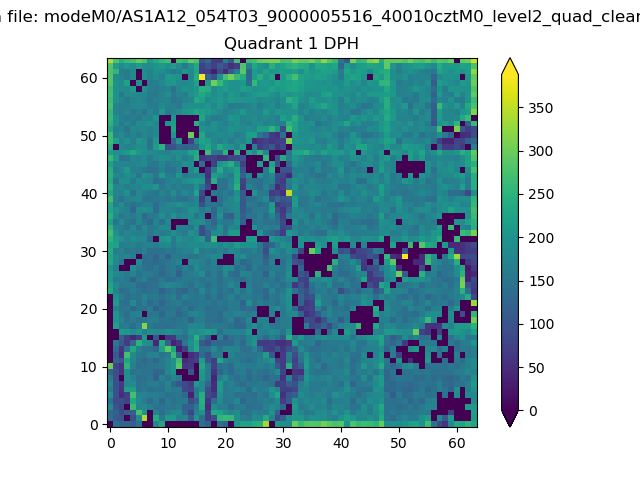
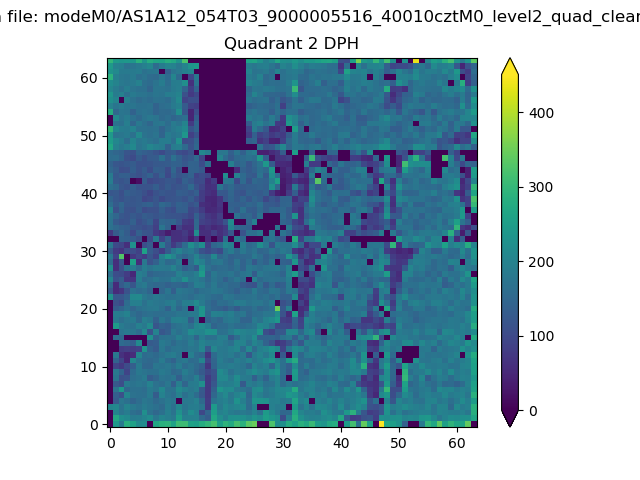
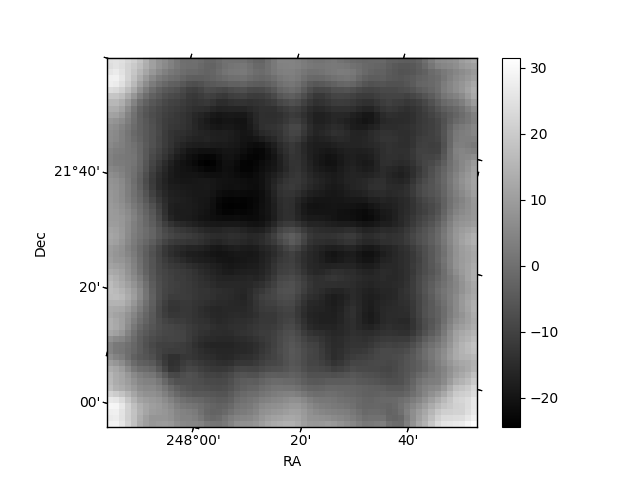
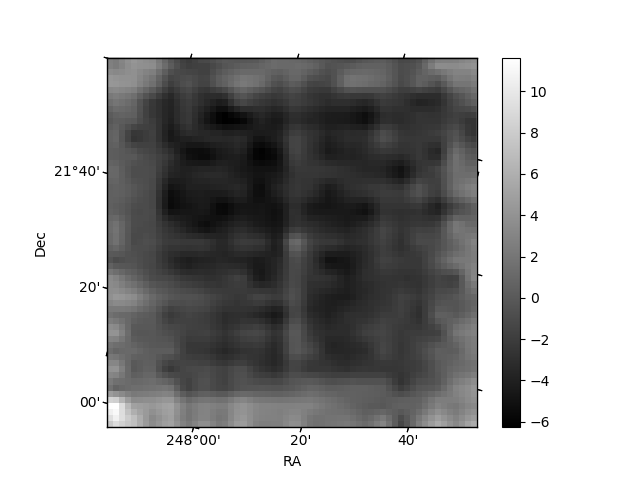
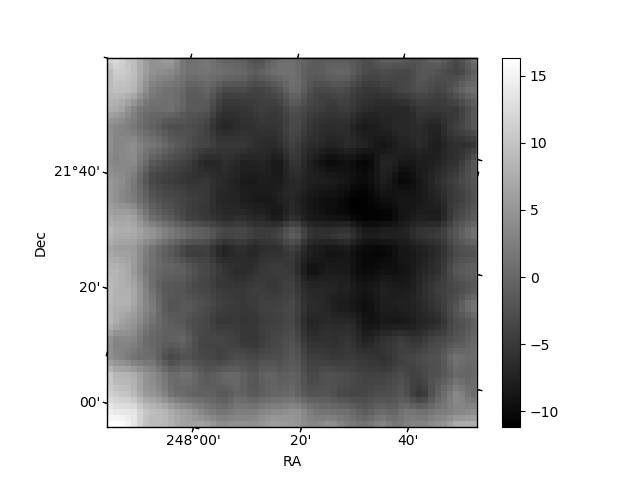
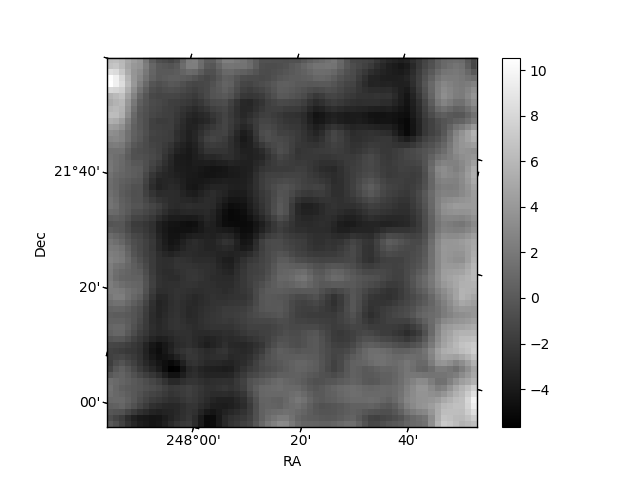
Histogram calculated using DETX and DETY for each event in the final _common_clean file
| Quadrant A | 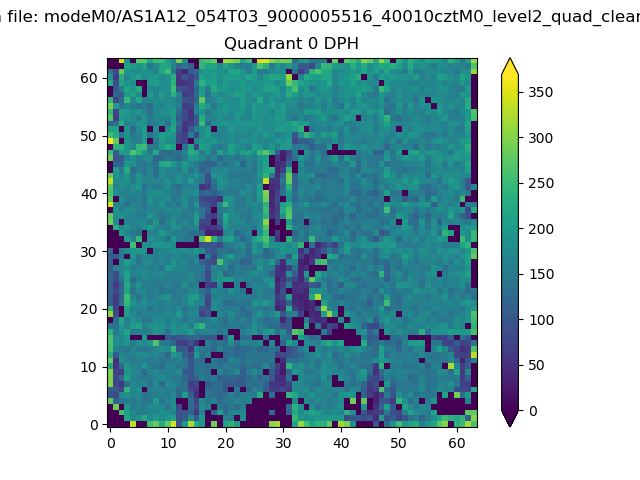 |
 |
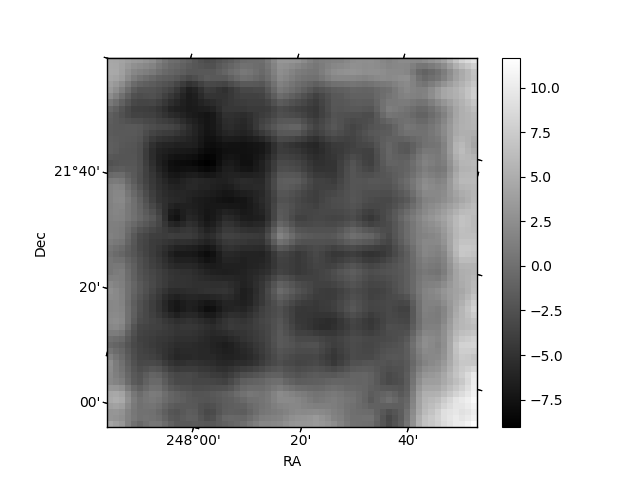
Quadrant B |
|---|---|---|---|
| Quadrant D | 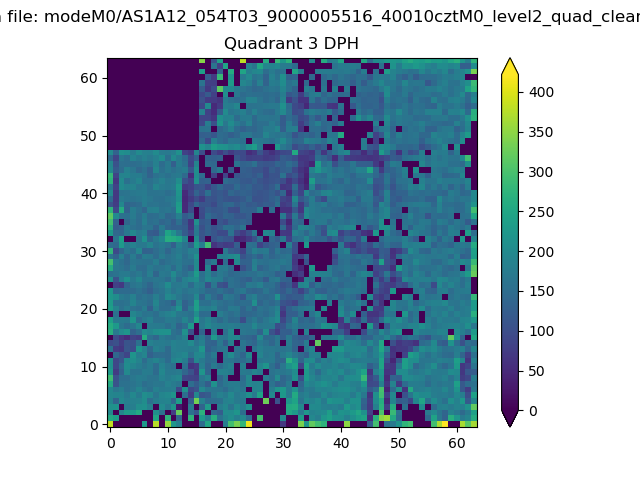 |
 |
Quadrant C |
| Plot type | Count rate plots | Images |
|---|---|---|
| Comparison with Poisson distribution Blue bars denote a histogram of data divided into 1 sec bins. Red curve is a Poisson curve with rate = median count rate of data. |
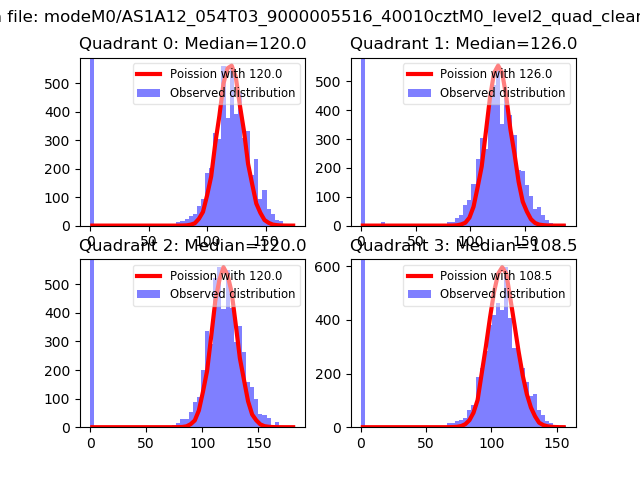 |
 |
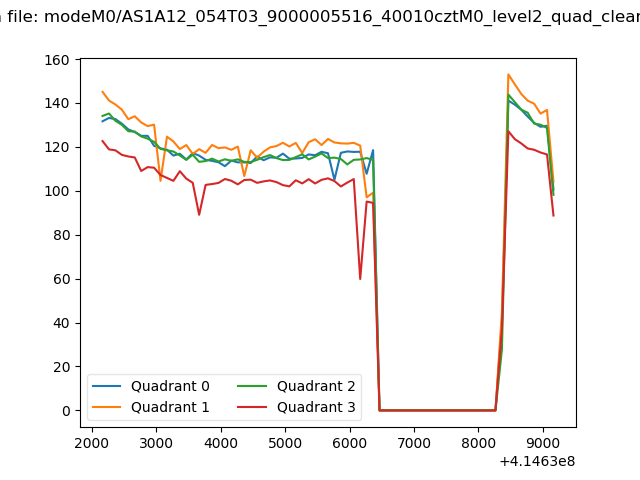
| Quadrant-wise count rates Data is divided into 100 sec bins |
 |
|
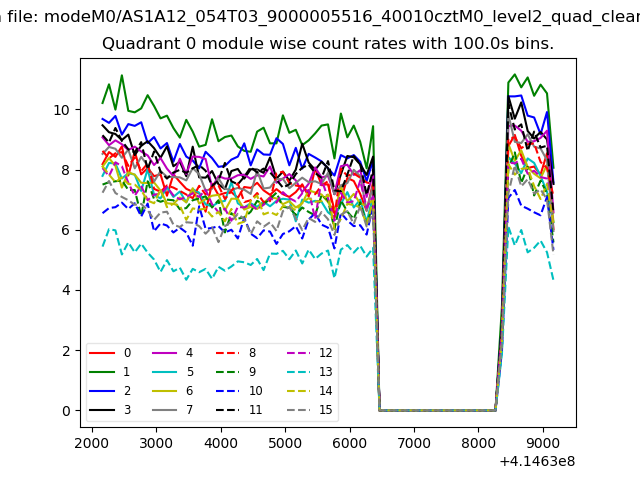
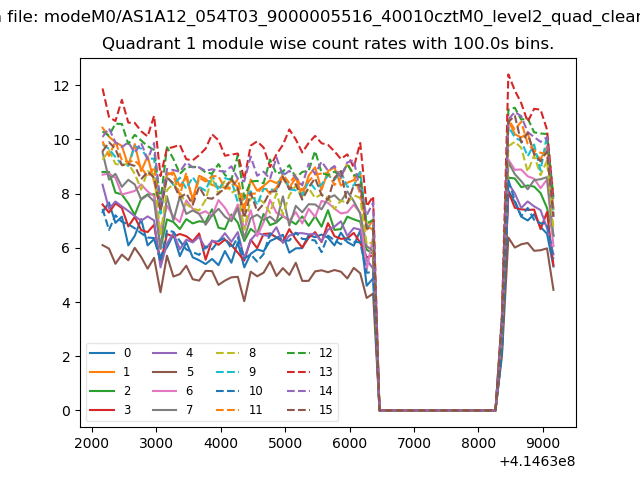
| Module-wise count rates for Quadrant A Data is divided into 100 sec bins |
 |
 |
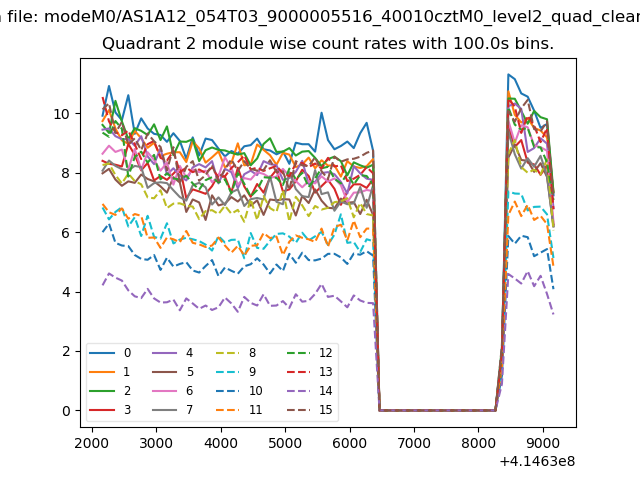
| Module-wise count rates for Quadrant B Data is divided into 100 sec bins |
 |
 |
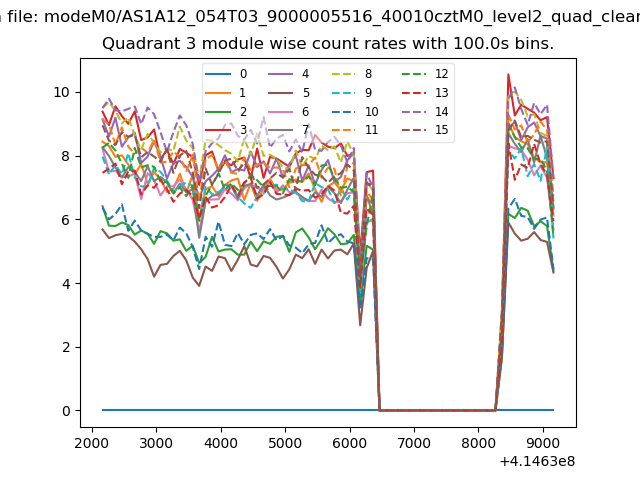
| Module-wise count rates for Quadrant C Data is divided into 100 sec bins |
 |
 |
| Module-wise count rates for Quadrant D Data is divided into 100 sec bins |
 |
 |
| Parameter | Plot |
|---|---|
| CZT HV Monitor | 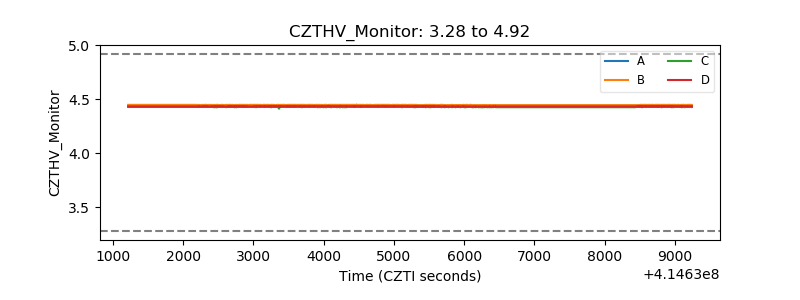 |
| D_VDD | 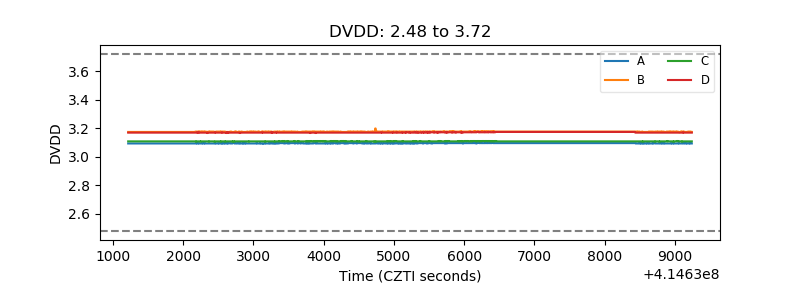 |
| Temperature 1 | 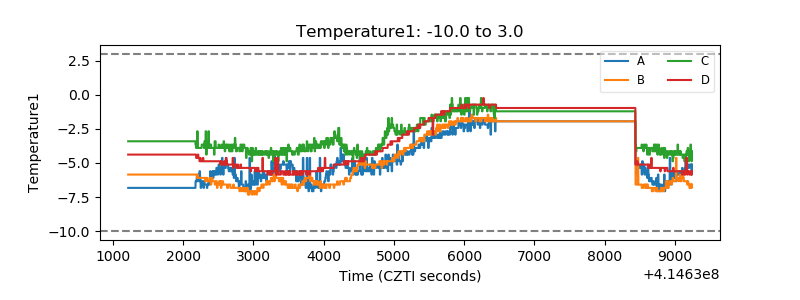 |
| Veto HV Monitor | 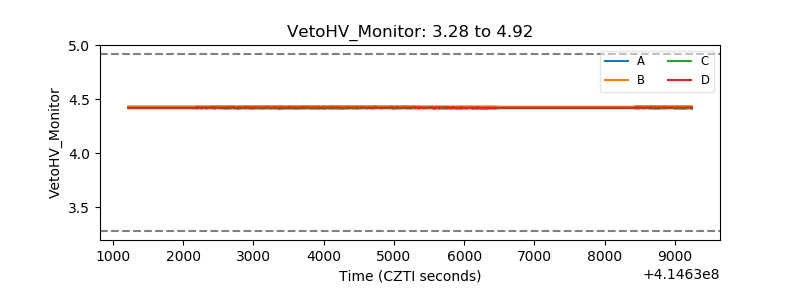 |
| Veto LLD | 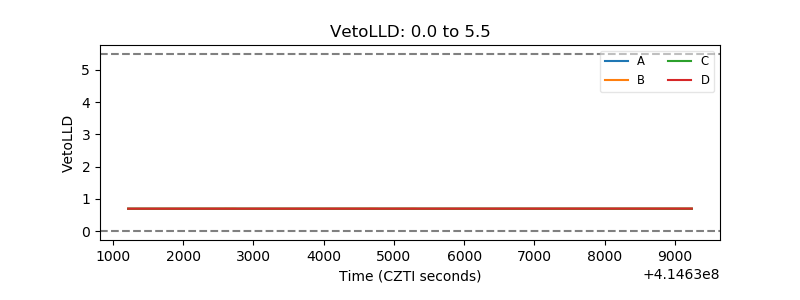 |
| Alpha Counter | 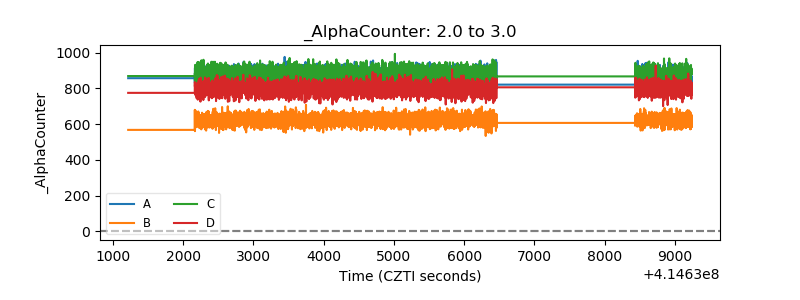 |
| _CPM_Rate | 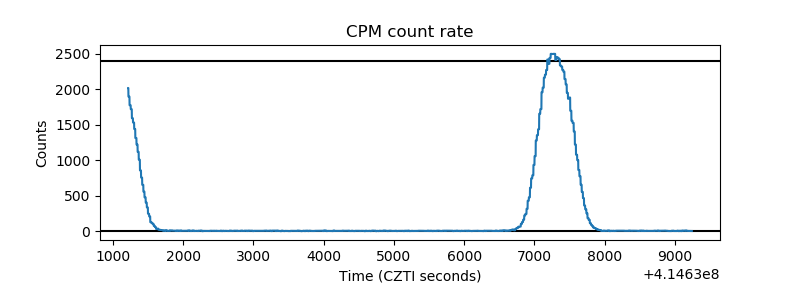 |
| CZT Counter | 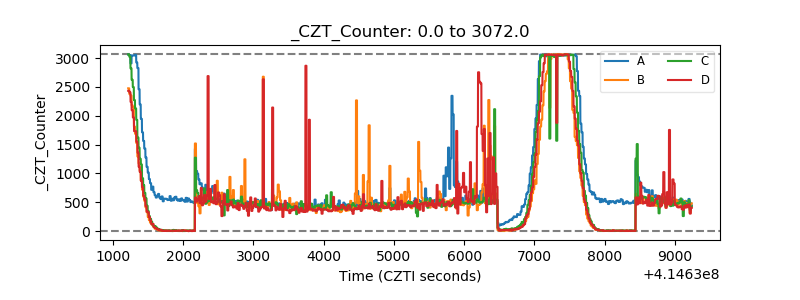 |
| +2.5 Volts monitor | 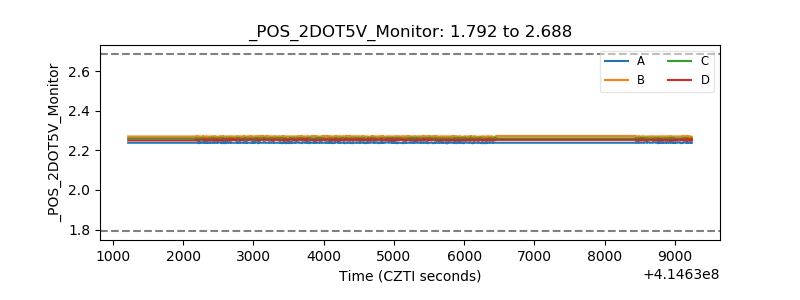 |
| +5 Volts monitor | 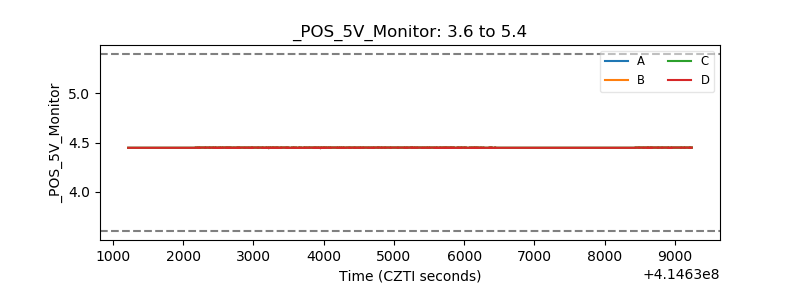 |
| _ROLL_ROT | 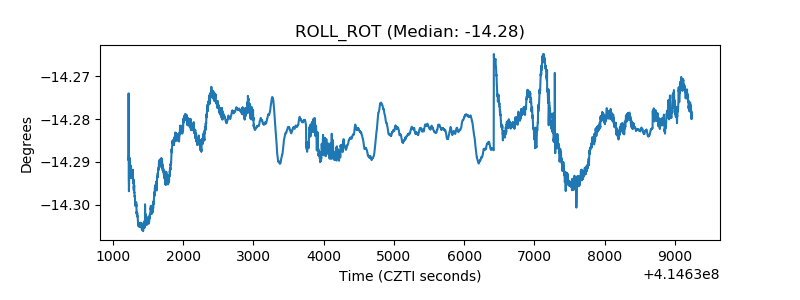 |
| _Roll_DEC | 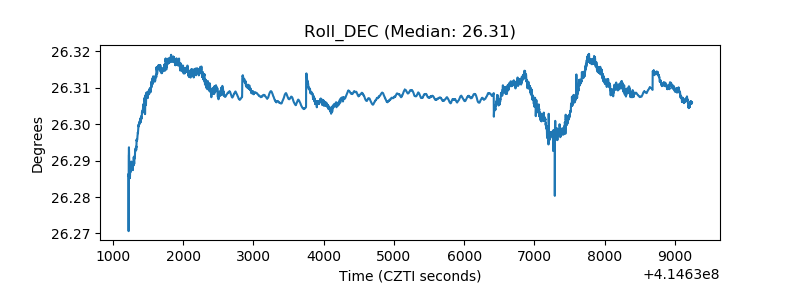 |
| _Roll_RA | 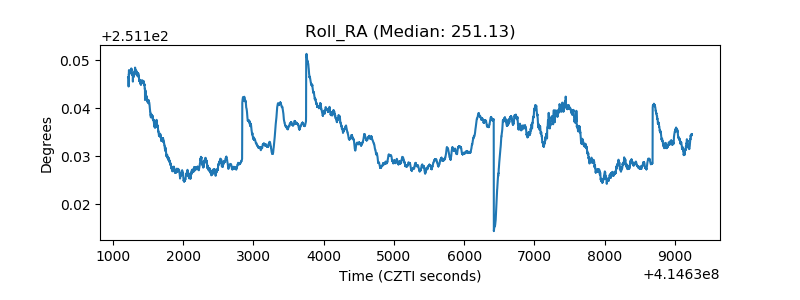 |
| Veto Counter | 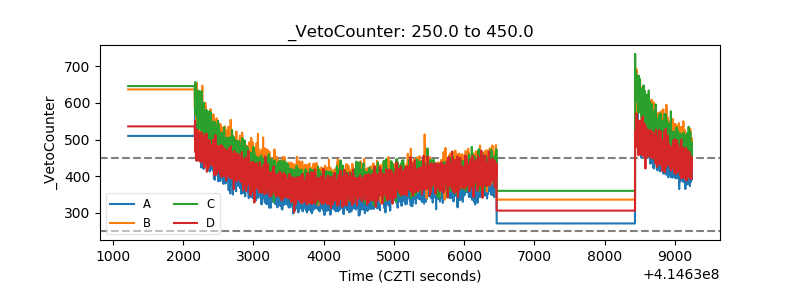 |