| Param | Original file | Final file |
|---|---|---|
| Filename | modeM0/AS1A12_054T03_9000005516_40011cztM0_level2.fits | modeM0/AS1A12_054T03_9000005516_40011cztM0_level2_quad_clean.evt |
| Size (bytes) | 327,867,840 | 97,372,800 |
| Size | 312.7 MB | 92.9 MB |
| Events in quadrant A | 2,939,859 | 658,636 |
| Events in quadrant B | 2,833,984 | 688,341 |
| Events in quadrant C | 2,619,677 | 652,258 |
| Events in quadrant D | 3,327,751 | 576,032 |
| Mode M9 | |||
|---|---|---|---|
| Quadrant | BADHDUFLAG | Total packets | Discarded packets |
| A | 0 | 31 | 0 |
| B | 0 | 31 | 0 |
| C | 0 | 31 | 0 |
| D | 0 | 32 | 0 |
| Mode SS | |||
|---|---|---|---|
| Quadrant | BADHDUFLAG | Total packets | Discarded packets |
| A | 0 | 110 | 0 |
| B | 0 | 110 | 0 |
| C | 0 | 110 | 0 |
| D | 0 | 110 | 0 |
| Mode M0 | |||
|---|---|---|---|
| Quadrant | BADHDUFLAG | Total packets | Discarded packets |
| A | 0 | 11975 | 3 |
| B | 0 | 11911 | 2 |
| C | 0 | 10968 | 2 |
| D | 0 | 13791 | 2 |
| Quadrant | Total seconds | Saturated seconds | Saturation percentage |
|---|---|---|---|
| A | 5331 | 36 | 0.675295% |
| B | 5331 | 88 | 1.650722% |
| C | 5331 | 16 | 0.300131% |
| D | 5331 | 182 | 3.413994% |
Noise dominated data is calculated using 1-second bins in cleaned event files. If a bin has >2000 counts, and if more than 50% of those come from <1% of pixels, then it is considered to be noise-dominated and hence unusable.
| Quadrant | # 1 sec bins | Bins with >0 counts | Bins with >2000 counts | High rate bins dominated by noise | Noise dominated (total time) | Noise dominated (detector-on time) | Marked lightcurve |
|---|---|---|---|---|---|---|---|
| A | 7394 | 5332 | 22 | 22 | 0.30% | 0.41% | 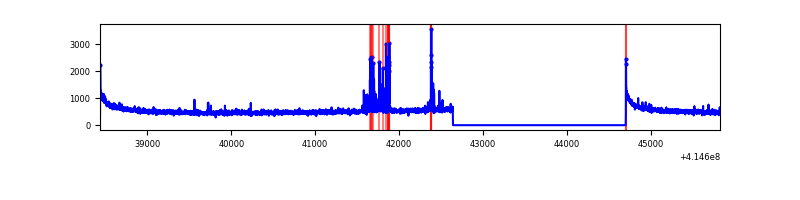 |
| B | 7394 | 5332 | 62 | 62 | 0.84% | 1.16% | 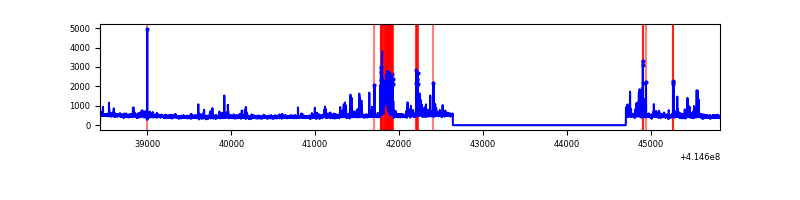 |
| C | 7394 | 5332 | 12 | 12 | 0.16% | 0.23% | 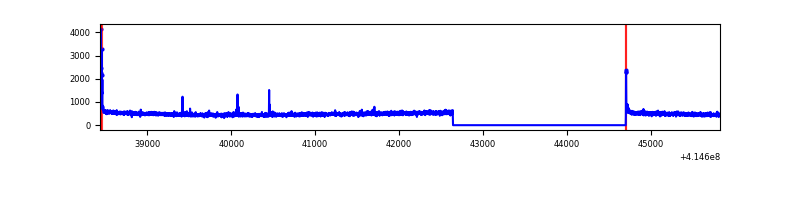 |
| D | 7394 | 5332 | 141 | 141 | 1.91% | 2.64% | 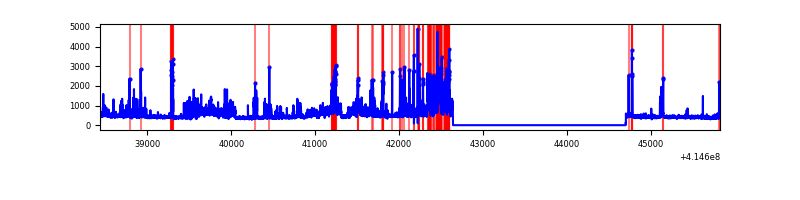 |
Top three noisy pixels from each quadrant. If the there are fewer than three noisy pixels in the level2.evt file, extra rows are filled as -1
| Pixel properties | Quadrant properties | ||||||
|---|---|---|---|---|---|---|---|
| Quadrant | DetID | PixID | Counts | Sigma | Mean | Median | Sigma |
| A | 10 | 83 | 444265 | 3608.66 | 606 | 597 | 122.9 |
| A | 13 | 248 | 128204 | 1037.92 | 606 | 597 | 122.9 |
| A | 2 | 79 | 16779 | 131.62 | 606 | 597 | 122.9 |
| B | 4 | 171 | 424289 | 3657.67 | 610 | 595 | 115.8 |
| B | 12 | 111 | 13926 | 115.08 | 610 | 595 | 115.8 |
| B | 11 | 111 | 12779 | 105.18 | 610 | 595 | 115.8 |
| C | 15 | 214 | 222560 | 1613.16 | 595 | 603 | 137.6 |
| C | 0 | 10 | 35117 | 250.84 | 595 | 603 | 137.6 |
| C | 10 | 20 | 25206 | 178.81 | 595 | 603 | 137.6 |
| D | 12 | 227 | 576013 | 4070.99 | 580 | 564 | 141.4 |
| D | 2 | 250 | 355402 | 2510.28 | 580 | 564 | 141.4 |
| D | 13 | 249 | 98888 | 695.59 | 580 | 564 | 141.4 |
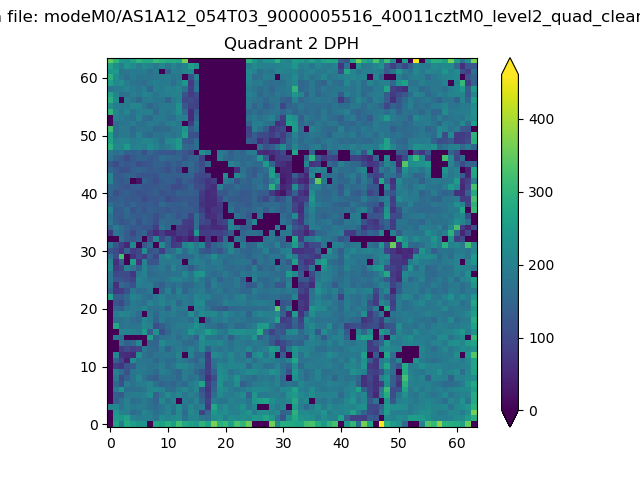
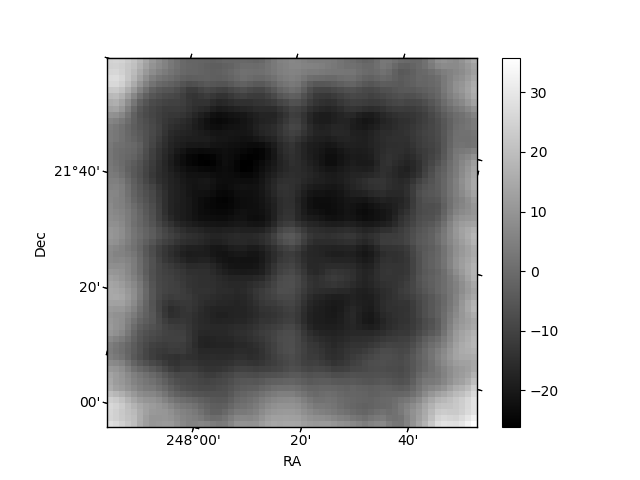
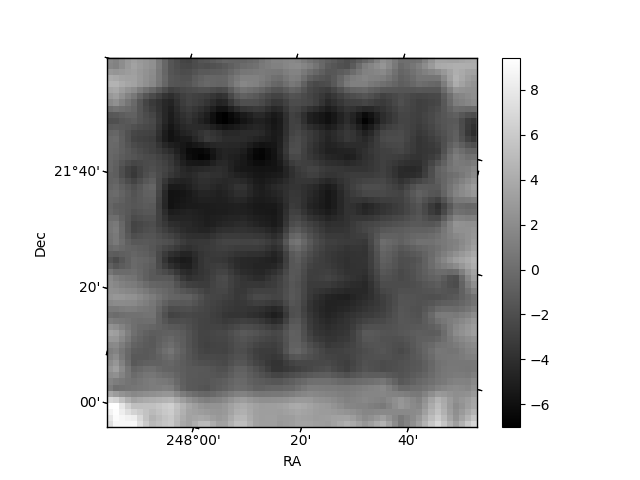
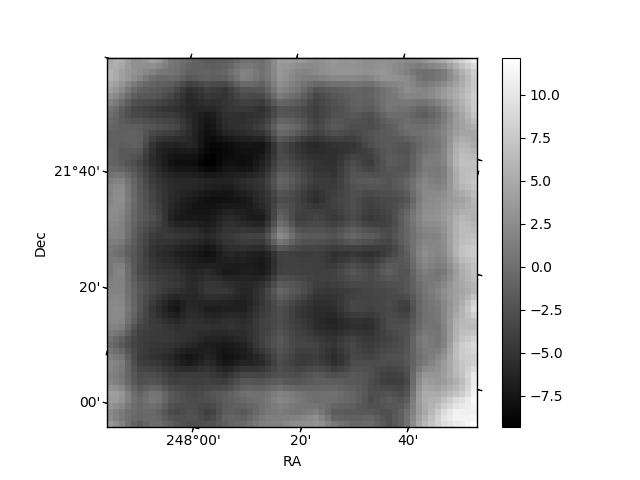
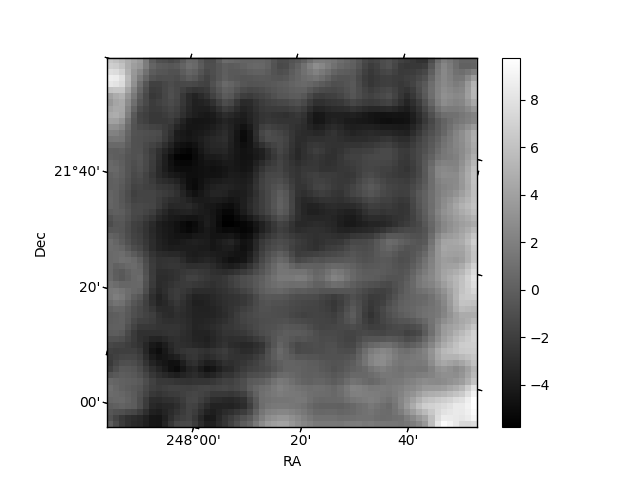
Histogram calculated using DETX and DETY for each event in the final _common_clean file
| Quadrant A | 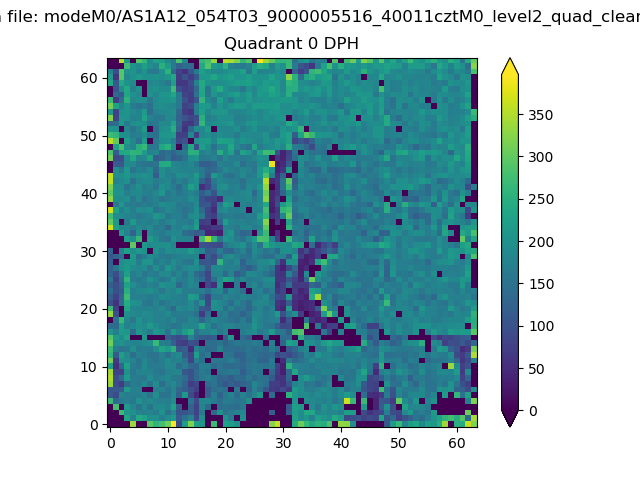 |
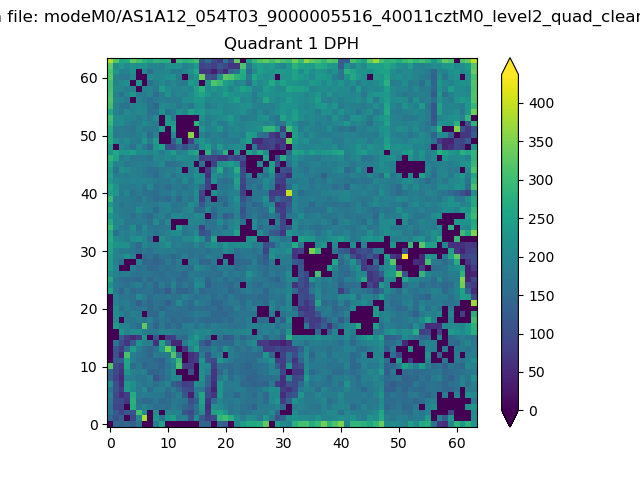 |
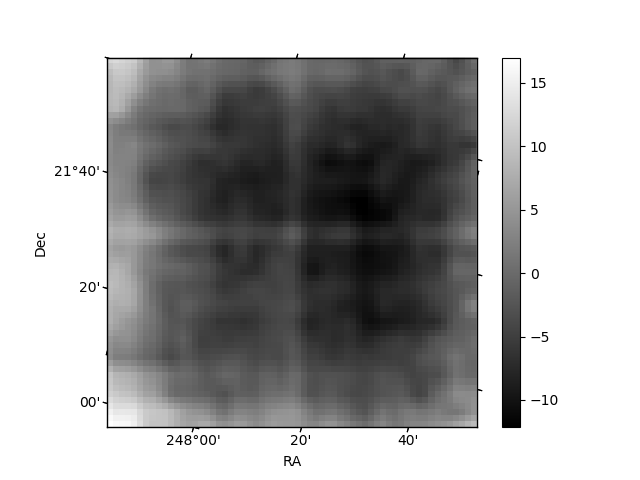
Quadrant B |
|---|---|---|---|
| Quadrant D | 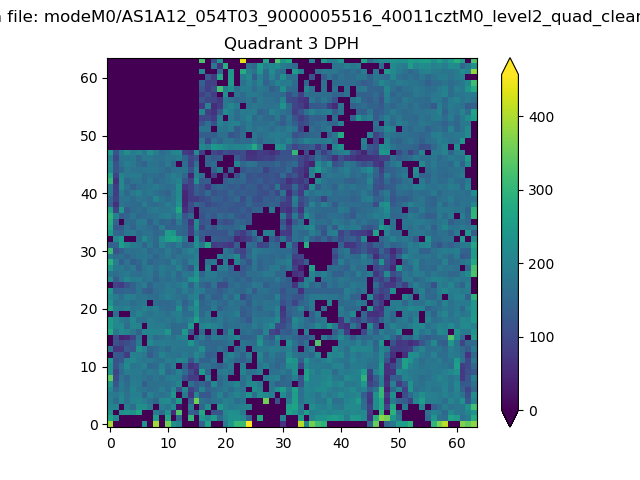 |
 |
Quadrant C |
| Plot type | Count rate plots | Images |
|---|---|---|
| Comparison with Poisson distribution Blue bars denote a histogram of data divided into 1 sec bins. Red curve is a Poisson curve with rate = median count rate of data. |
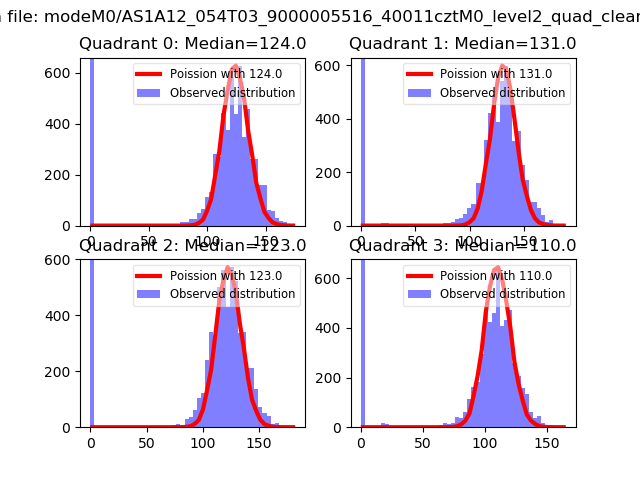 |
 |
| Quadrant-wise count rates Data is divided into 100 sec bins |
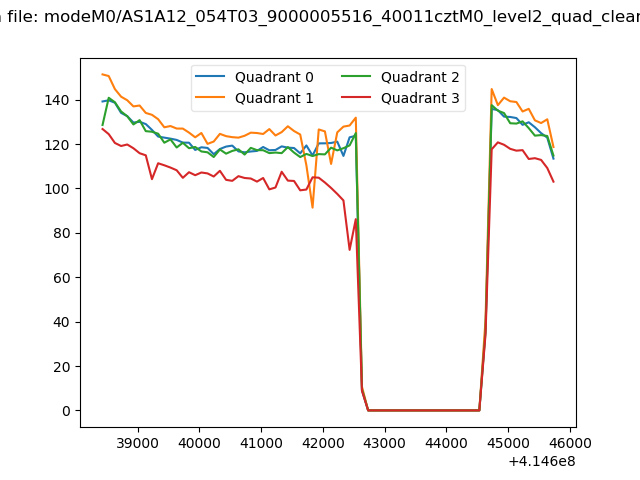 |
|
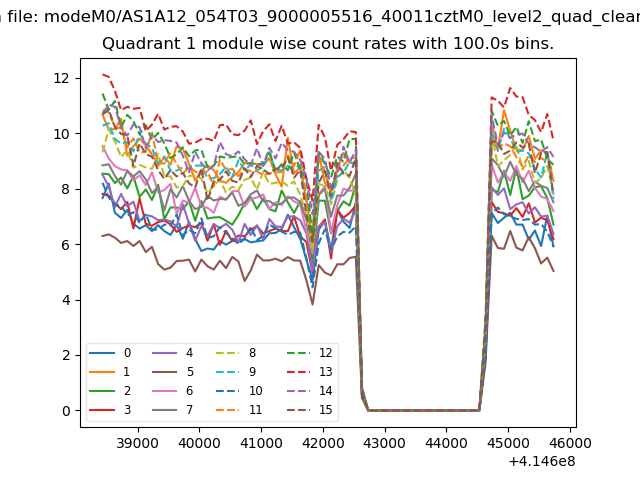
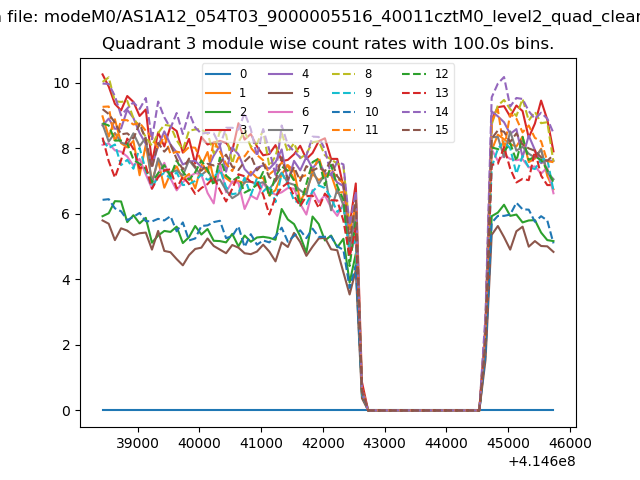
| Module-wise count rates for Quadrant A Data is divided into 100 sec bins |
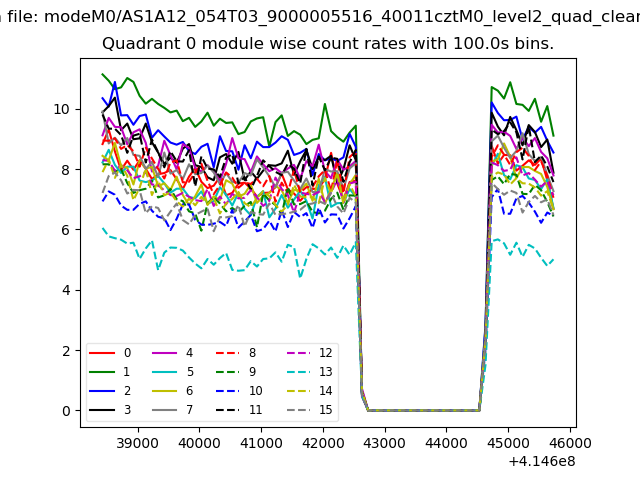 |
 |
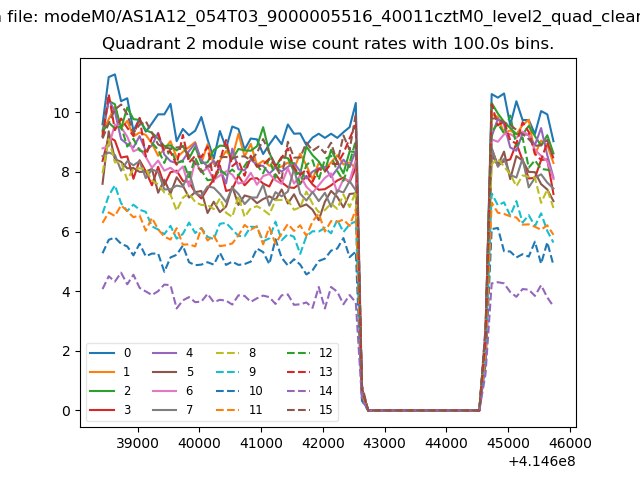
| Module-wise count rates for Quadrant B Data is divided into 100 sec bins |
 |
 |
| Module-wise count rates for Quadrant C Data is divided into 100 sec bins |
 |
 |
| Module-wise count rates for Quadrant D Data is divided into 100 sec bins |
 |
 |
| Parameter | Plot |
|---|---|
| CZT HV Monitor | 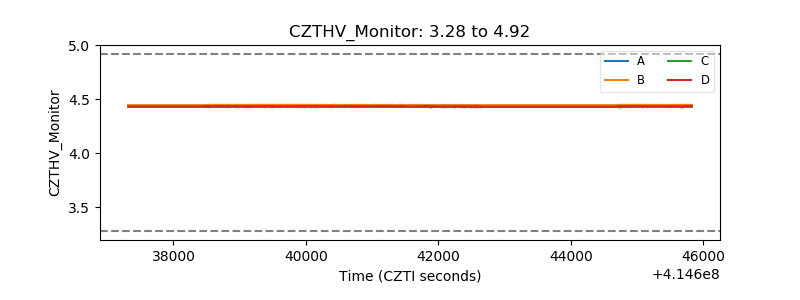 |
| D_VDD | 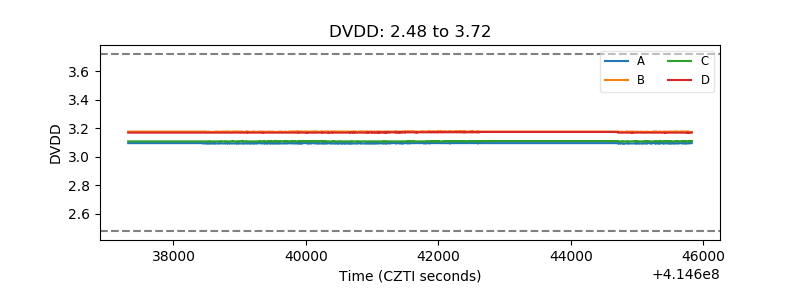 |
| Temperature 1 | 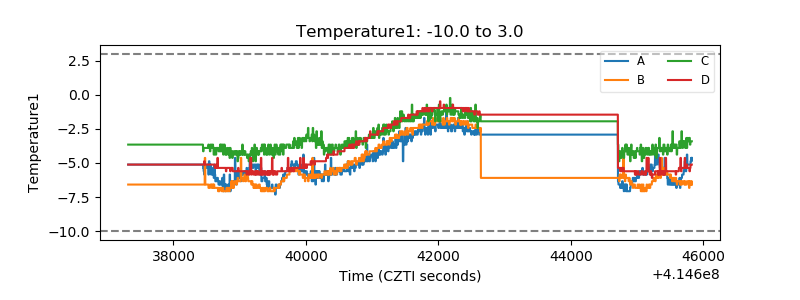 |
| Veto HV Monitor | 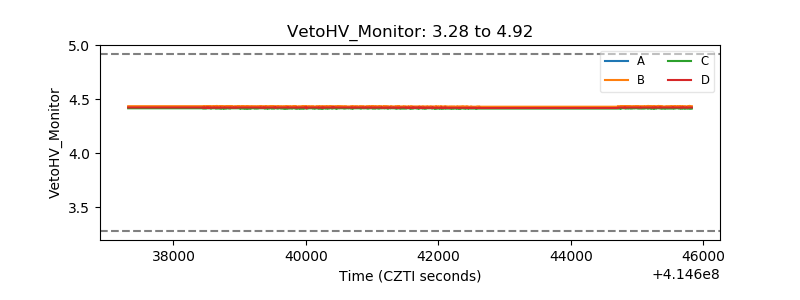 |
| Veto LLD | 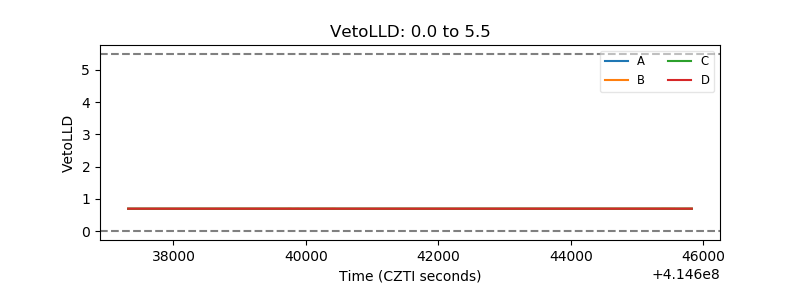 |
| Alpha Counter | 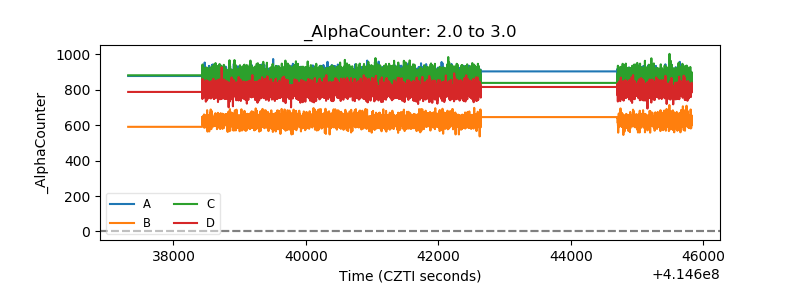 |
| _CPM_Rate | 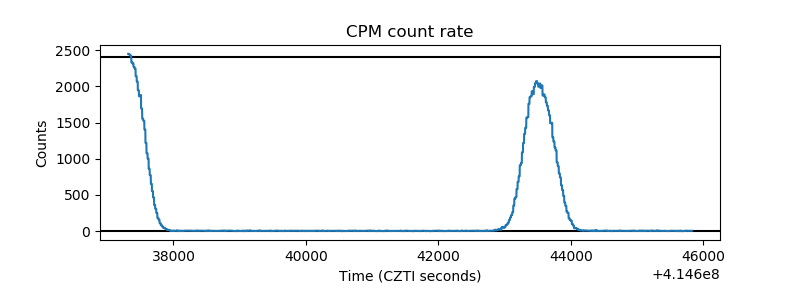 |
| CZT Counter | 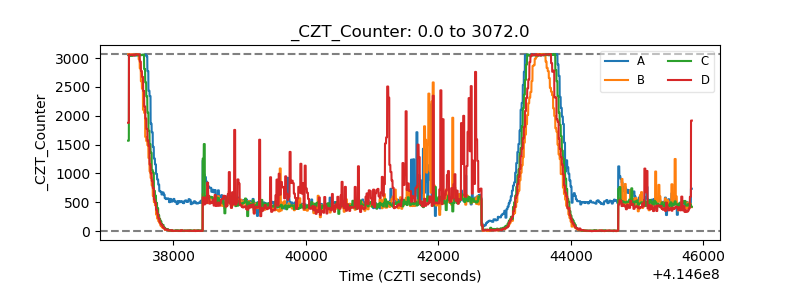 |
| +2.5 Volts monitor | 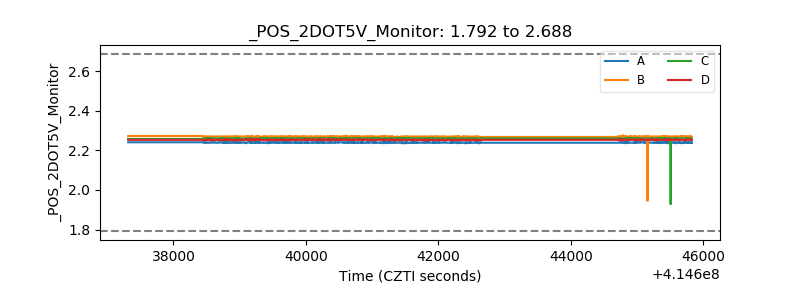 |
| +5 Volts monitor | 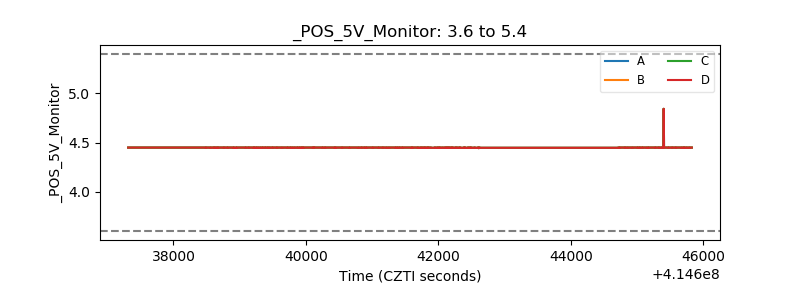 |
| _ROLL_ROT | 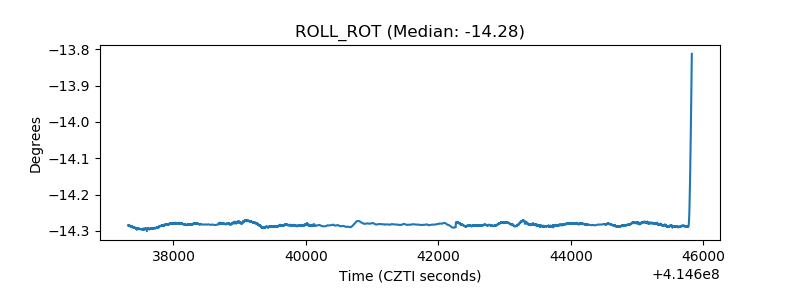 |
| _Roll_DEC | 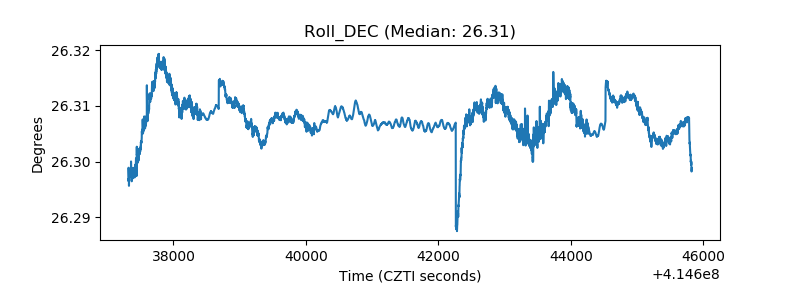 |
| _Roll_RA | 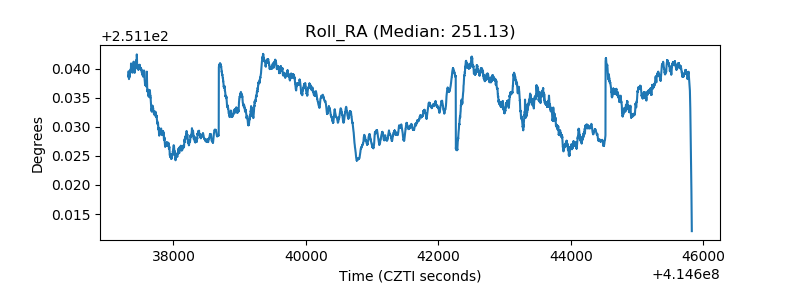 |
| Veto Counter | 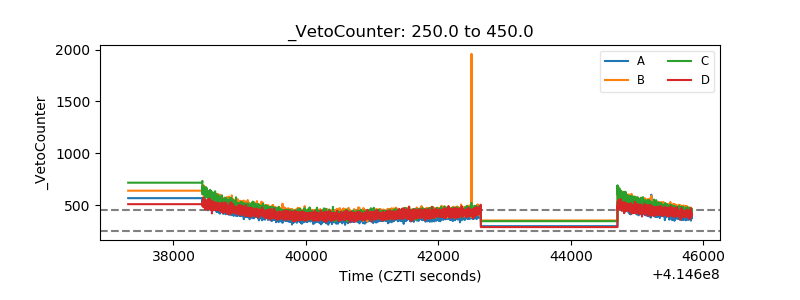 |