| Param | Original file | Final file |
|---|---|---|
| Filename | modeM0/AS1A12_054T03_9000005516_40012cztM0_level2.fits | modeM0/AS1A12_054T03_9000005516_40012cztM0_level2_quad_clean.evt |
| Size (bytes) | 304,672,320 | 94,651,200 |
| Size | 290.6 MB | 90.3 MB |
| Events in quadrant A | 2,810,066 | 639,290 |
| Events in quadrant B | 2,947,567 | 658,804 |
| Events in quadrant C | 2,546,030 | 630,510 |
| Events in quadrant D | 2,565,214 | 569,901 |
| Mode M9 | |||
|---|---|---|---|
| Quadrant | BADHDUFLAG | Total packets | Discarded packets |
| A | 0 | 34 | 0 |
| B | 0 | 34 | 0 |
| C | 0 | 34 | 0 |
| D | 0 | 35 | 0 |
| Mode SS | |||
|---|---|---|---|
| Quadrant | BADHDUFLAG | Total packets | Discarded packets |
| A | 0 | 108 | 0 |
| B | 0 | 108 | 0 |
| C | 0 | 108 | 0 |
| D | 0 | 108 | 0 |
| Mode M0 | |||
|---|---|---|---|
| Quadrant | BADHDUFLAG | Total packets | Discarded packets |
| A | 0 | 11460 | 3 |
| B | 0 | 12317 | 2 |
| C | 0 | 10748 | 2 |
| D | 0 | 11484 | 2 |
| Quadrant | Total seconds | Saturated seconds | Saturation percentage |
|---|---|---|---|
| A | 5246 | 10 | 0.190621% |
| B | 5246 | 117 | 2.230271% |
| C | 5246 | 8 | 0.152497% |
| D | 5246 | 63 | 1.200915% |
Noise dominated data is calculated using 1-second bins in cleaned event files. If a bin has >2000 counts, and if more than 50% of those come from <1% of pixels, then it is considered to be noise-dominated and hence unusable.
| Quadrant | # 1 sec bins | Bins with >0 counts | Bins with >2000 counts | High rate bins dominated by noise | Noise dominated (total time) | Noise dominated (detector-on time) | Marked lightcurve |
|---|---|---|---|---|---|---|---|
| A | 7369 | 5247 | 5 | 5 | 0.07% | 0.10% | 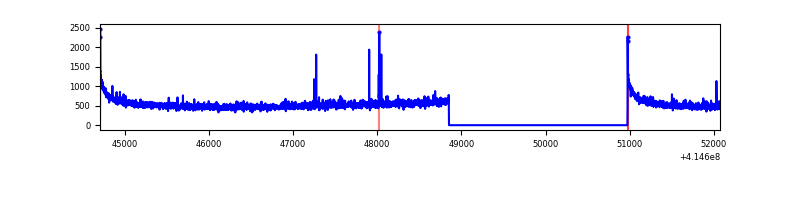 |
| B | 7369 | 5247 | 61 | 61 | 0.83% | 1.16% | 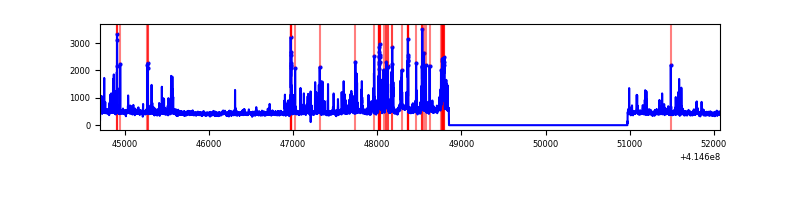 |
| C | 7369 | 5247 | 5 | 5 | 0.07% | 0.10% | 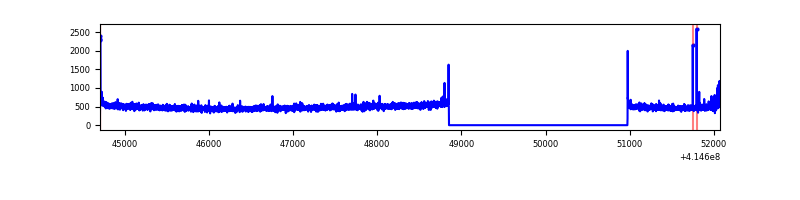 |
| D | 7369 | 5247 | 53 | 53 | 0.72% | 1.01% | 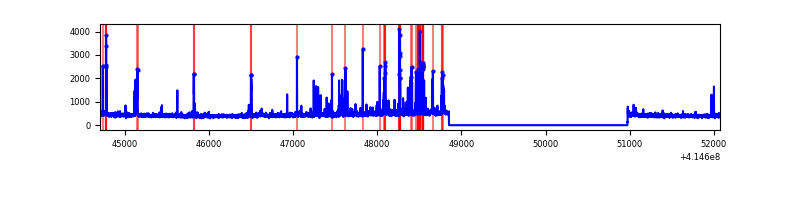 |
Top three noisy pixels from each quadrant. If the there are fewer than three noisy pixels in the level2.evt file, extra rows are filled as -1
| Pixel properties | Quadrant properties | ||||||
|---|---|---|---|---|---|---|---|
| Quadrant | DetID | PixID | Counts | Sigma | Mean | Median | Sigma |
| A | 10 | 83 | 456766 | 3785.63 | 595 | 585 | 120.5 |
| A | 2 | 79 | 29391 | 239.05 | 595 | 585 | 120.5 |
| A | 13 | 248 | 15030 | 119.87 | 595 | 585 | 120.5 |
| B | 4 | 171 | 528667 | 4612.39 | 593 | 578 | 114.5 |
| B | 4 | 81 | 59020 | 510.44 | 593 | 578 | 114.5 |
| B | 0 | 230 | 17015 | 143.56 | 593 | 578 | 114.5 |
| C | 15 | 214 | 221320 | 1643.97 | 581 | 586 | 134.3 |
| C | 14 | 254 | 27137 | 197.74 | 581 | 586 | 134.3 |
| C | 0 | 10 | 19359 | 139.82 | 581 | 586 | 134.3 |
| D | 12 | 227 | 121139 | 863.9 | 572 | 557 | 139.6 |
| D | 13 | 249 | 96331 | 686.16 | 572 | 557 | 139.6 |
| D | 2 | 250 | 66091 | 469.51 | 572 | 557 | 139.6 |
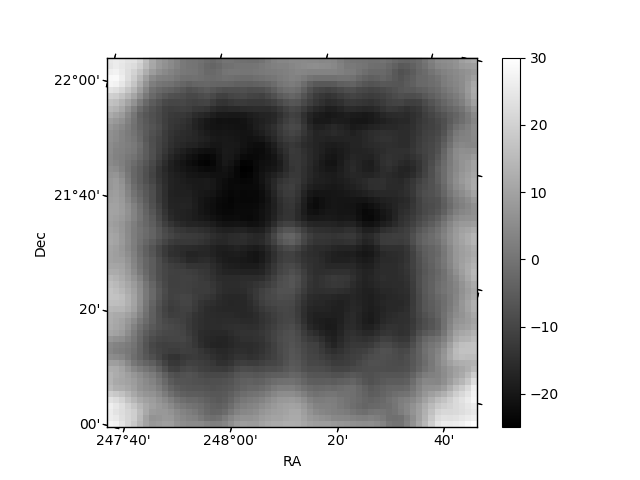
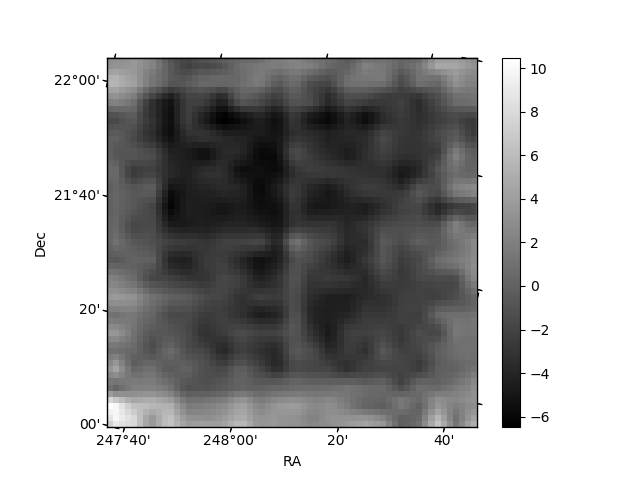
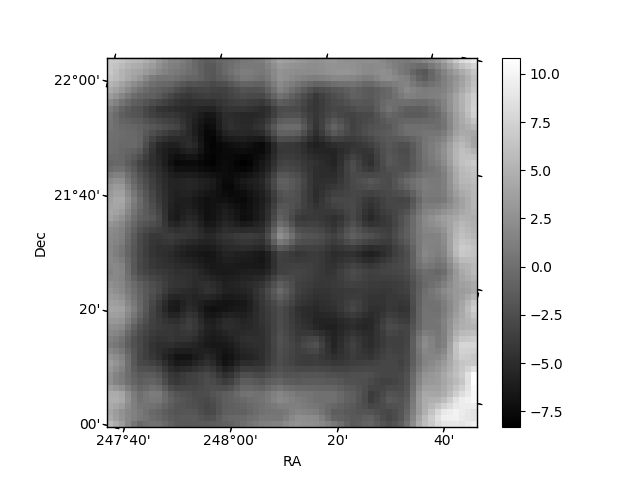
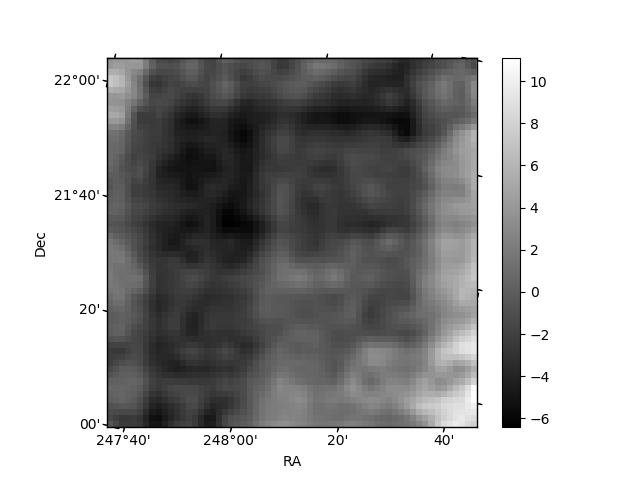
Histogram calculated using DETX and DETY for each event in the final _common_clean file
| Quadrant A | 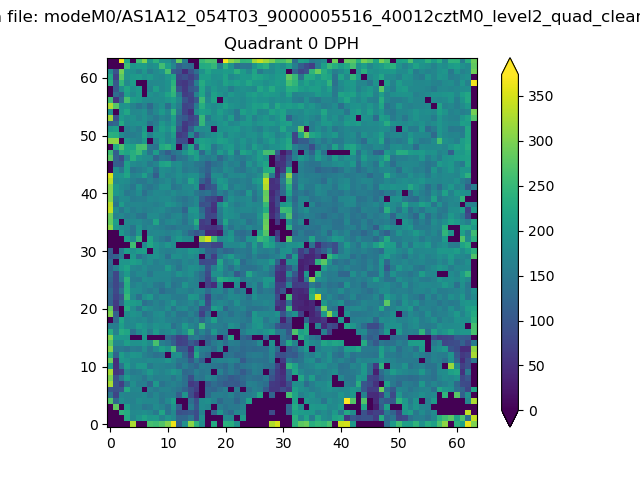 |
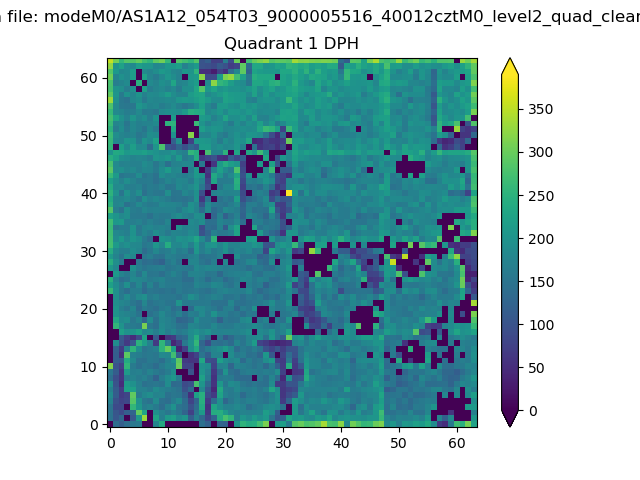 |
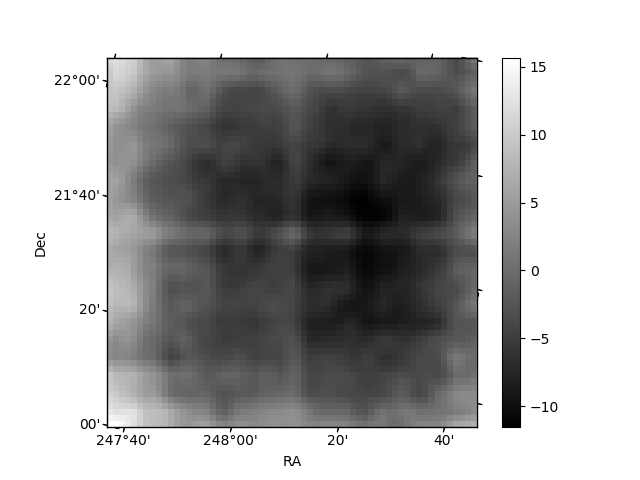
Quadrant B |
|---|---|---|---|
| Quadrant D | 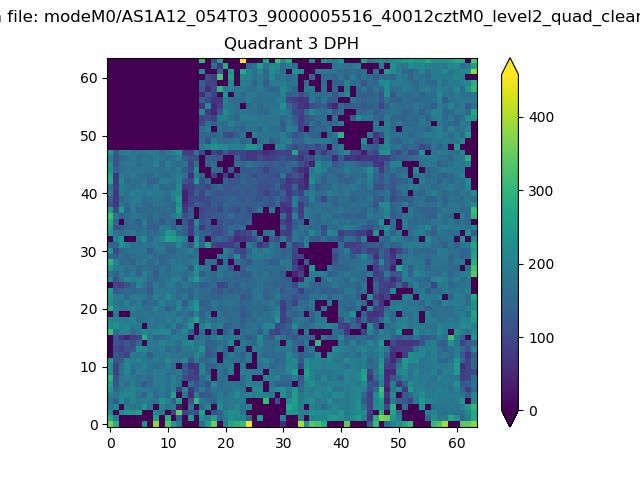 |
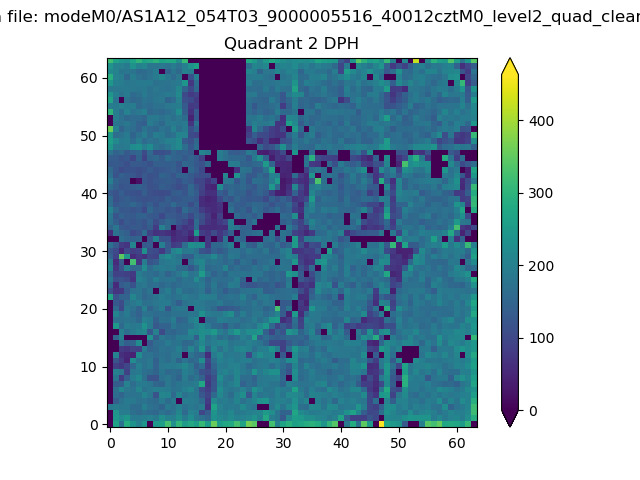 |
Quadrant C |
| Plot type | Count rate plots | Images |
|---|---|---|
| Comparison with Poisson distribution Blue bars denote a histogram of data divided into 1 sec bins. Red curve is a Poisson curve with rate = median count rate of data. |
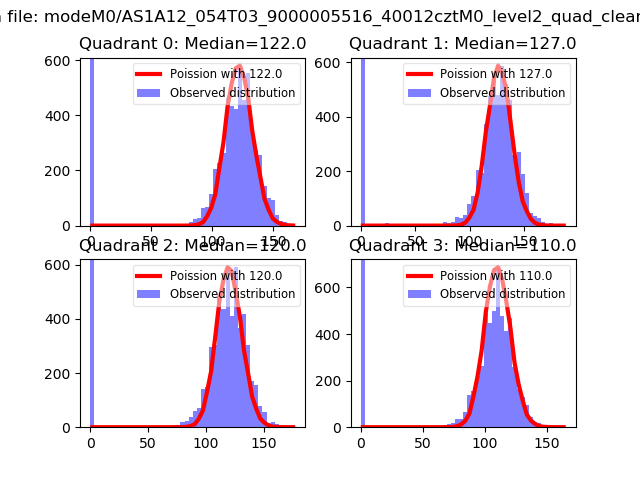 |
 |
| Quadrant-wise count rates Data is divided into 100 sec bins |
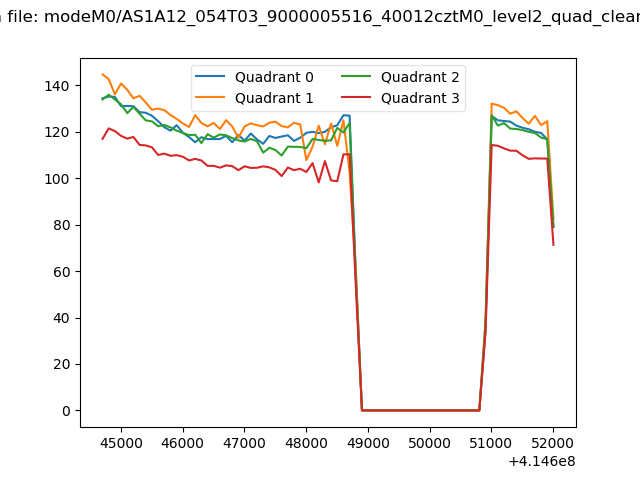 |
|
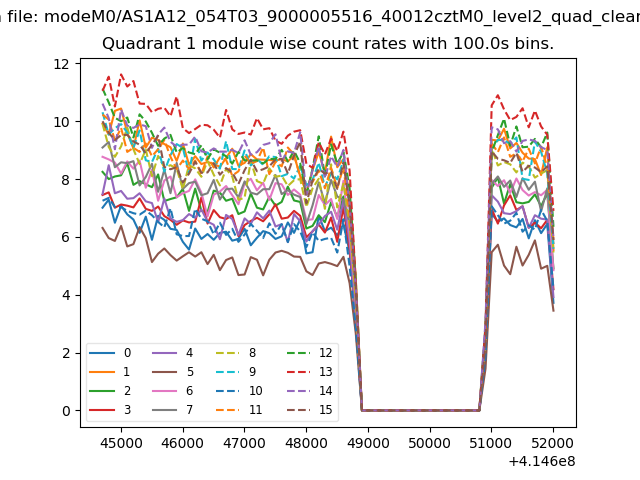
| Module-wise count rates for Quadrant A Data is divided into 100 sec bins |
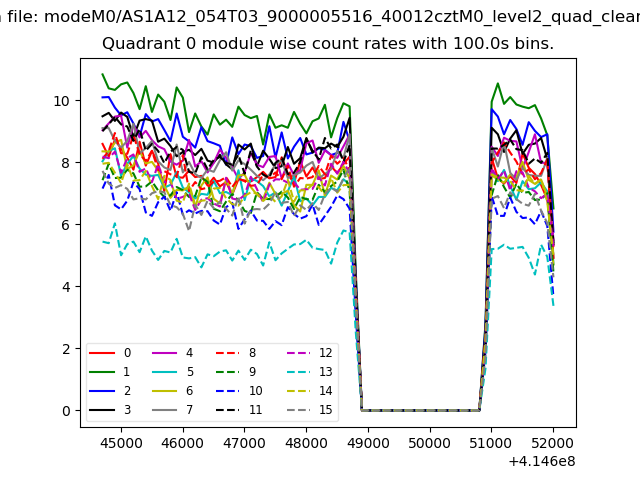 |
 |
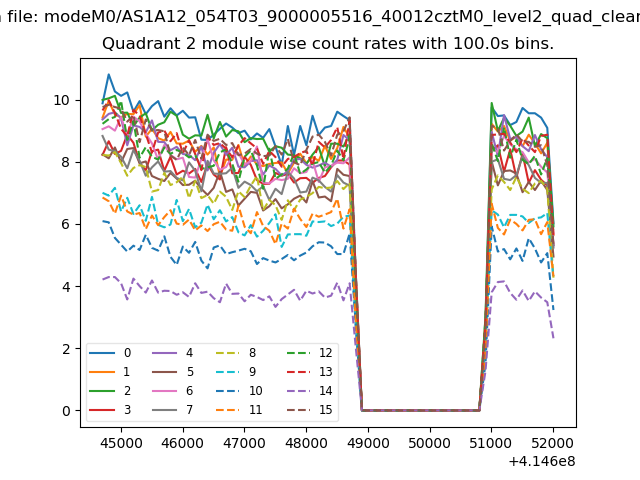
| Module-wise count rates for Quadrant B Data is divided into 100 sec bins |
 |
 |
| Module-wise count rates for Quadrant C Data is divided into 100 sec bins |
 |
 |
| Module-wise count rates for Quadrant D Data is divided into 100 sec bins |
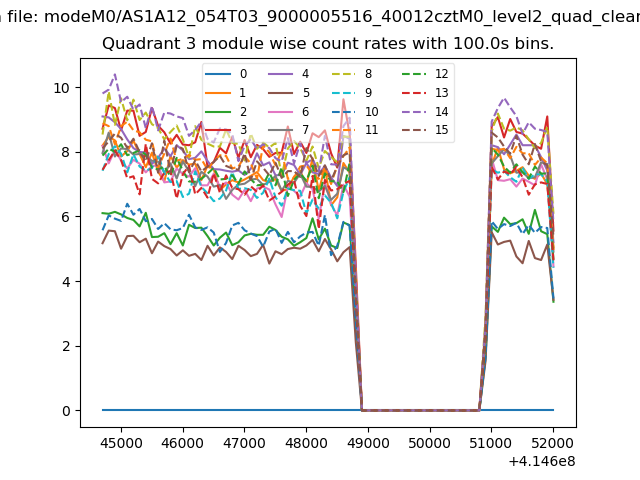 |
 |
| Parameter | Plot |
|---|---|
| CZT HV Monitor | 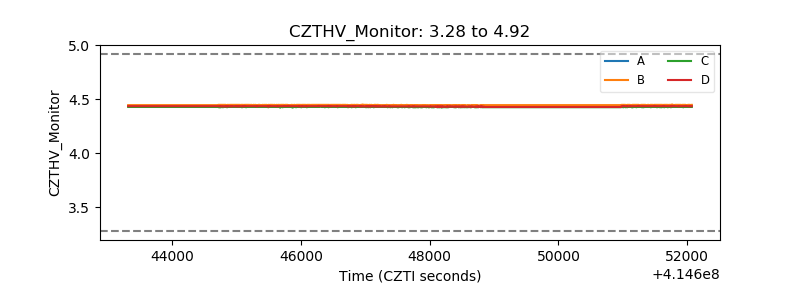 |
| D_VDD | 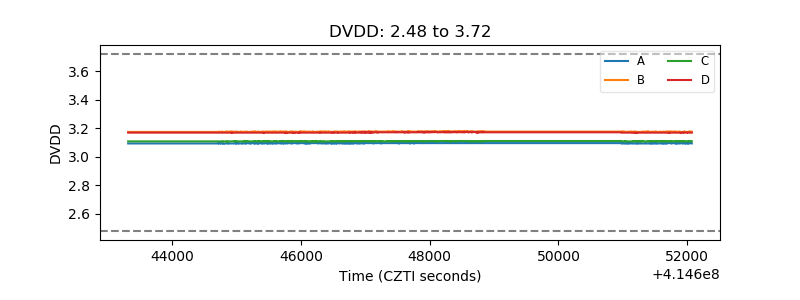 |
| Temperature 1 | 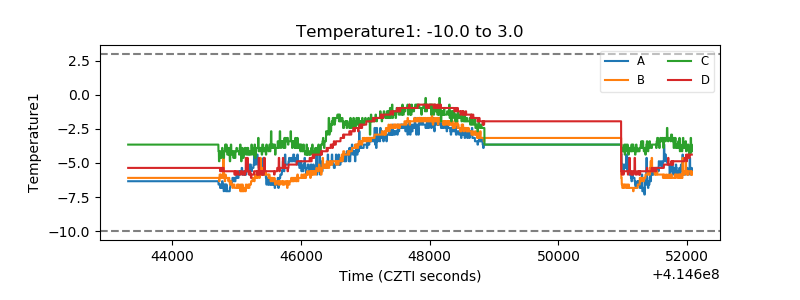 |
| Veto HV Monitor |  |
| Veto LLD | 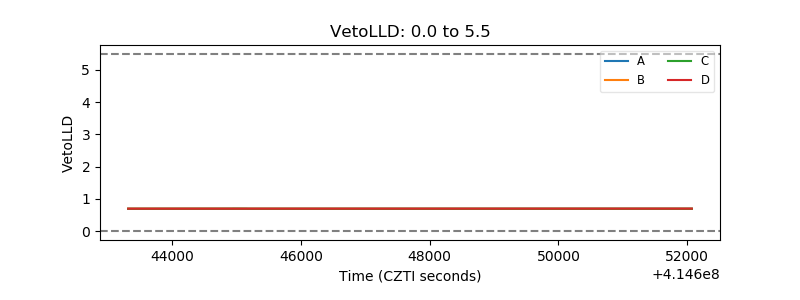 |
| Alpha Counter | 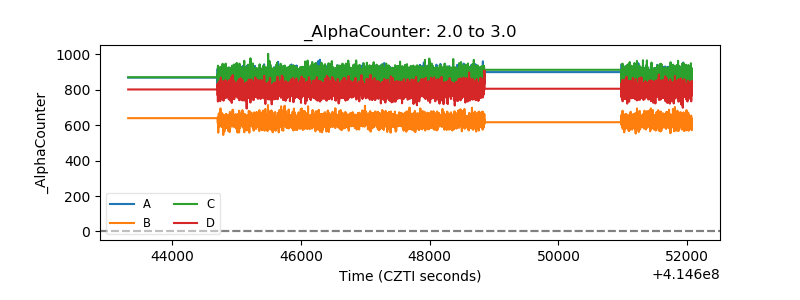 |
| _CPM_Rate | 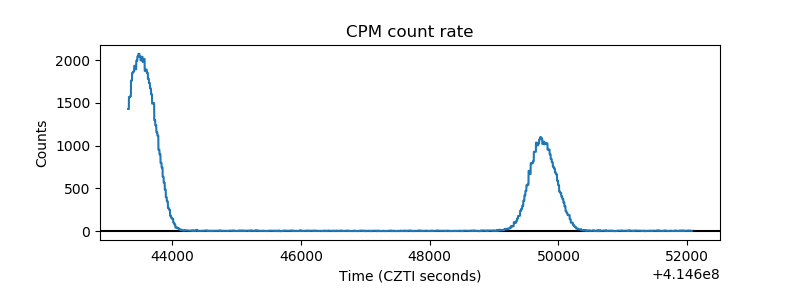 |
| CZT Counter | 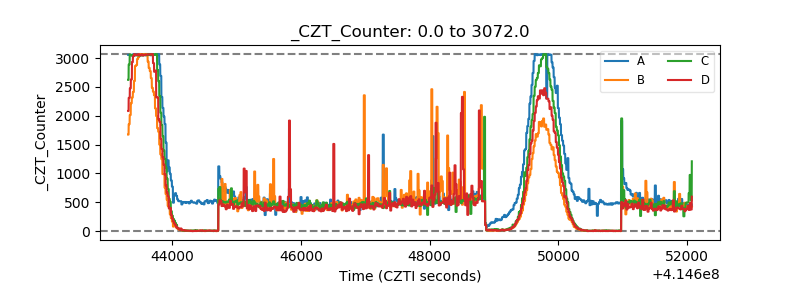 |
| +2.5 Volts monitor | 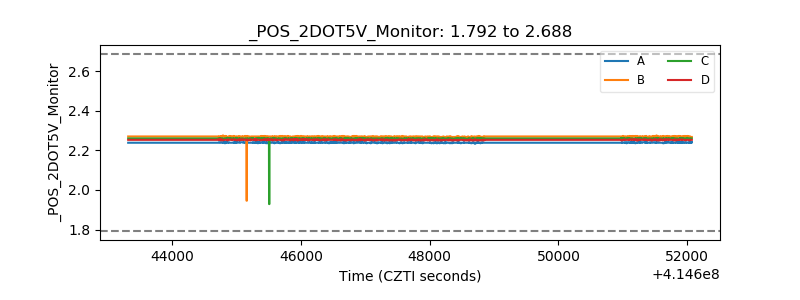 |
| +5 Volts monitor | 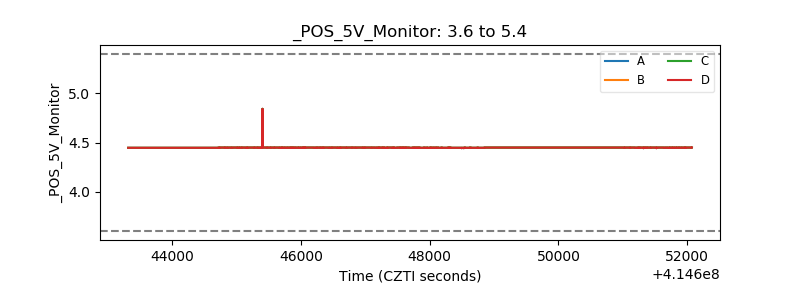 |
| _ROLL_ROT | 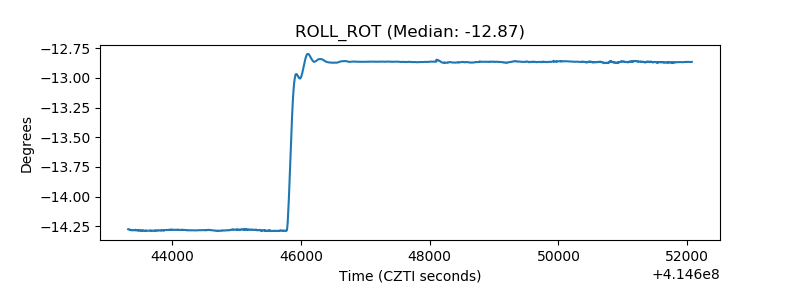 |
| _Roll_DEC | 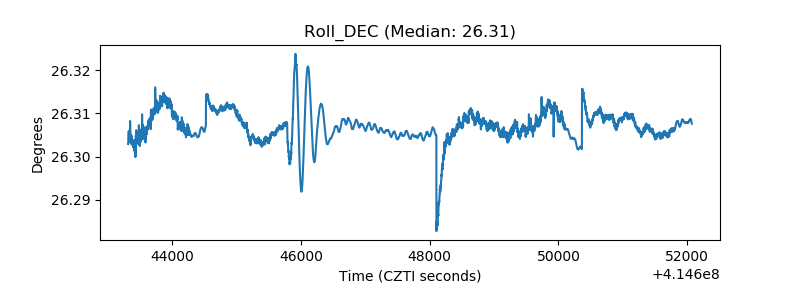 |
| _Roll_RA | 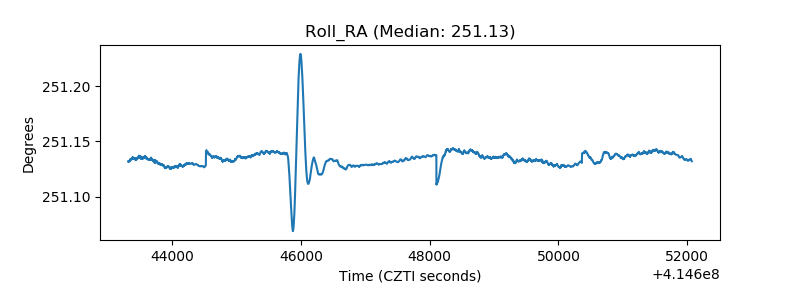 |
| Veto Counter | 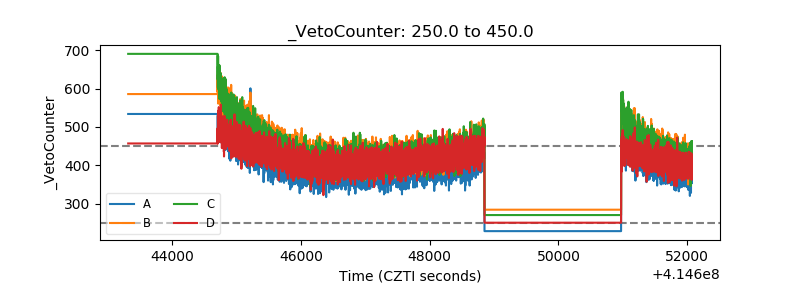 |