| Param | Original file | Final file |
|---|---|---|
| Filename | modeM0/AS1A12_054T03_9000005516_40013cztM0_level2.fits | modeM0/AS1A12_054T03_9000005516_40013cztM0_level2_quad_clean.evt |
| Size (bytes) | 549,423,360 | 163,065,600 |
| Size | 524.0 MB | 155.5 MB |
| Events in quadrant A | 4,971,095 | 1,100,531 |
| Events in quadrant B | 5,037,681 | 1,131,415 |
| Events in quadrant C | 4,730,416 | 1,079,649 |
| Events in quadrant D | 4,877,683 | 981,899 |
| Mode M9 | |||
|---|---|---|---|
| Quadrant | BADHDUFLAG | Total packets | Discarded packets |
| A | 0 | 42 | 0 |
| B | 0 | 42 | 0 |
| C | 0 | 42 | 0 |
| D | 0 | 42 | 0 |
| Mode SS | |||
|---|---|---|---|
| Quadrant | BADHDUFLAG | Total packets | Discarded packets |
| A | 0 | 192 | 0 |
| B | 0 | 192 | 0 |
| C | 0 | 192 | 0 |
| D | 0 | 192 | 0 |
| Mode M0 | |||
|---|---|---|---|
| Quadrant | BADHDUFLAG | Total packets | Discarded packets |
| A | 0 | 20291 | 3 |
| B | 0 | 21322 | 2 |
| C | 0 | 19763 | 2 |
| D | 0 | 21208 | 2 |
| Quadrant | Total seconds | Saturated seconds | Saturation percentage |
|---|---|---|---|
| A | 9284 | 22 | 0.236967% |
| B | 9284 | 173 | 1.863421% |
| C | 9284 | 34 | 0.366221% |
| D | 9284 | 98 | 1.055579% |
Noise dominated data is calculated using 1-second bins in cleaned event files. If a bin has >2000 counts, and if more than 50% of those come from <1% of pixels, then it is considered to be noise-dominated and hence unusable.
| Quadrant | # 1 sec bins | Bins with >0 counts | Bins with >2000 counts | High rate bins dominated by noise | Noise dominated (total time) | Noise dominated (detector-on time) | Marked lightcurve |
|---|---|---|---|---|---|---|---|
| A | 13530 | 9286 | 12 | 12 | 0.09% | 0.13% |  |
| B | 13530 | 9286 | 87 | 87 | 0.64% | 0.94% |  |
| C | 13530 | 9286 | 32 | 32 | 0.24% | 0.34% | 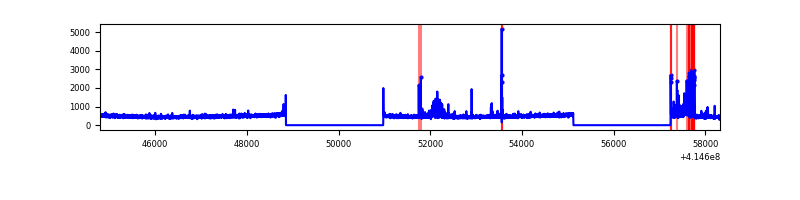 |
| D | 13530 | 9286 | 80 | 80 | 0.59% | 0.86% | 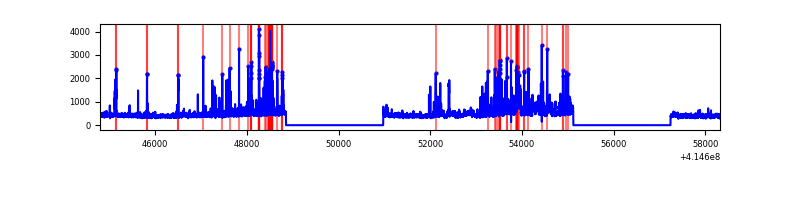 |
Top three noisy pixels from each quadrant. If the there are fewer than three noisy pixels in the level2.evt file, extra rows are filled as -1
| Pixel properties | Quadrant properties | ||||||
|---|---|---|---|---|---|---|---|
| Quadrant | DetID | PixID | Counts | Sigma | Mean | Median | Sigma |
| A | 10 | 83 | 723675 | 3417.16 | 1048 | 1031 | 211.5 |
| A | 2 | 79 | 74619 | 347.97 | 1048 | 1031 | 211.5 |
| A | 7 | 3 | 41698 | 192.3 | 1048 | 1031 | 211.5 |
| B | 4 | 171 | 828554 | 4171.66 | 1039 | 1014 | 198.4 |
| B | 4 | 81 | 59667 | 295.67 | 1039 | 1014 | 198.4 |
| B | 0 | 230 | 36576 | 179.27 | 1039 | 1014 | 198.4 |
| C | 15 | 214 | 385846 | 1637.09 | 1020 | 1027 | 235.1 |
| C | 14 | 254 | 333206 | 1413.15 | 1020 | 1027 | 235.1 |
| C | 0 | 10 | 15103 | 59.88 | 1020 | 1027 | 235.1 |
| D | 12 | 227 | 505219 | 2076.99 | 1011 | 987 | 242.8 |
| D | 13 | 249 | 164001 | 671.48 | 1011 | 987 | 242.8 |
| D | 2 | 250 | 129127 | 527.82 | 1011 | 987 | 242.8 |
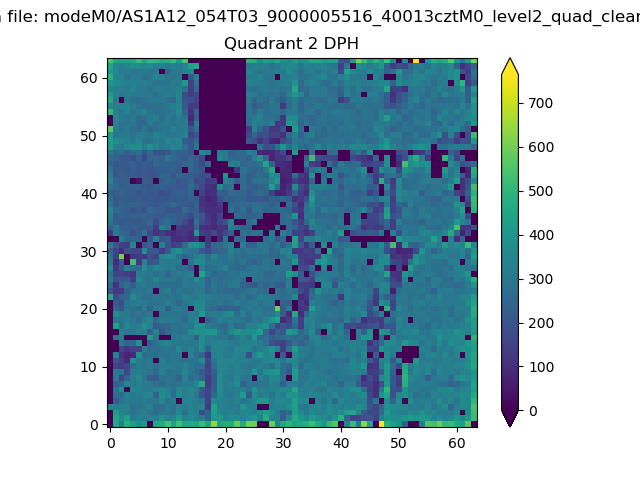
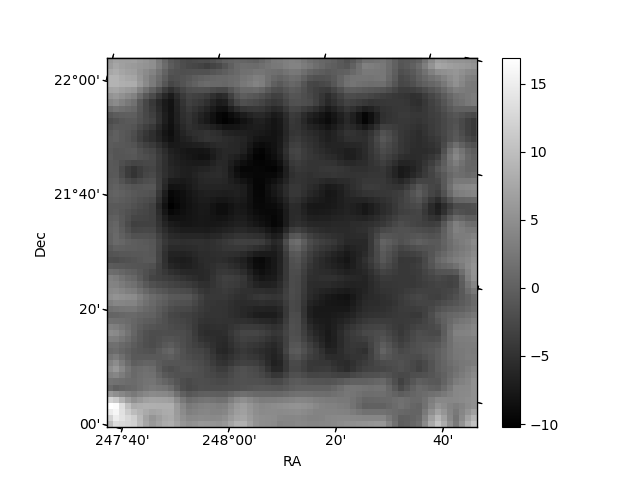
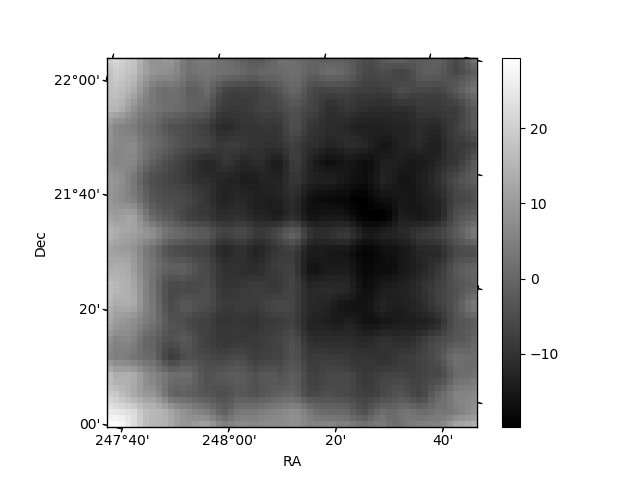
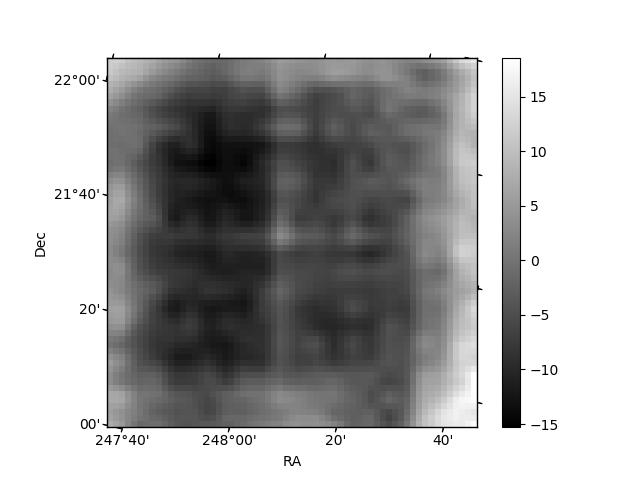
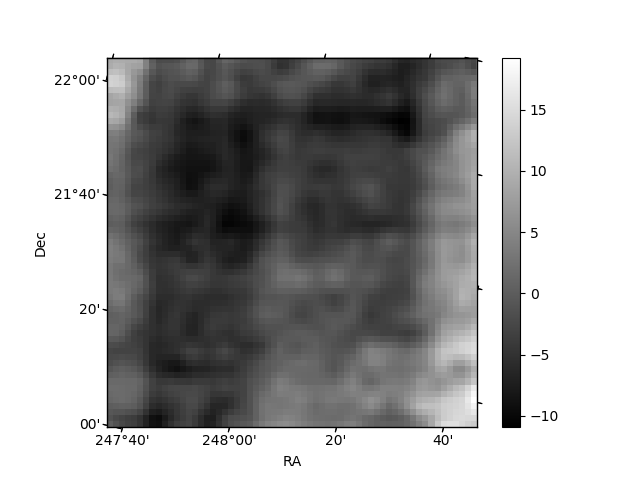
Histogram calculated using DETX and DETY for each event in the final _common_clean file
| Quadrant A | 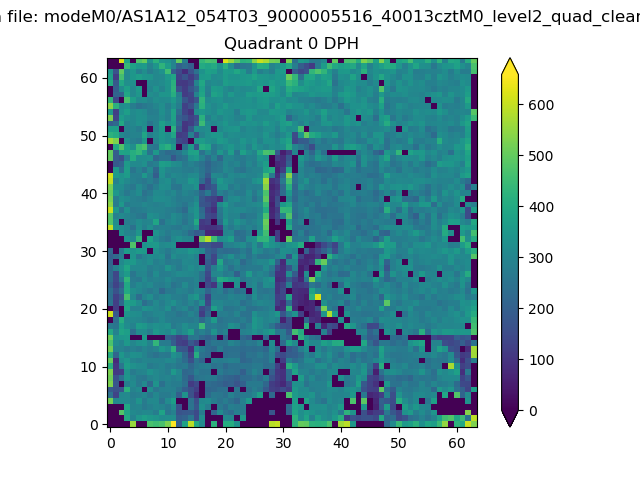 |
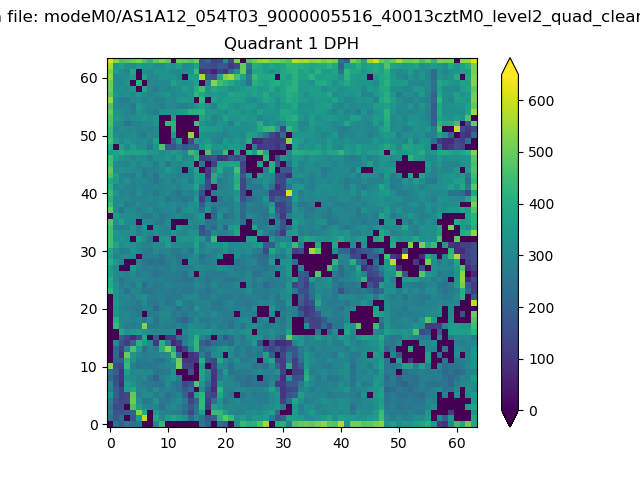 |
Quadrant B |
|---|---|---|---|
| Quadrant D | 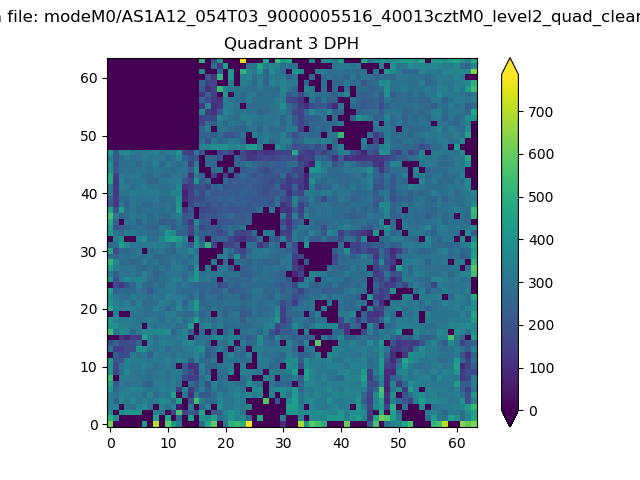 |
 |
Quadrant C |
| Plot type | Count rate plots | Images |
|---|---|---|
| Comparison with Poisson distribution Blue bars denote a histogram of data divided into 1 sec bins. Red curve is a Poisson curve with rate = median count rate of data. |
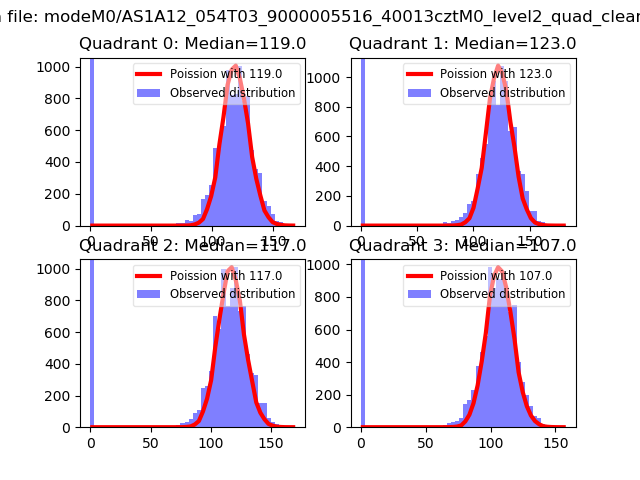 |
 |
| Quadrant-wise count rates Data is divided into 100 sec bins |
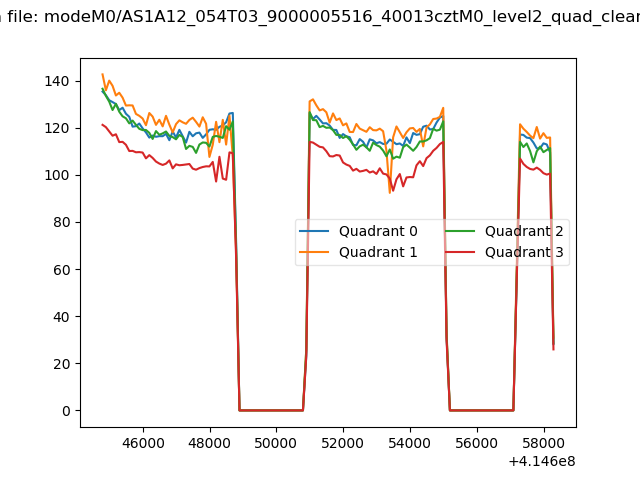 |
|
| Module-wise count rates for Quadrant A Data is divided into 100 sec bins |
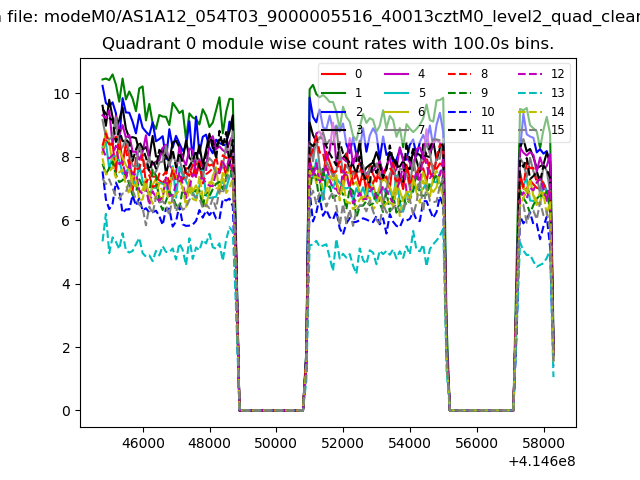 |
 |
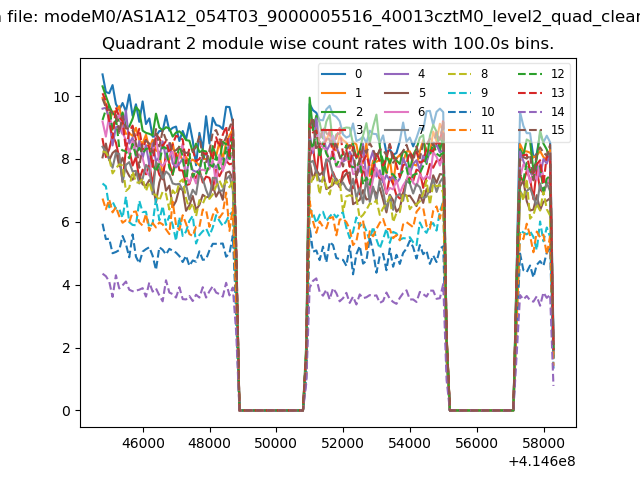
| Module-wise count rates for Quadrant B Data is divided into 100 sec bins |
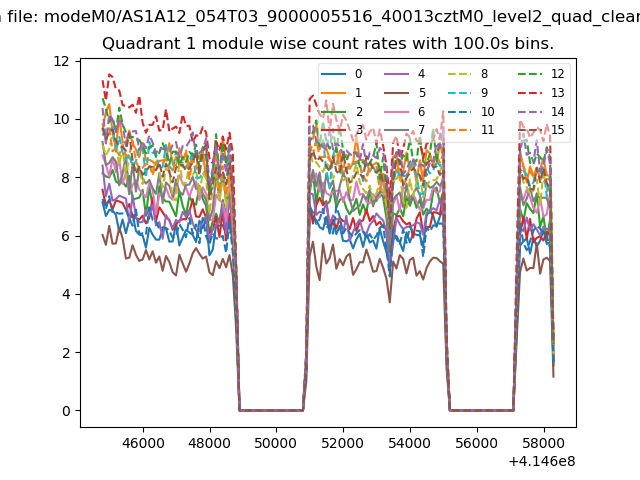 |
 |
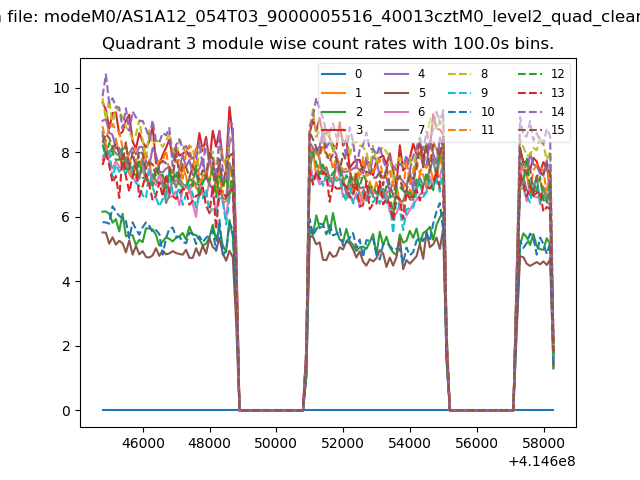
| Module-wise count rates for Quadrant C Data is divided into 100 sec bins |
 |
 |
| Module-wise count rates for Quadrant D Data is divided into 100 sec bins |
 |
 |
| Parameter | Plot |
|---|---|
| CZT HV Monitor |  |
| D_VDD | 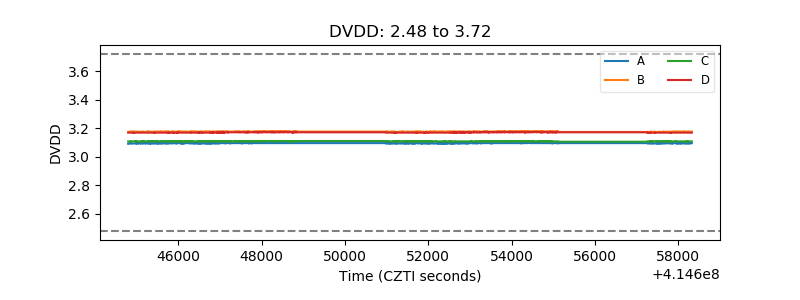 |
| Temperature 1 | 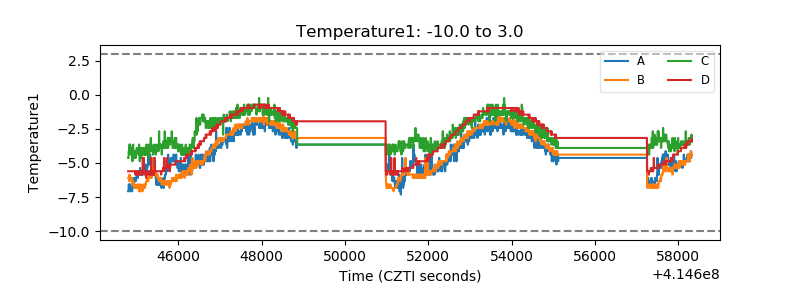 |
| Veto HV Monitor | 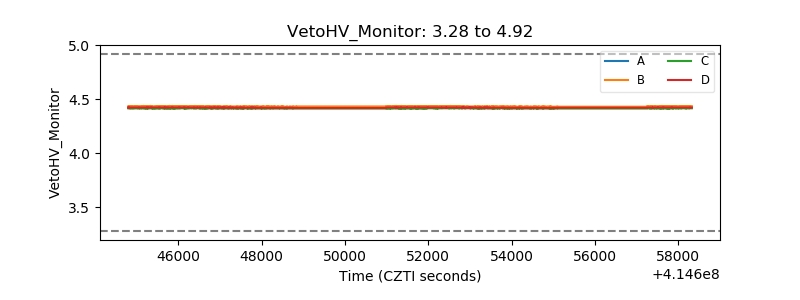 |
| Veto LLD | 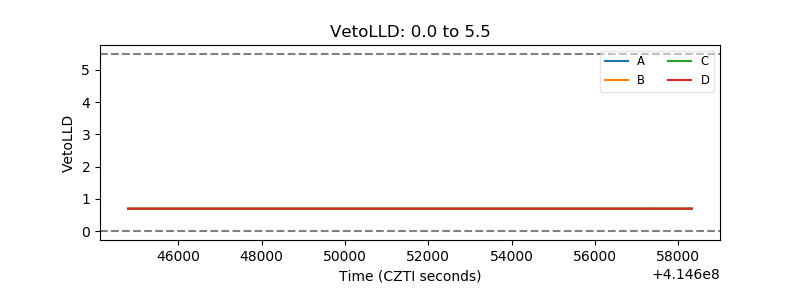 |
| Alpha Counter | 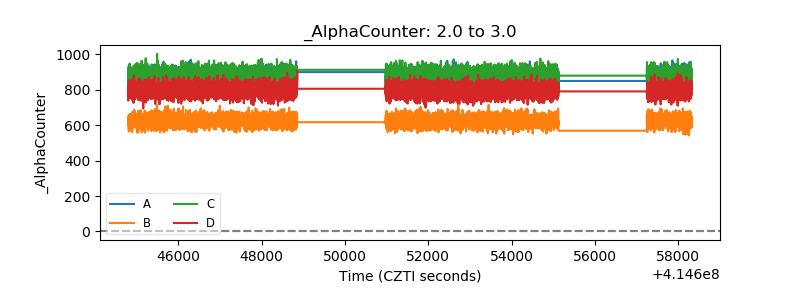 |
| _CPM_Rate | 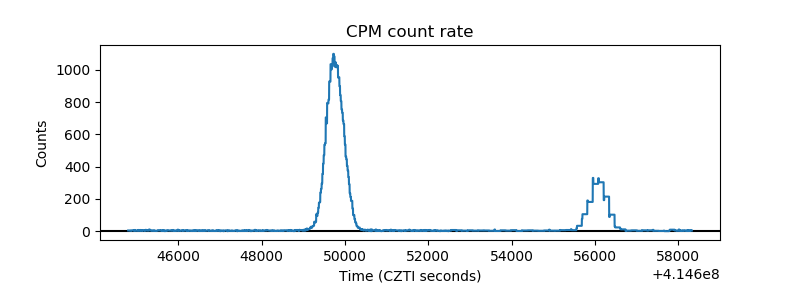 |
| CZT Counter | 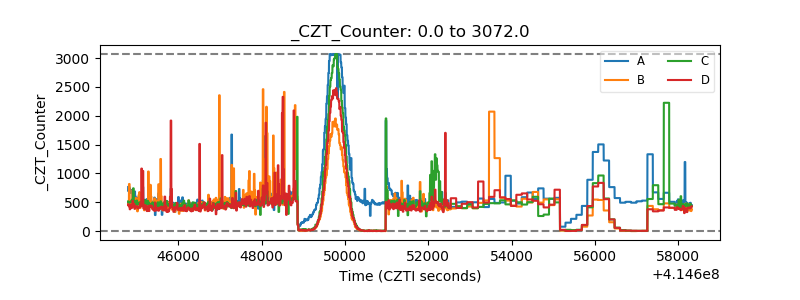 |
| +2.5 Volts monitor | 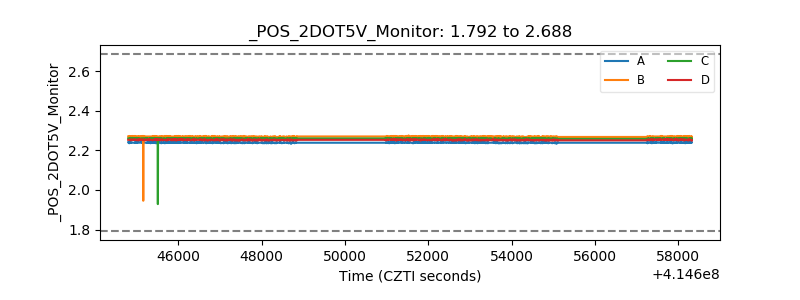 |
| +5 Volts monitor | 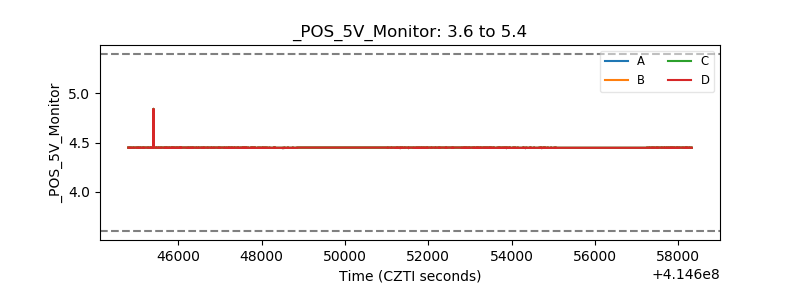 |
| _ROLL_ROT | 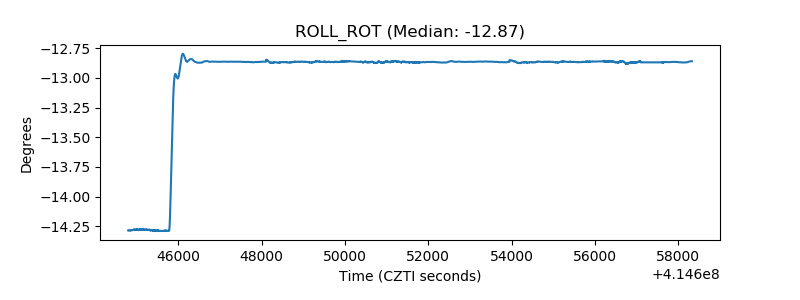 |
| _Roll_DEC | 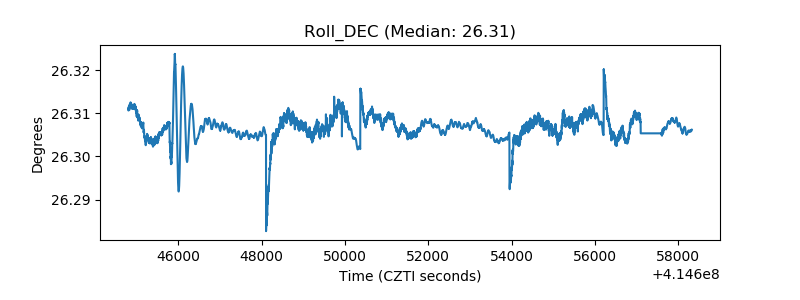 |
| _Roll_RA | 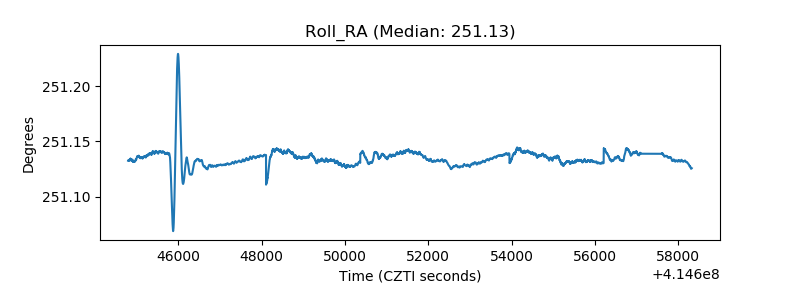 |
| Veto Counter | 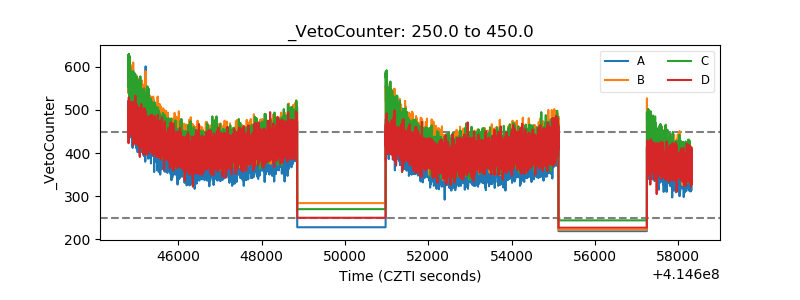 |