| Param | Original file | Final file |
|---|---|---|
| Filename | modeM0/AS1A12_054T03_9000005516_40014cztM0_level2.fits | modeM0/AS1A12_054T03_9000005516_40014cztM0_level2_quad_clean.evt |
| Size (bytes) | 330,166,080 | 84,147,840 |
| Size | 314.9 MB | 80.2 MB |
| Events in quadrant A | 2,862,972 | 565,485 |
| Events in quadrant B | 2,525,801 | 587,989 |
| Events in quadrant C | 3,033,805 | 553,590 |
| Events in quadrant D | 3,402,128 | 484,221 |
| Mode M9 | |||
|---|---|---|---|
| Quadrant | BADHDUFLAG | Total packets | Discarded packets |
| A | 0 | 20 | 0 |
| B | 0 | 20 | 0 |
| C | 0 | 20 | 0 |
| D | 0 | 20 | 0 |
| Mode SS | |||
|---|---|---|---|
| Quadrant | BADHDUFLAG | Total packets | Discarded packets |
| A | 0 | 102 | 0 |
| B | 0 | 102 | 0 |
| C | 0 | 102 | 0 |
| D | 0 | 102 | 0 |
| Mode M0 | |||
|---|---|---|---|
| Quadrant | BADHDUFLAG | Total packets | Discarded packets |
| A | 0 | 11495 | 1 |
| B | 0 | 11099 | 0 |
| C | 0 | 12441 | 0 |
| D | 0 | 13815 | 0 |
| Quadrant | Total seconds | Saturated seconds | Saturation percentage |
|---|---|---|---|
| A | 5094 | 64 | 1.256380% |
| B | 5094 | 36 | 0.706714% |
| C | 5094 | 110 | 2.159403% |
| D | 5094 | 341 | 6.694150% |
Noise dominated data is calculated using 1-second bins in cleaned event files. If a bin has >2000 counts, and if more than 50% of those come from <1% of pixels, then it is considered to be noise-dominated and hence unusable.
| Quadrant | # 1 sec bins | Bins with >0 counts | Bins with >2000 counts | High rate bins dominated by noise | Noise dominated (total time) | Noise dominated (detector-on time) | Marked lightcurve |
|---|---|---|---|---|---|---|---|
| A | 7067 | 5095 | 46 | 46 | 0.65% | 0.90% |  |
| B | 7067 | 5095 | 21 | 21 | 0.30% | 0.41% | 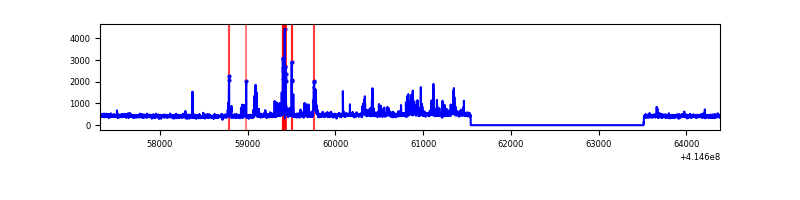 |
| C | 7067 | 5095 | 64 | 64 | 0.91% | 1.26% | 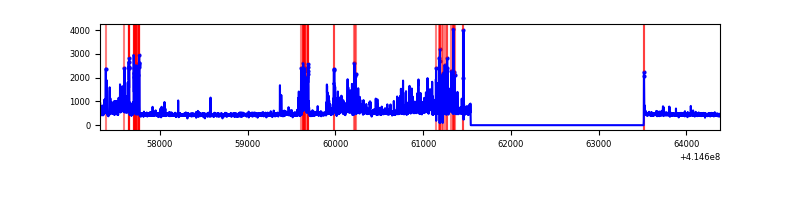 |
| D | 7067 | 5095 | 297 | 297 | 4.20% | 5.83% | 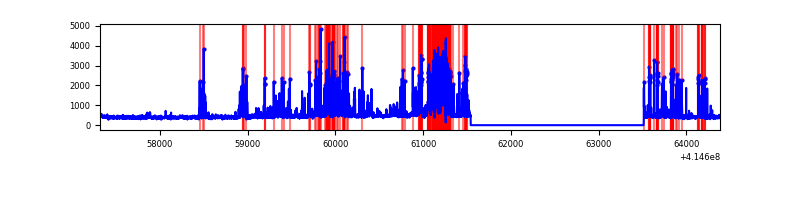 |
Top three noisy pixels from each quadrant. If the there are fewer than three noisy pixels in the level2.evt file, extra rows are filled as -1
| Pixel properties | Quadrant properties | ||||||
|---|---|---|---|---|---|---|---|
| Quadrant | DetID | PixID | Counts | Sigma | Mean | Median | Sigma |
| A | 10 | 83 | 425755 | 3710.33 | 560 | 549 | 114.6 |
| A | 13 | 248 | 218756 | 1904.06 | 560 | 549 | 114.6 |
| A | 9 | 143 | 20242 | 171.84 | 560 | 549 | 114.6 |
| B | 4 | 171 | 303873 | 2785.87 | 557 | 543 | 108.9 |
| B | 12 | 111 | 13081 | 115.15 | 557 | 543 | 108.9 |
| B | 11 | 111 | 12253 | 107.55 | 557 | 543 | 108.9 |
| C | 14 | 254 | 689213 | 5413.7 | 542 | 545 | 127.2 |
| C | 15 | 214 | 211939 | 1661.79 | 542 | 545 | 127.2 |
| C | 0 | 10 | 9692 | 71.91 | 542 | 545 | 127.2 |
| D | 12 | 227 | 688549 | 5267.68 | 531 | 518 | 130.6 |
| D | 2 | 250 | 356390 | 2724.62 | 531 | 518 | 130.6 |
| D | 5 | 32 | 99038 | 754.29 | 531 | 518 | 130.6 |
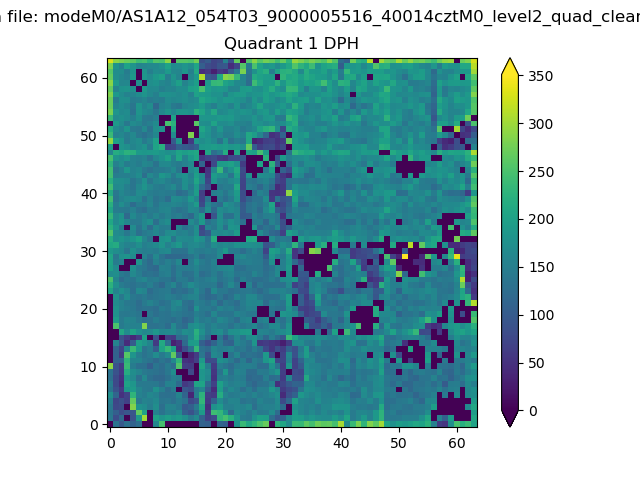
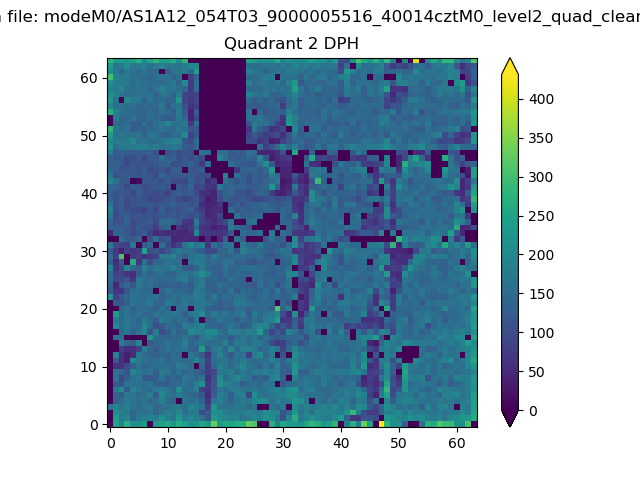
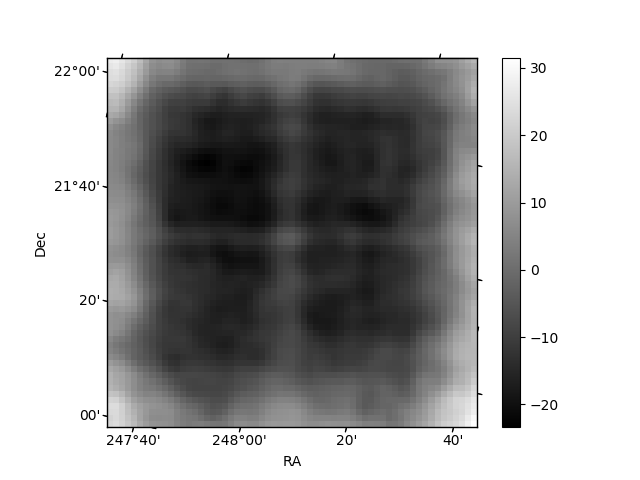
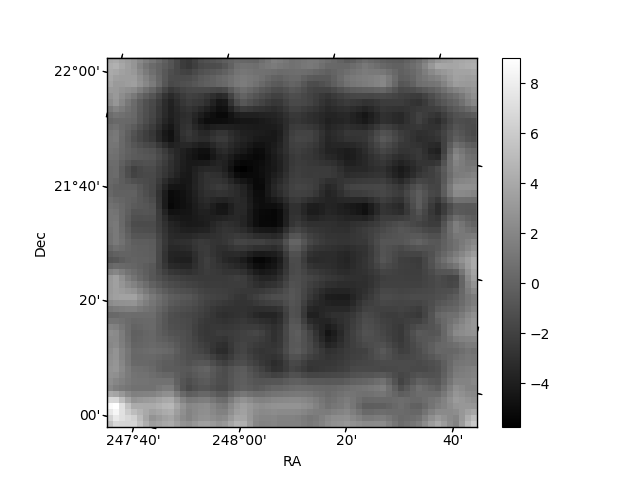
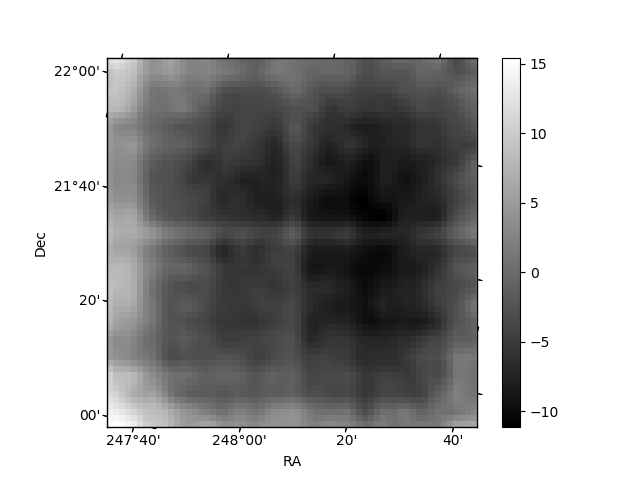
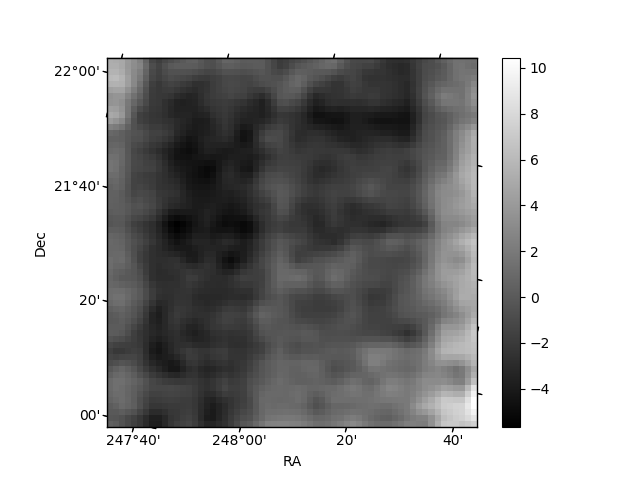
Histogram calculated using DETX and DETY for each event in the final _common_clean file
| Quadrant A | 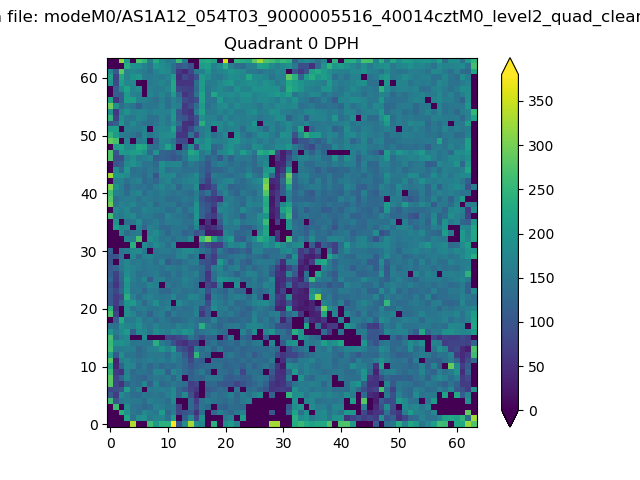 |
 |
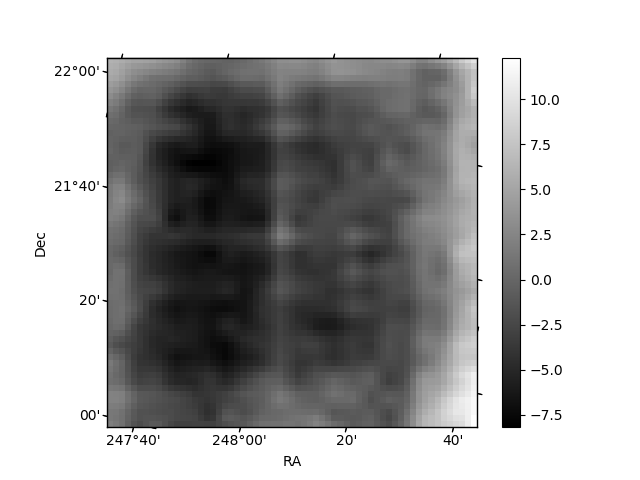
Quadrant B |
|---|---|---|---|
| Quadrant D | 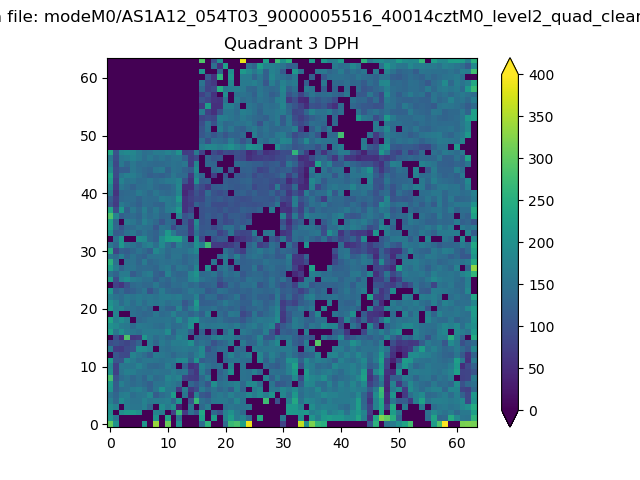 |
 |
Quadrant C |
| Plot type | Count rate plots | Images |
|---|---|---|
| Comparison with Poisson distribution Blue bars denote a histogram of data divided into 1 sec bins. Red curve is a Poisson curve with rate = median count rate of data. |
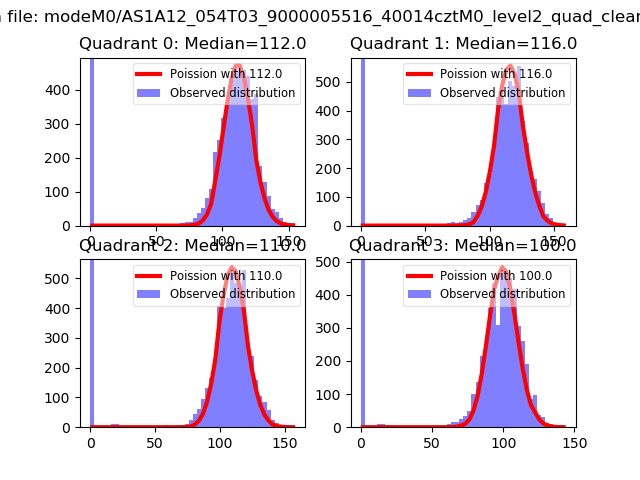 |
 |
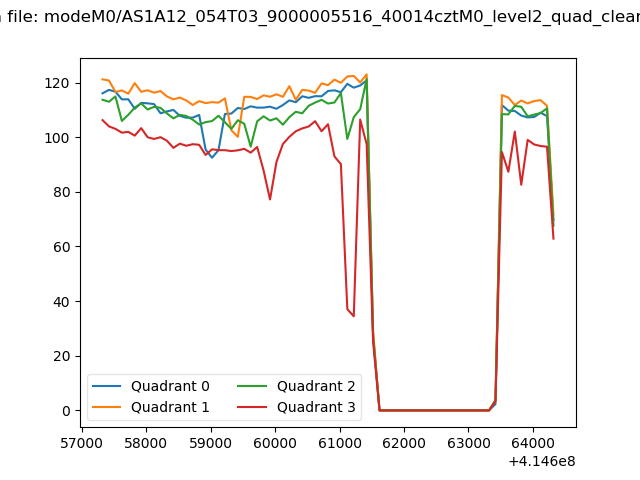
| Quadrant-wise count rates Data is divided into 100 sec bins |
 |
|
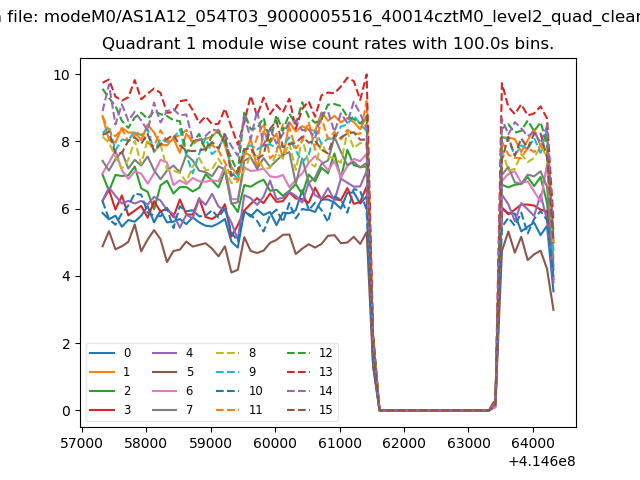
| Module-wise count rates for Quadrant A Data is divided into 100 sec bins |
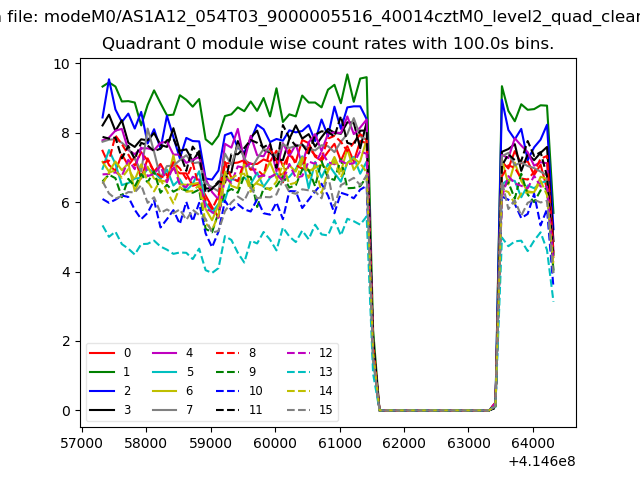 |
 |
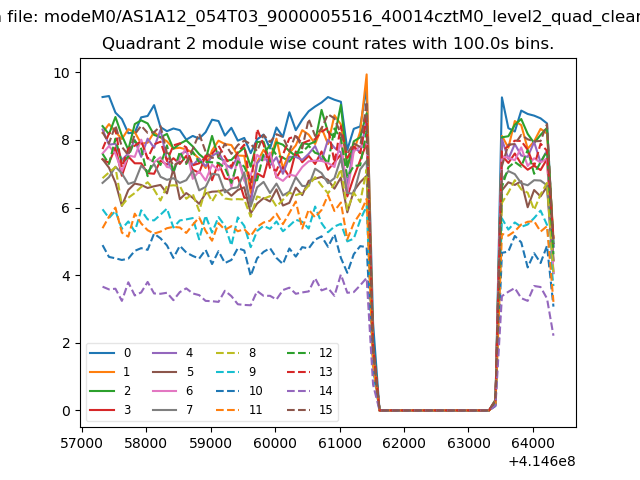
| Module-wise count rates for Quadrant B Data is divided into 100 sec bins |
 |
 |
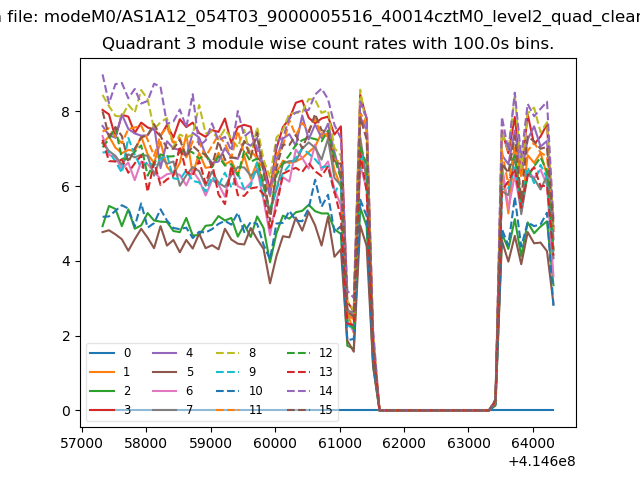
| Module-wise count rates for Quadrant C Data is divided into 100 sec bins |
 |
 |
| Module-wise count rates for Quadrant D Data is divided into 100 sec bins |
 |
 |
| Parameter | Plot |
|---|---|
| CZT HV Monitor | 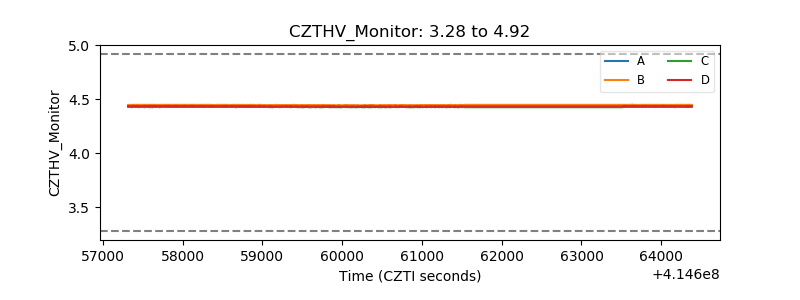 |
| D_VDD | 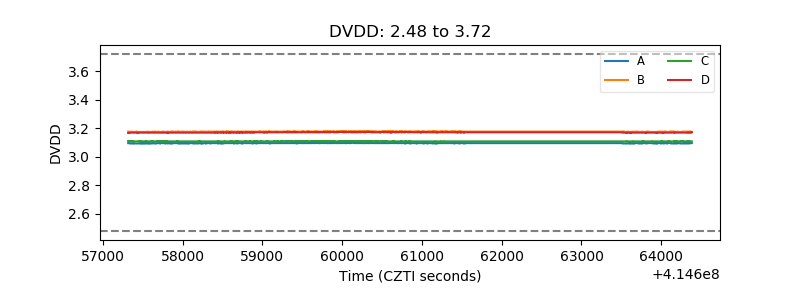 |
| Temperature 1 | 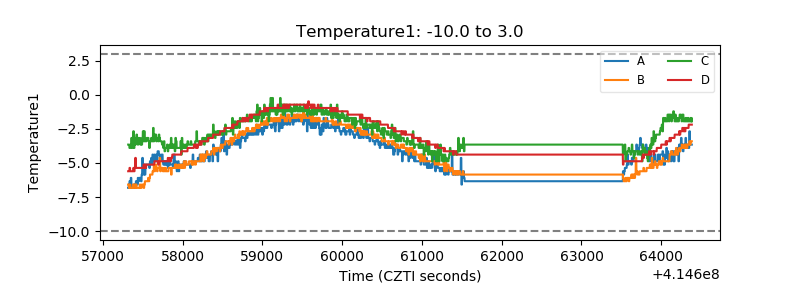 |
| Veto HV Monitor | 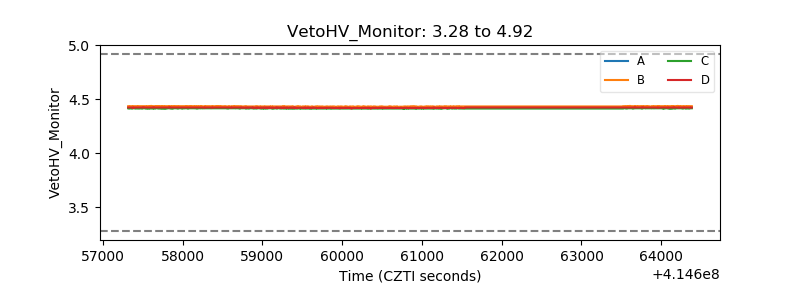 |
| Veto LLD | 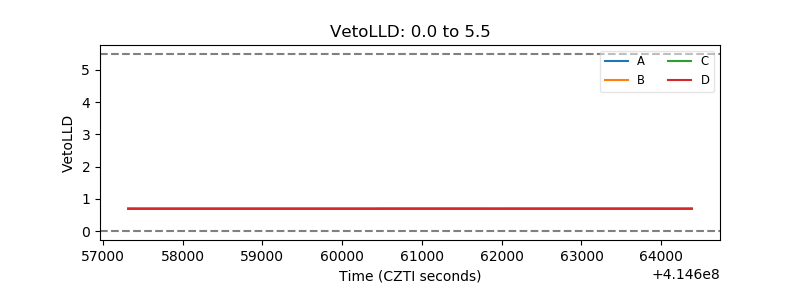 |
| Alpha Counter | 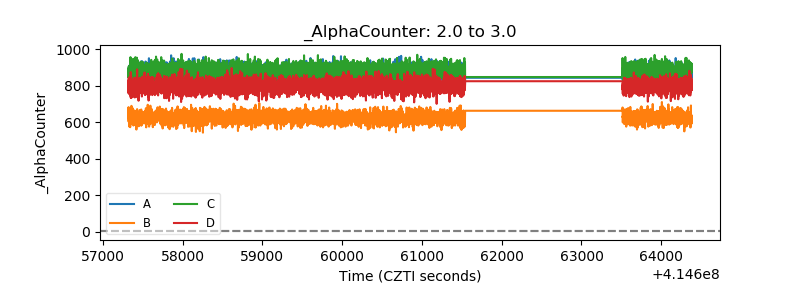 |
| _CPM_Rate | 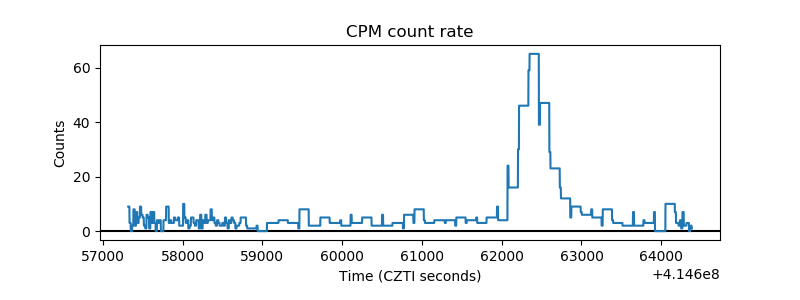 |
| CZT Counter | 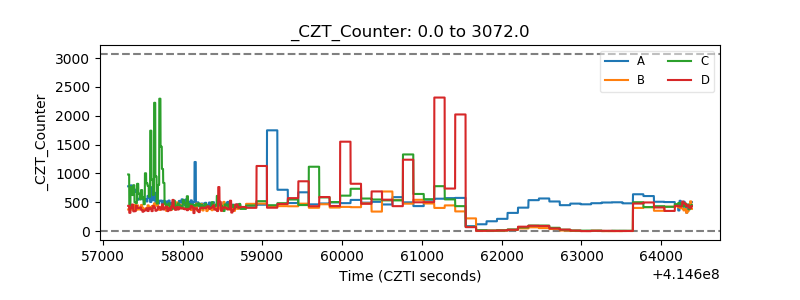 |
| +2.5 Volts monitor | 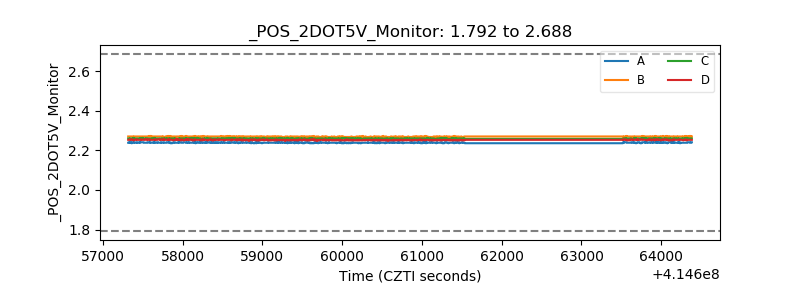 |
| +5 Volts monitor | 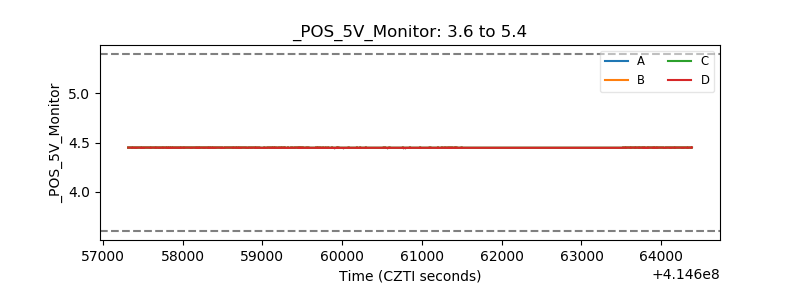 |
| _ROLL_ROT | 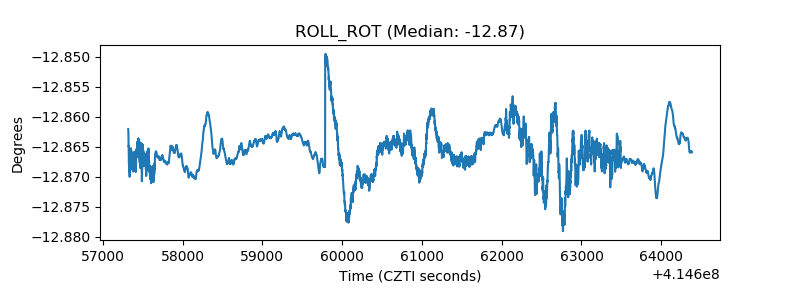 |
| _Roll_DEC | 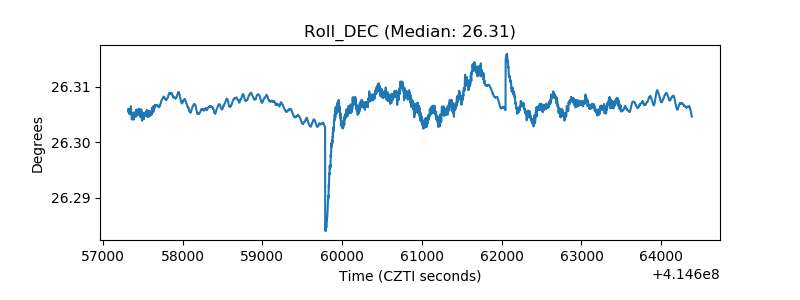 |
| _Roll_RA | 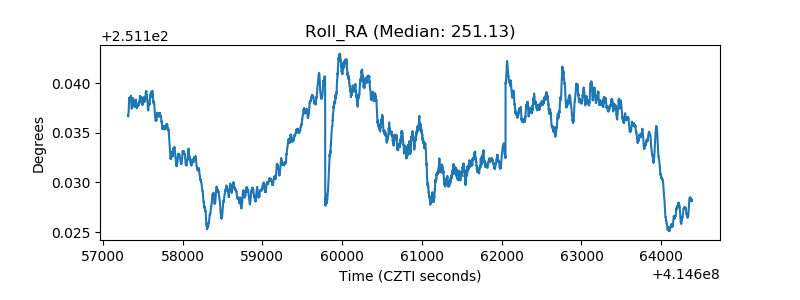 |
| Veto Counter | 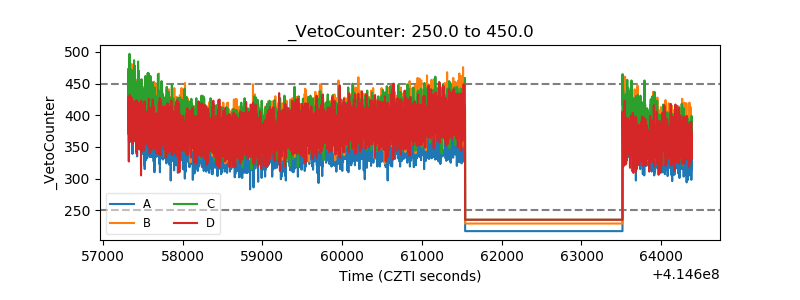 |