| Param | Original file | Final file |
|---|---|---|
| Filename | modeM0/AS1A12_054T03_9000005516_40017cztM0_level2.fits | modeM0/AS1A12_054T03_9000005516_40017cztM0_level2_quad_clean.evt |
| Size (bytes) | 360,449,280 | 96,033,600 |
| Size | 343.8 MB | 91.6 MB |
| Events in quadrant A | 3,252,609 | 641,081 |
| Events in quadrant B | 3,413,321 | 654,785 |
| Events in quadrant C | 2,890,148 | 625,049 |
| Events in quadrant D | 3,323,233 | 571,279 |
| Mode M9 | |||
|---|---|---|---|
| Quadrant | BADHDUFLAG | Total packets | Discarded packets |
| A | 0 | 18 | 0 |
| B | 0 | 18 | 0 |
| C | 0 | 18 | 0 |
| D | 0 | 19 | 0 |
| Mode SS | |||
|---|---|---|---|
| Quadrant | BADHDUFLAG | Total packets | Discarded packets |
| A | 0 | 120 | 0 |
| B | 0 | 120 | 0 |
| C | 0 | 120 | 0 |
| D | 0 | 120 | 0 |
| Mode M0 | |||
|---|---|---|---|
| Quadrant | BADHDUFLAG | Total packets | Discarded packets |
| A | 0 | 13230 | 3 |
| B | 0 | 14090 | 2 |
| C | 0 | 12357 | 2 |
| D | 0 | 13858 | 2 |
| Quadrant | Total seconds | Saturated seconds | Saturation percentage |
|---|---|---|---|
| A | 5951 | 35 | 0.588136% |
| B | 5951 | 102 | 1.713998% |
| C | 5951 | 30 | 0.504117% |
| D | 5951 | 127 | 2.134095% |
Noise dominated data is calculated using 1-second bins in cleaned event files. If a bin has >2000 counts, and if more than 50% of those come from <1% of pixels, then it is considered to be noise-dominated and hence unusable.
| Quadrant | # 1 sec bins | Bins with >0 counts | Bins with >2000 counts | High rate bins dominated by noise | Noise dominated (total time) | Noise dominated (detector-on time) | Marked lightcurve |
|---|---|---|---|---|---|---|---|
| A | 7234 | 5952 | 27 | 27 | 0.37% | 0.45% | 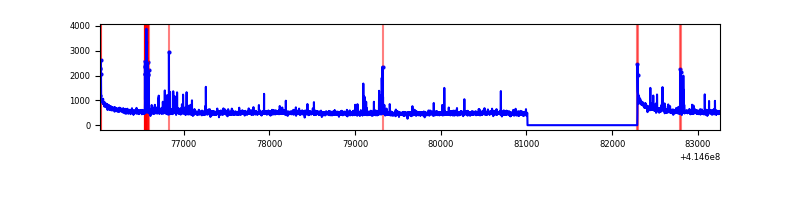 |
| B | 7234 | 5952 | 50 | 50 | 0.69% | 0.84% | 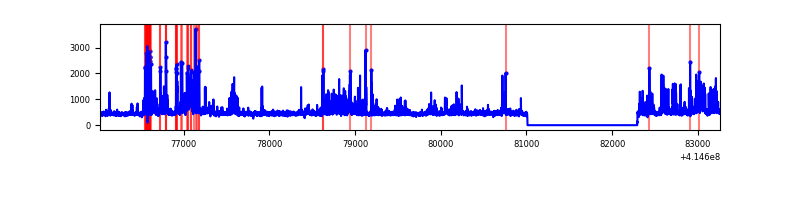 |
| C | 7234 | 5952 | 20 | 20 | 0.28% | 0.34% | 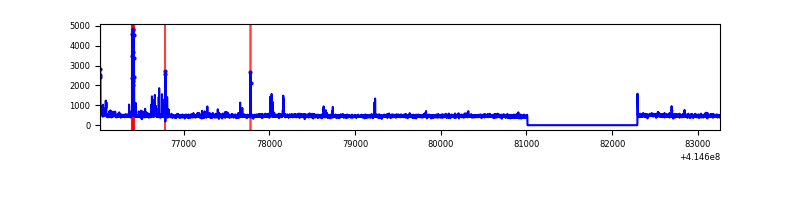 |
| D | 7234 | 5952 | 98 | 98 | 1.35% | 1.65% | 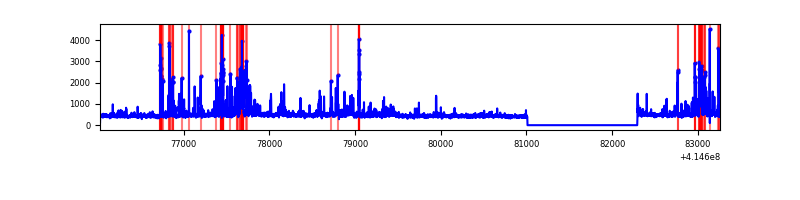 |
Top three noisy pixels from each quadrant. If the there are fewer than three noisy pixels in the level2.evt file, extra rows are filled as -1
| Pixel properties | Quadrant properties | ||||||
|---|---|---|---|---|---|---|---|
| Quadrant | DetID | PixID | Counts | Sigma | Mean | Median | Sigma |
| A | 10 | 83 | 521505 | 3898.58 | 650 | 636 | 133.6 |
| A | 13 | 248 | 150999 | 1125.43 | 650 | 636 | 133.6 |
| A | 2 | 79 | 30581 | 224.13 | 650 | 636 | 133.6 |
| B | 4 | 171 | 724986 | 5759.52 | 645 | 627 | 125.8 |
| B | 0 | 230 | 65403 | 515.05 | 645 | 627 | 125.8 |
| B | 0 | 218 | 23983 | 185.71 | 645 | 627 | 125.8 |
| C | 15 | 214 | 245649 | 1644.29 | 634 | 639 | 149.0 |
| C | 14 | 254 | 119102 | 795.02 | 634 | 639 | 149.0 |
| C | 15 | 208 | 20694 | 134.59 | 634 | 639 | 149.0 |
| D | 2 | 250 | 410544 | 2640.05 | 630 | 612 | 155.3 |
| D | 2 | 31 | 167544 | 1075.08 | 630 | 612 | 155.3 |
| D | 13 | 249 | 131490 | 842.88 | 630 | 612 | 155.3 |
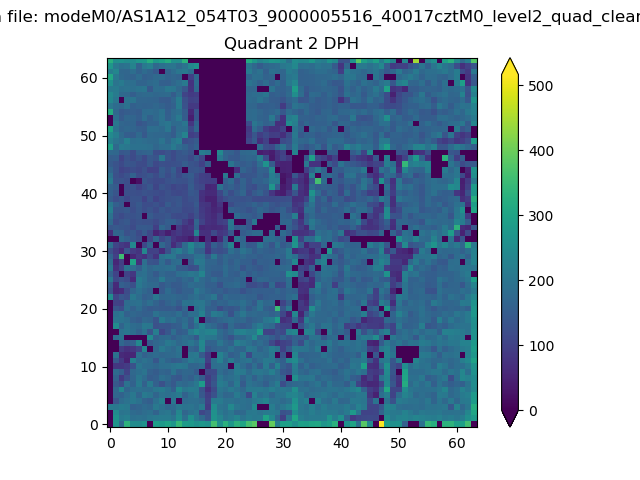
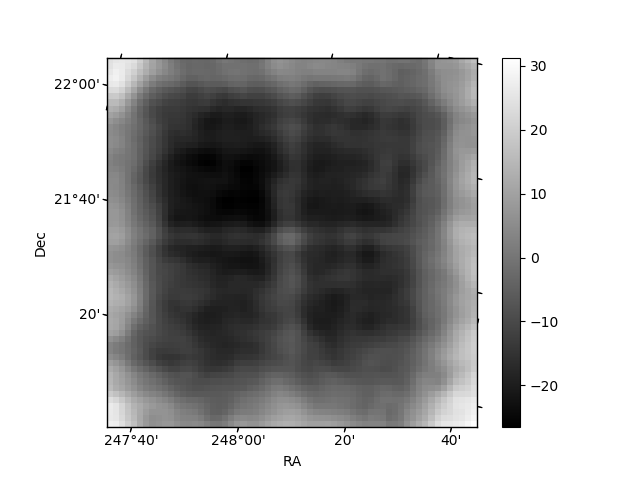
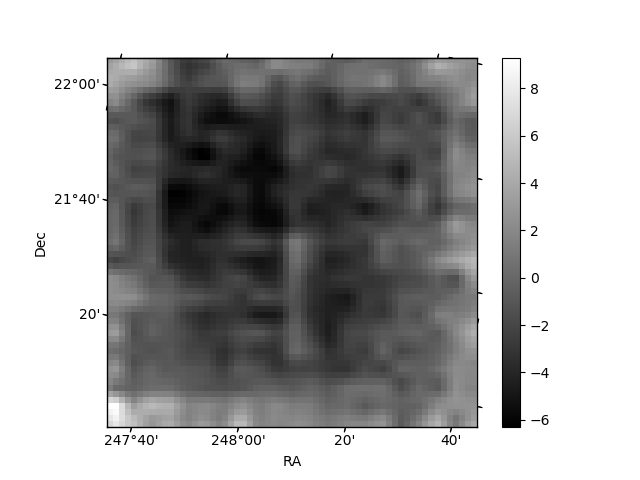
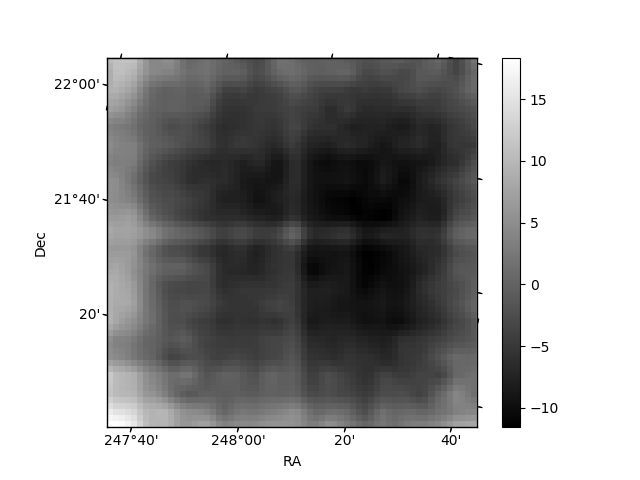
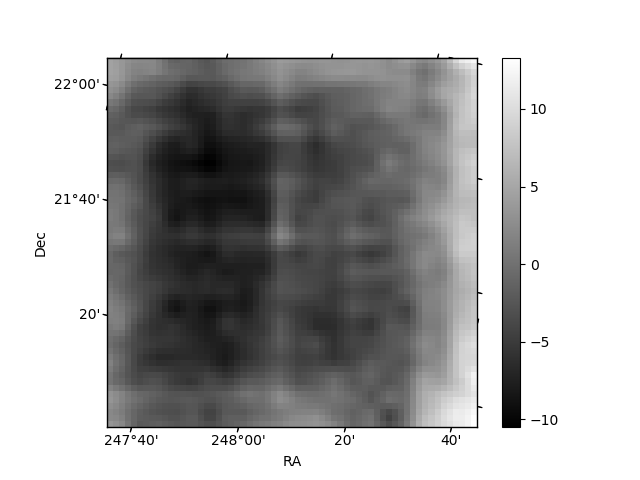
Histogram calculated using DETX and DETY for each event in the final _common_clean file
| Quadrant A | 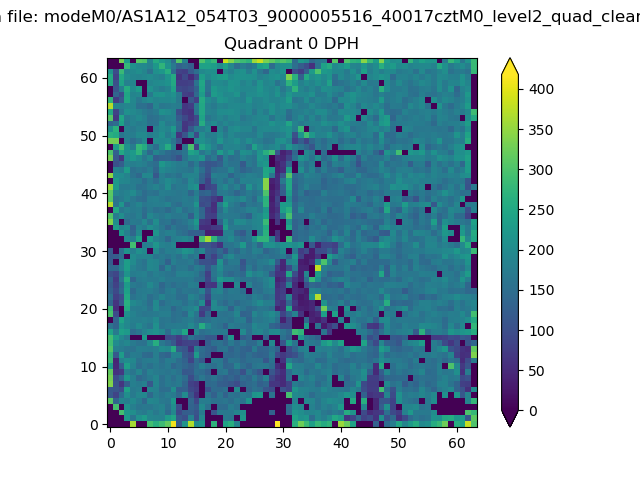 |
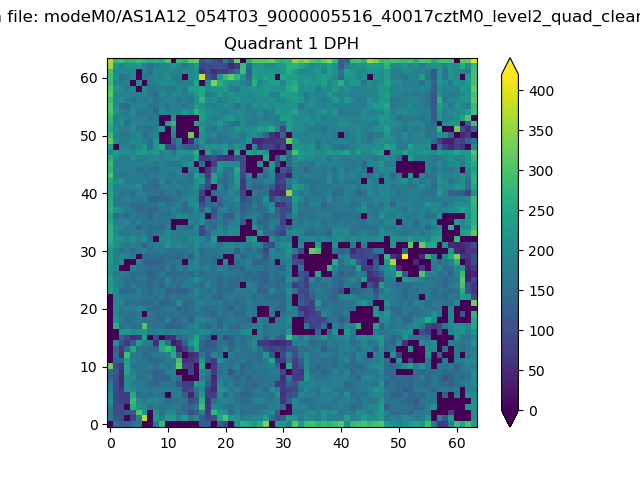 |
Quadrant B |
|---|---|---|---|
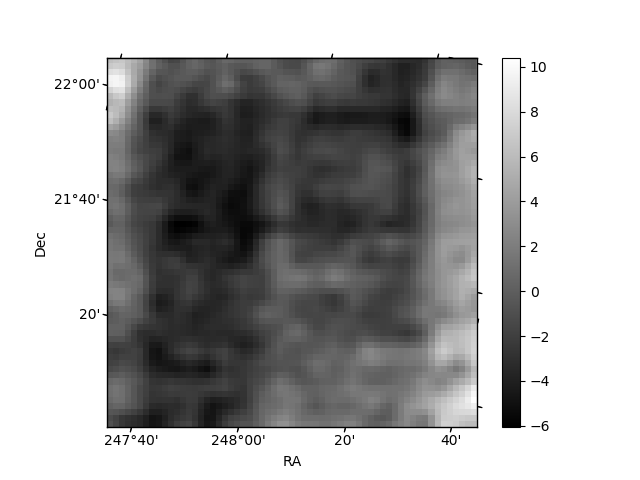
| Quadrant D | 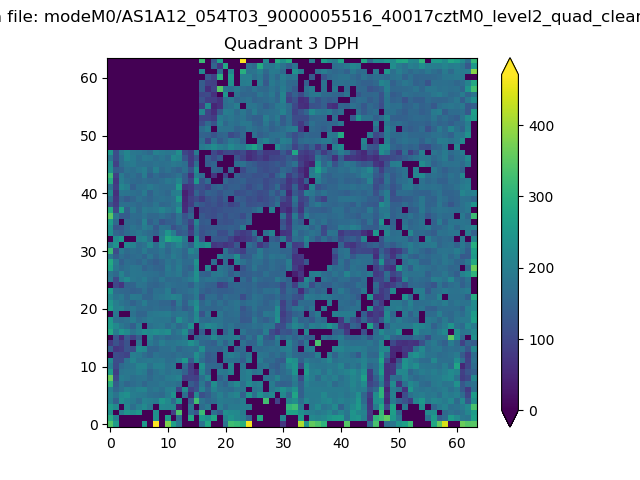 |
 |
Quadrant C |
| Plot type | Count rate plots | Images |
|---|---|---|
| Comparison with Poisson distribution Blue bars denote a histogram of data divided into 1 sec bins. Red curve is a Poisson curve with rate = median count rate of data. |
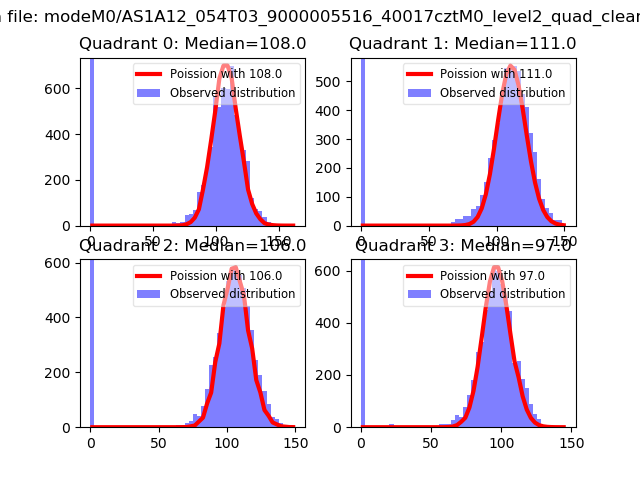 |
 |
| Quadrant-wise count rates Data is divided into 100 sec bins |
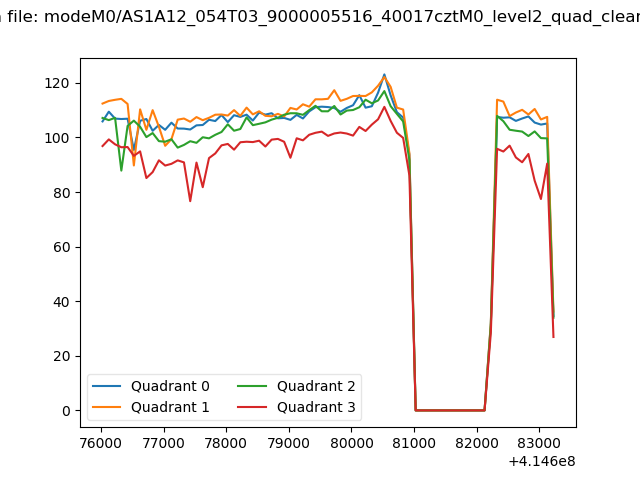 |
|
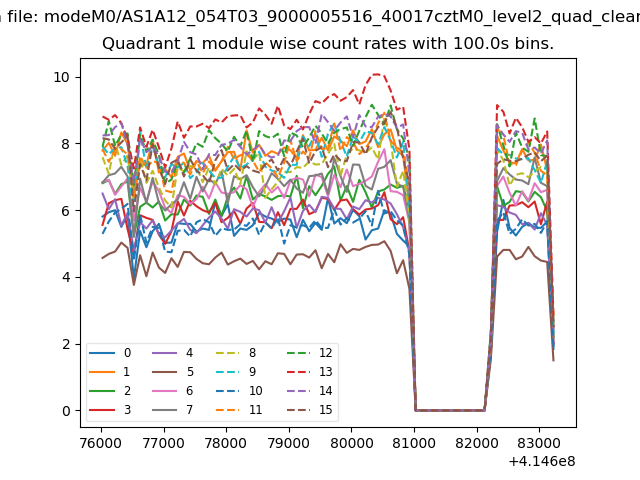
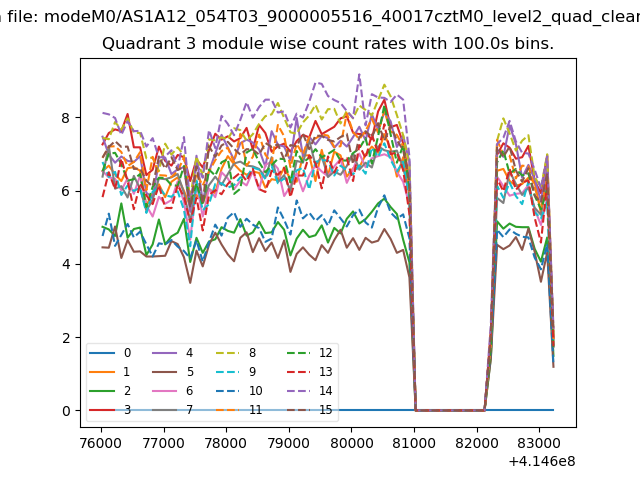
| Module-wise count rates for Quadrant A Data is divided into 100 sec bins |
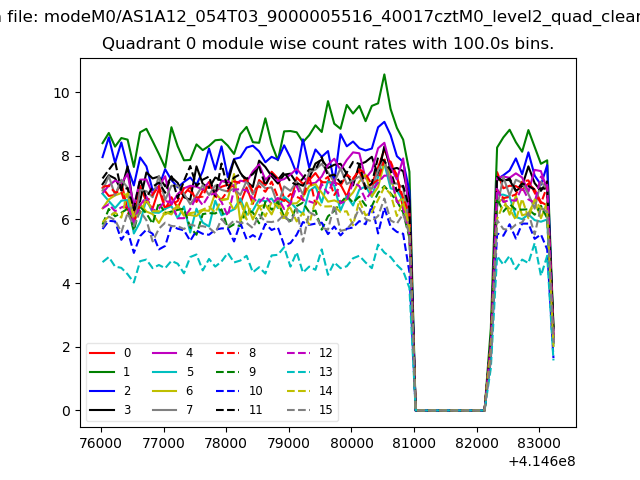 |
 |
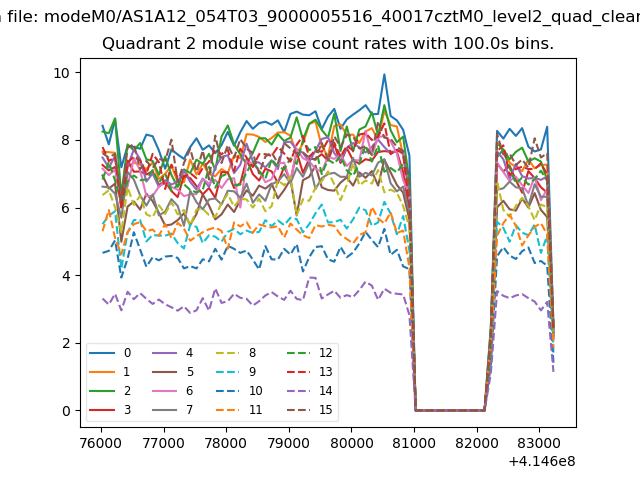
| Module-wise count rates for Quadrant B Data is divided into 100 sec bins |
 |
 |
| Module-wise count rates for Quadrant C Data is divided into 100 sec bins |
 |
 |
| Module-wise count rates for Quadrant D Data is divided into 100 sec bins |
 |
 |
| Parameter | Plot |
|---|---|
| CZT HV Monitor |  |
| D_VDD | 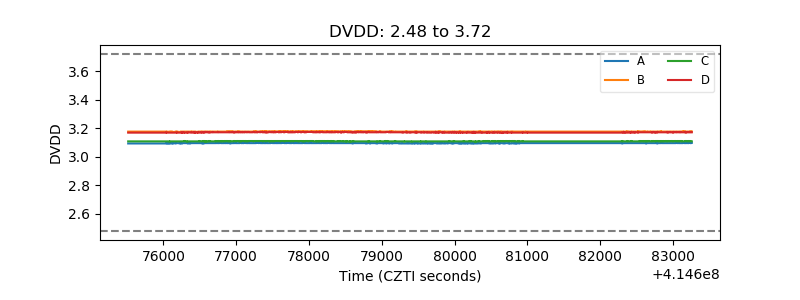 |
| Temperature 1 | 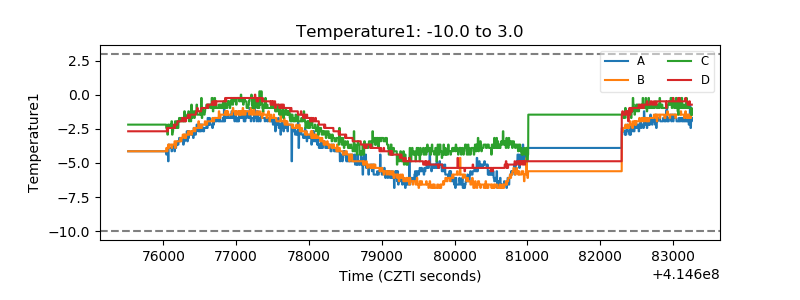 |
| Veto HV Monitor | 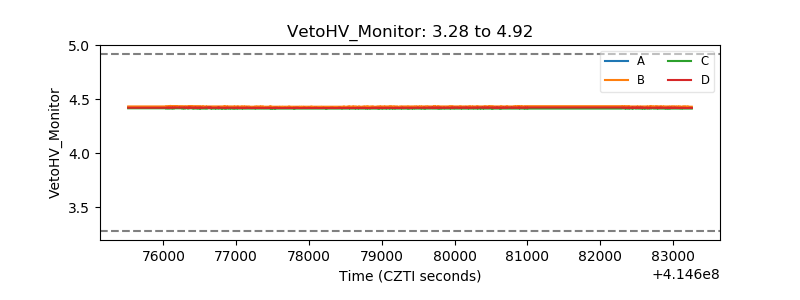 |
| Veto LLD | 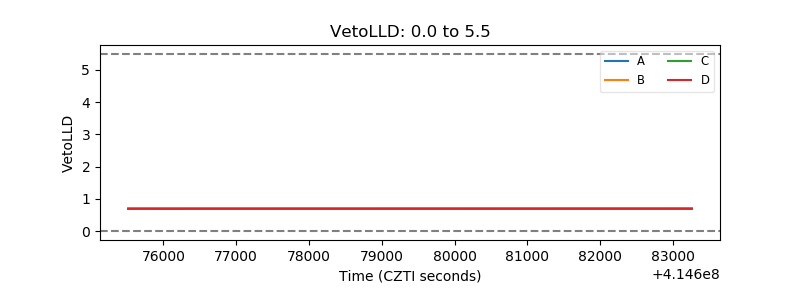 |
| Alpha Counter | 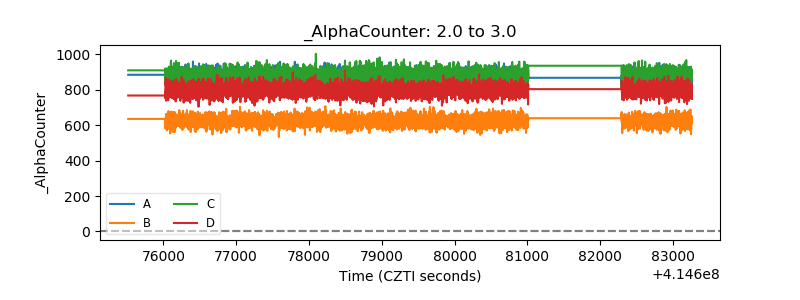 |
| _CPM_Rate | 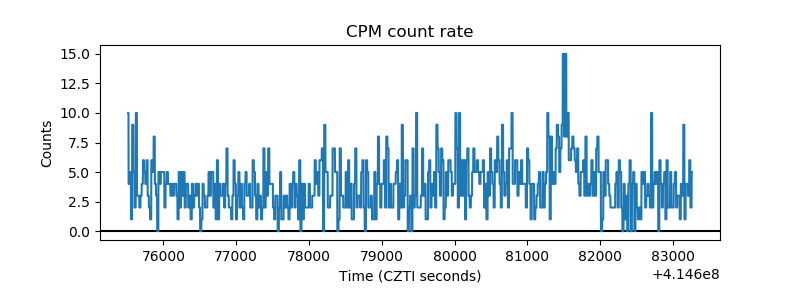 |
| CZT Counter | 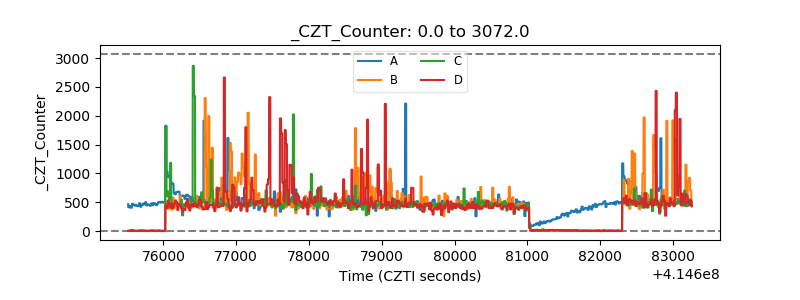 |
| +2.5 Volts monitor | 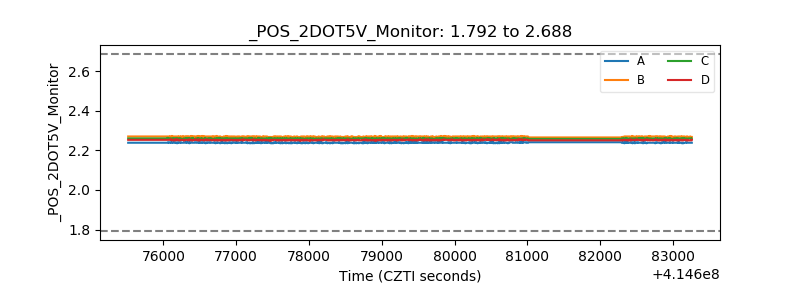 |
| +5 Volts monitor | 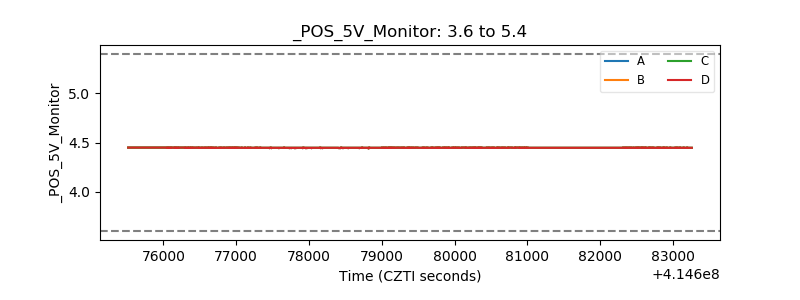 |
| _ROLL_ROT | 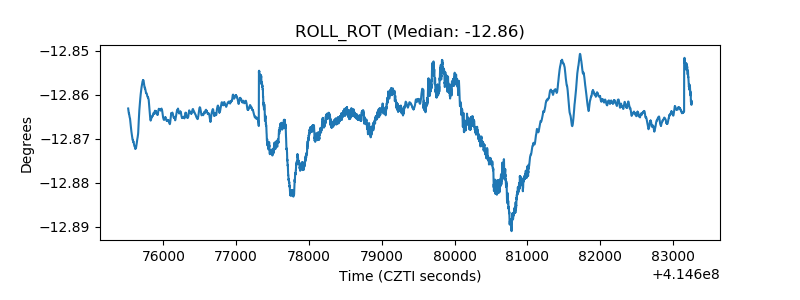 |
| _Roll_DEC | 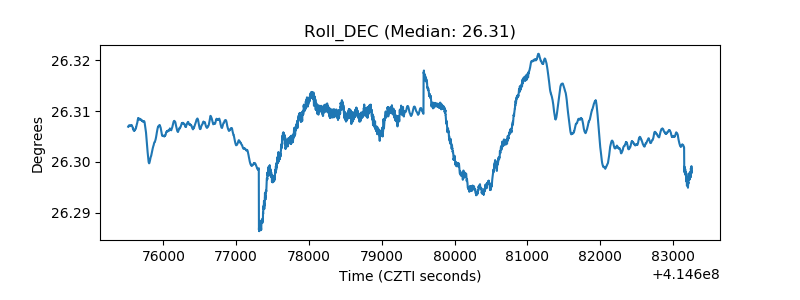 |
| _Roll_RA | 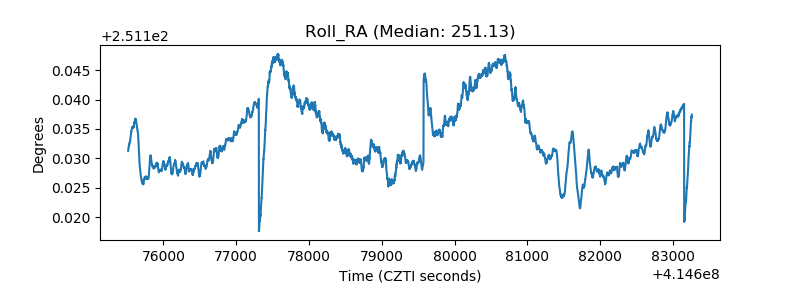 |
| Veto Counter | 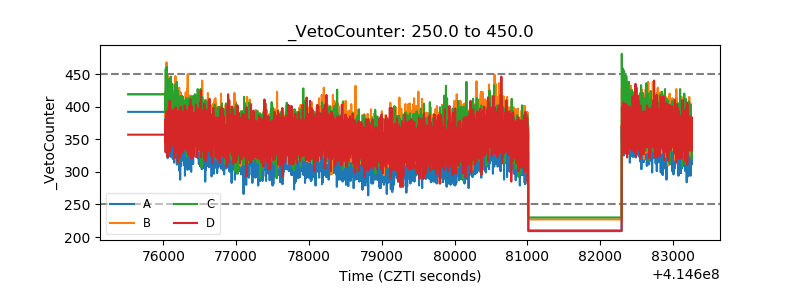 |