| Param | Original file | Final file |
|---|---|---|
| Filename | modeM0/AS1A12_054T03_9000005516_40020cztM0_level2.fits | modeM0/AS1A12_054T03_9000005516_40020cztM0_level2_quad_clean.evt |
| Size (bytes) | 952,090,560 | 249,284,160 |
| Size | 908.0 MB | 237.7 MB |
| Events in quadrant A | 8,280,798 | 1,660,929 |
| Events in quadrant B | 8,575,200 | 1,695,352 |
| Events in quadrant C | 7,756,592 | 1,634,754 |
| Events in quadrant D | 9,423,126 | 1,480,675 |
| Mode M9 | |||
|---|---|---|---|
| Quadrant | BADHDUFLAG | Total packets | Discarded packets |
| A | 0 | 48 | 0 |
| B | 0 | 48 | 0 |
| C | 0 | 48 | 0 |
| D | 0 | 49 | 0 |
| Mode SS | |||
|---|---|---|---|
| Quadrant | BADHDUFLAG | Total packets | Discarded packets |
| A | 0 | 320 | 0 |
| B | 0 | 320 | 0 |
| C | 0 | 320 | 0 |
| D | 0 | 320 | 0 |
| Mode M0 | |||
|---|---|---|---|
| Quadrant | BADHDUFLAG | Total packets | Discarded packets |
| A | 0 | 34239 | 5 |
| B | 0 | 36176 | 4 |
| C | 0 | 33011 | 4 |
| D | 0 | 38512 | 4 |
| Quadrant | Total seconds | Saturated seconds | Saturation percentage |
|---|---|---|---|
| A | 15586 | 96 | 0.615937% |
| B | 15586 | 255 | 1.636084% |
| C | 15586 | 107 | 0.686514% |
| D | 15586 | 523 | 3.355576% |
Noise dominated data is calculated using 1-second bins in cleaned event files. If a bin has >2000 counts, and if more than 50% of those come from <1% of pixels, then it is considered to be noise-dominated and hence unusable.
| Quadrant | # 1 sec bins | Bins with >0 counts | Bins with >2000 counts | High rate bins dominated by noise | Noise dominated (total time) | Noise dominated (detector-on time) | Marked lightcurve |
|---|---|---|---|---|---|---|---|
| A | 19822 | 15589 | 56 | 56 | 0.28% | 0.36% | 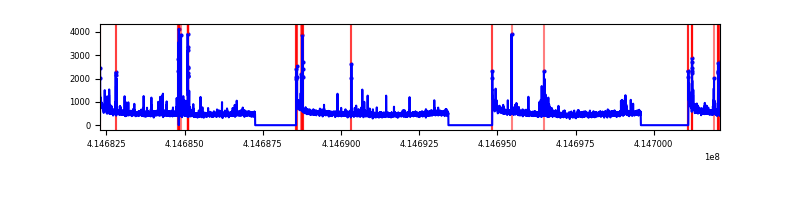 |
| B | 19822 | 15589 | 136 | 136 | 0.69% | 0.87% | 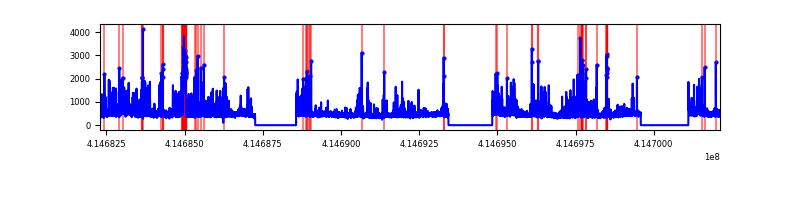 |
| C | 19822 | 15589 | 90 | 90 | 0.45% | 0.58% | 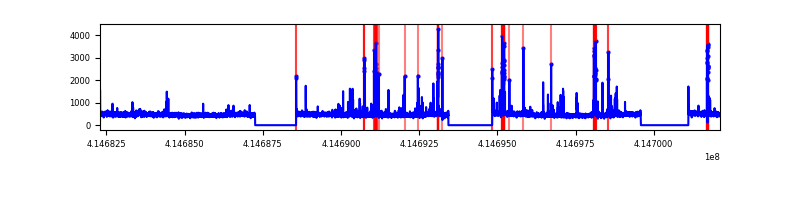 |
| D | 19822 | 15589 | 443 | 443 | 2.23% | 2.84% | 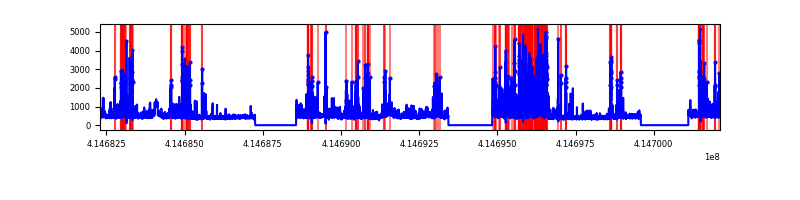 |
Top three noisy pixels from each quadrant. If the there are fewer than three noisy pixels in the level2.evt file, extra rows are filled as -1
| Pixel properties | Quadrant properties | ||||||
|---|---|---|---|---|---|---|---|
| Quadrant | DetID | PixID | Counts | Sigma | Mean | Median | Sigma |
| A | 10 | 83 | 1212360 | 3523.76 | 1692 | 1659 | 343.6 |
| A | 13 | 248 | 258829 | 748.5 | 1692 | 1659 | 343.6 |
| A | 2 | 79 | 103392 | 296.1 | 1692 | 1659 | 343.6 |
| B | 4 | 171 | 1731378 | 5327.03 | 1681 | 1637 | 324.7 |
| B | 0 | 230 | 67457 | 202.7 | 1681 | 1637 | 324.7 |
| B | 4 | 81 | 44540 | 132.13 | 1681 | 1637 | 324.7 |
| C | 15 | 214 | 636124 | 1647.97 | 1655 | 1665 | 385.0 |
| C | 14 | 254 | 575515 | 1490.54 | 1655 | 1665 | 385.0 |
| C | 15 | 208 | 33248 | 82.03 | 1655 | 1665 | 385.0 |
| D | 12 | 227 | 1824818 | 4602.38 | 1634 | 1591 | 396.1 |
| D | 13 | 249 | 431879 | 1086.18 | 1634 | 1591 | 396.1 |
| D | 2 | 31 | 419453 | 1054.81 | 1634 | 1591 | 396.1 |
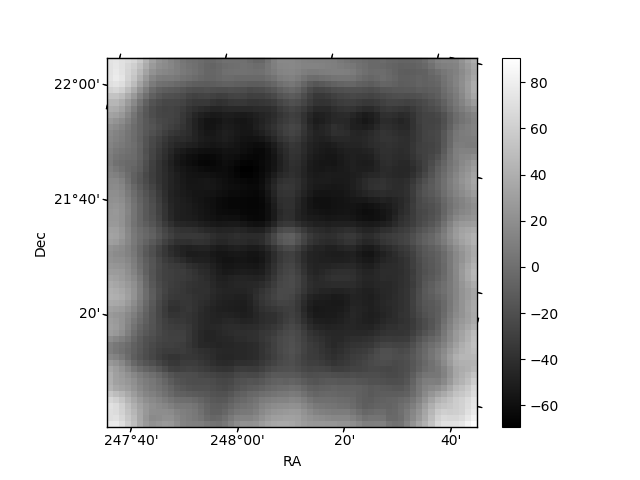
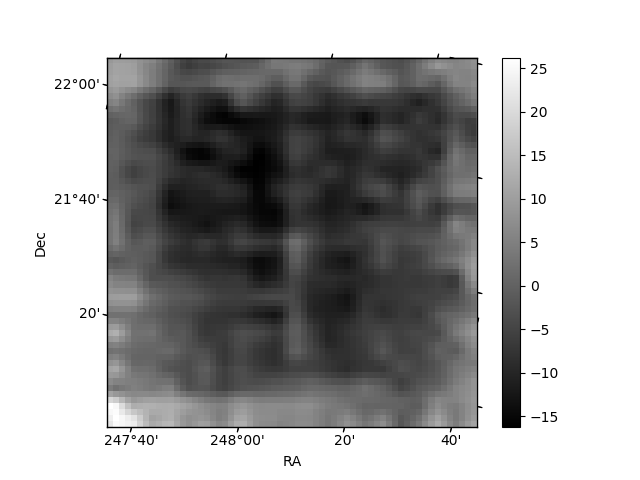
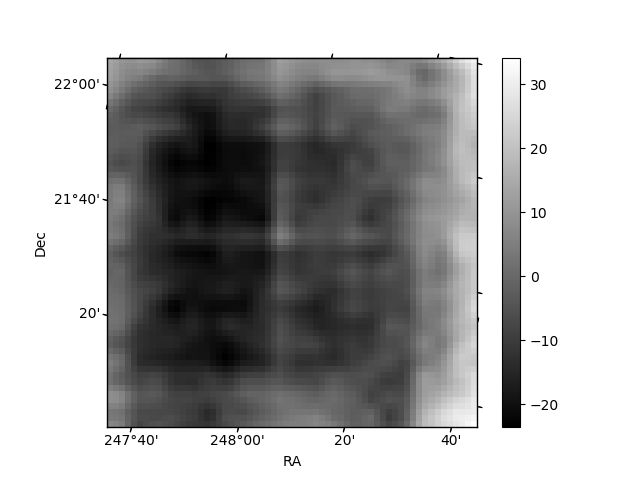
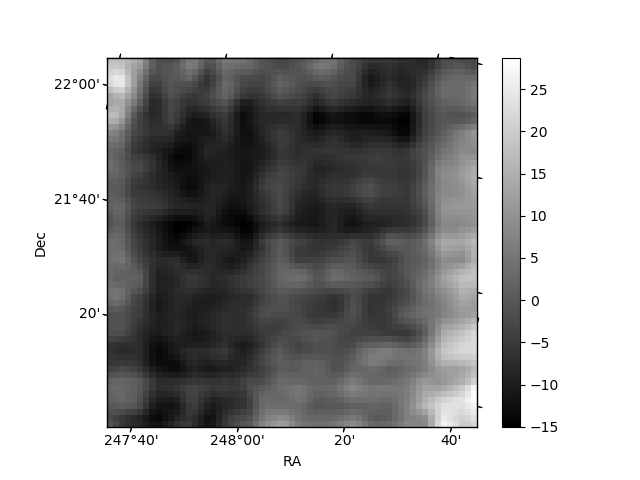
Histogram calculated using DETX and DETY for each event in the final _common_clean file
| Quadrant A | 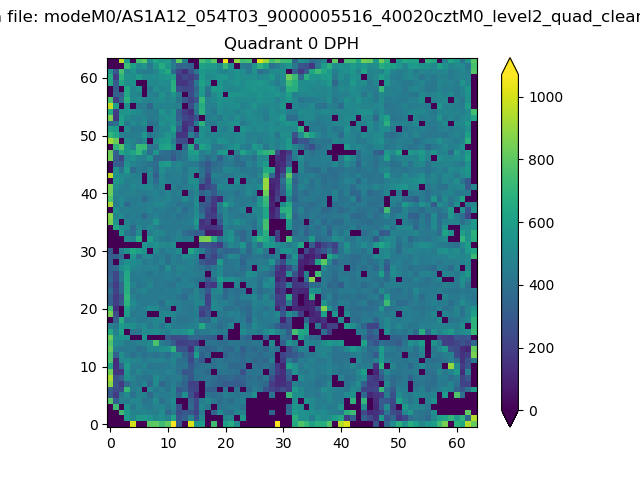 |
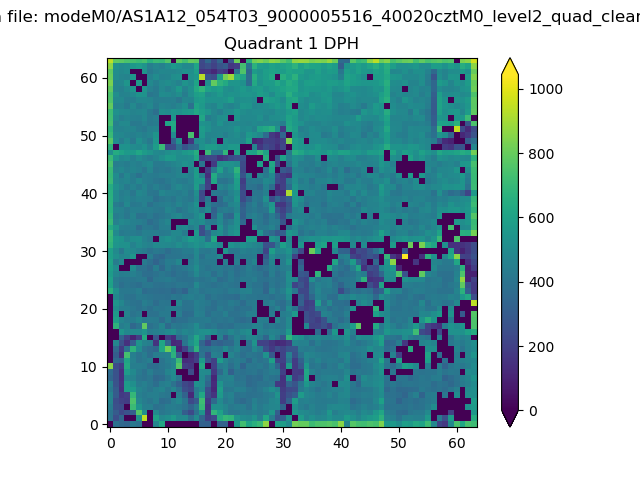 |
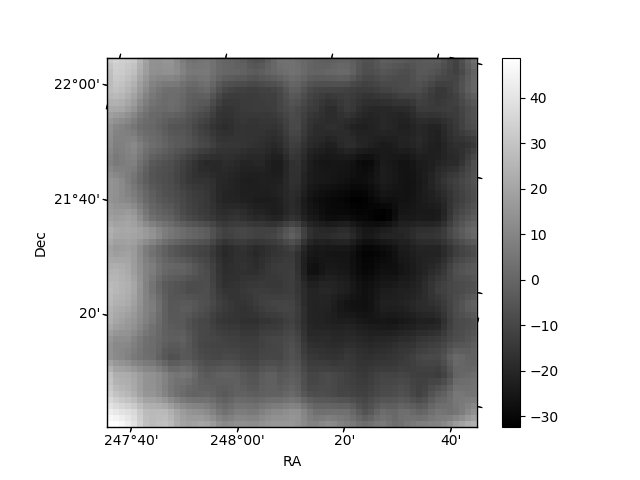
Quadrant B |
|---|---|---|---|
| Quadrant D | 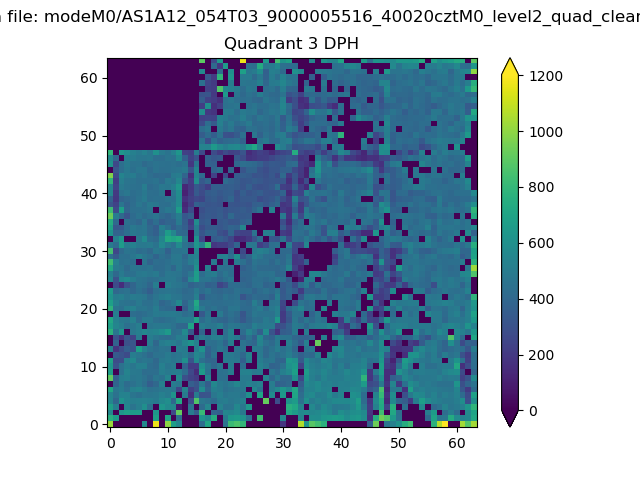 |
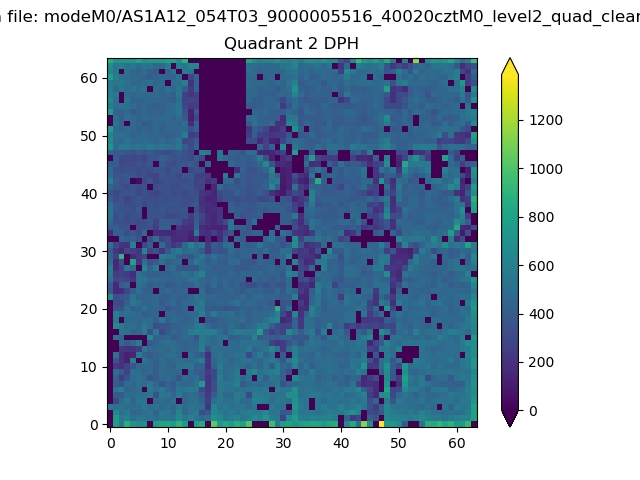 |
Quadrant C |
| Plot type | Count rate plots | Images |
|---|---|---|
| Comparison with Poisson distribution Blue bars denote a histogram of data divided into 1 sec bins. Red curve is a Poisson curve with rate = median count rate of data. |
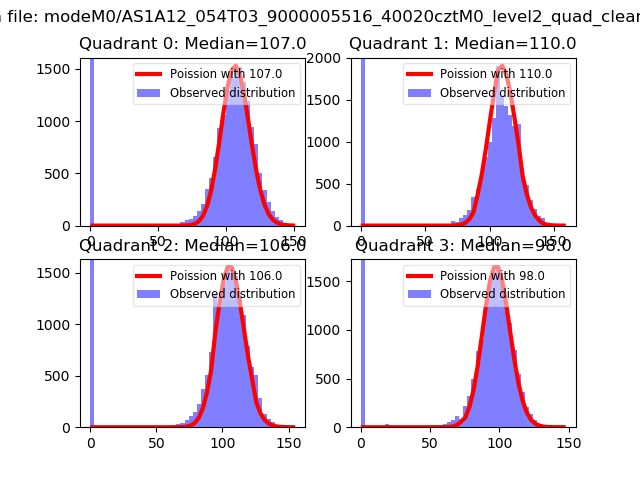 |
 |
| Quadrant-wise count rates Data is divided into 100 sec bins |
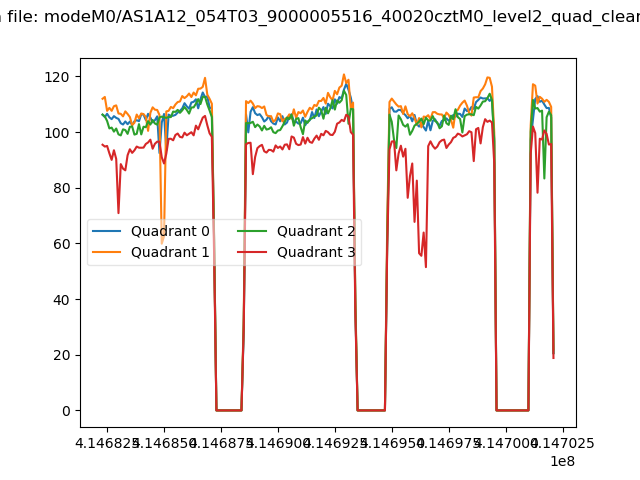 |
|
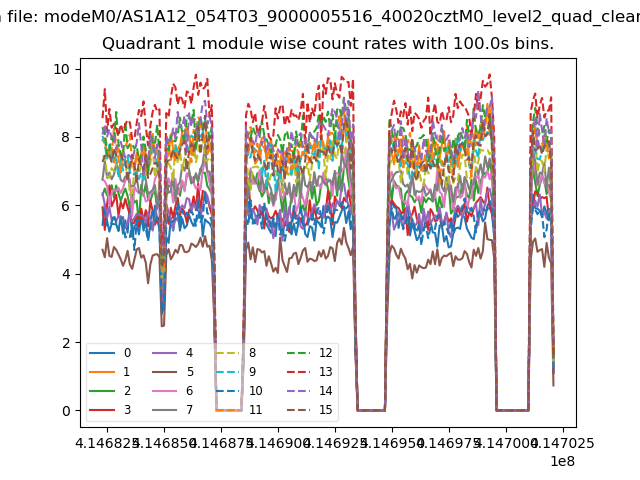
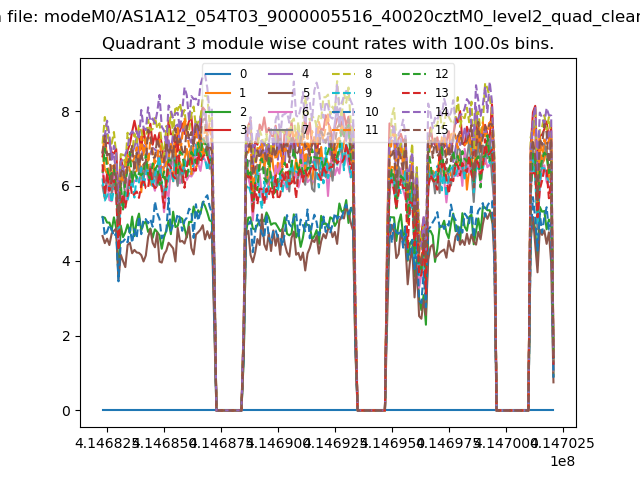
| Module-wise count rates for Quadrant A Data is divided into 100 sec bins |
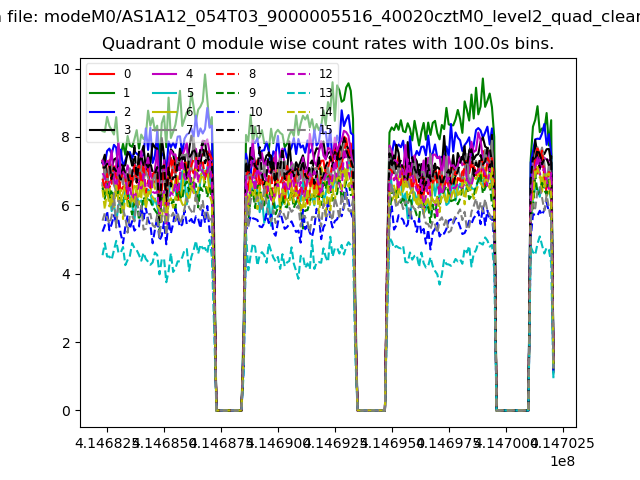 |
 |
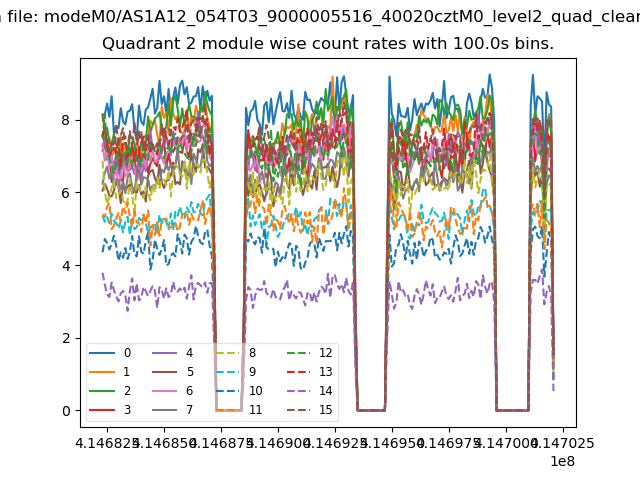
| Module-wise count rates for Quadrant B Data is divided into 100 sec bins |
 |
 |
| Module-wise count rates for Quadrant C Data is divided into 100 sec bins |
 |
 |
| Module-wise count rates for Quadrant D Data is divided into 100 sec bins |
 |
 |
| Parameter | Plot |
|---|---|
| CZT HV Monitor | 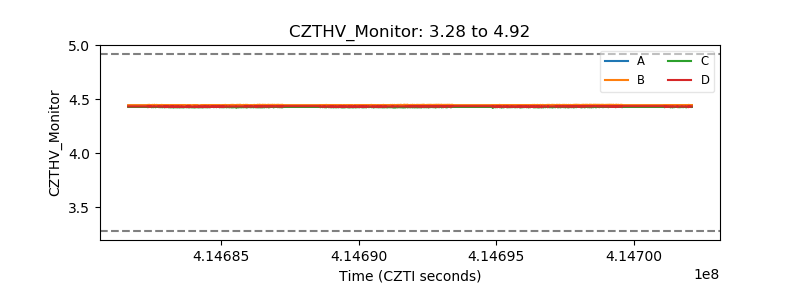 |
| D_VDD | 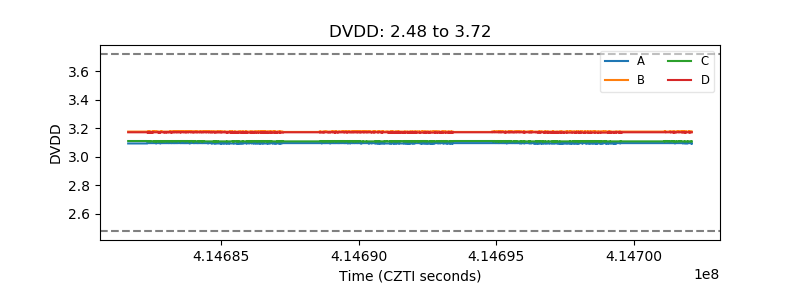 |
| Temperature 1 | 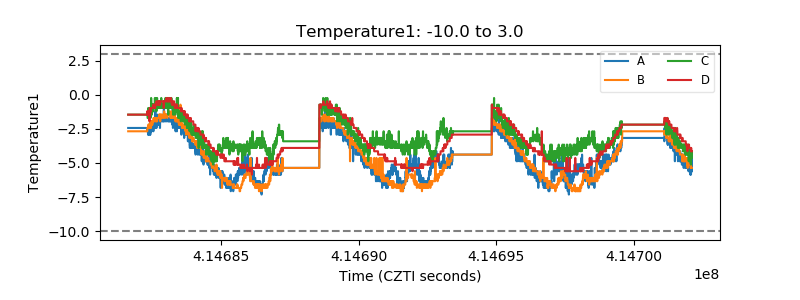 |
| Veto HV Monitor | 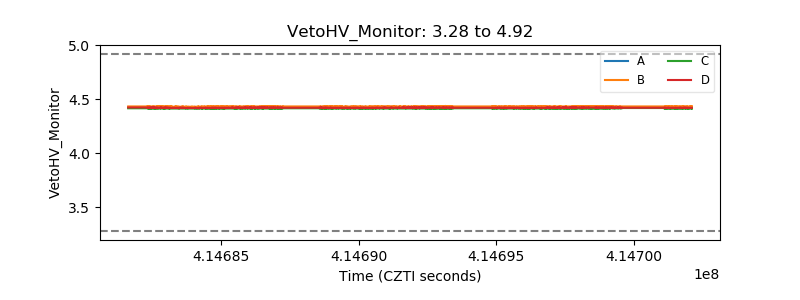 |
| Veto LLD | 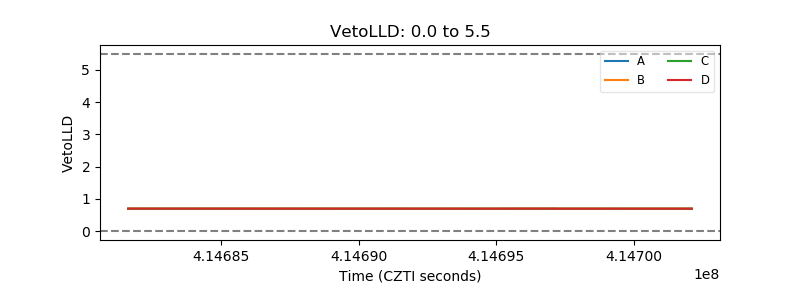 |
| Alpha Counter | 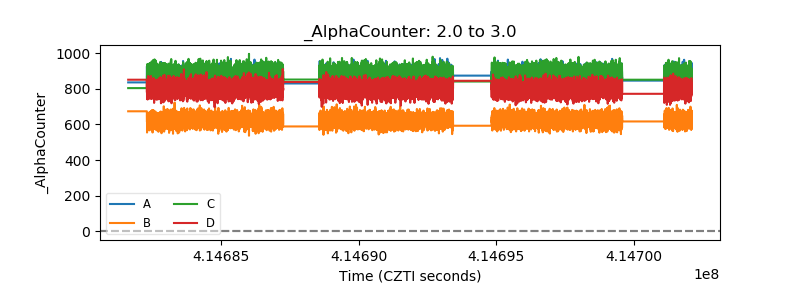 |
| _CPM_Rate | 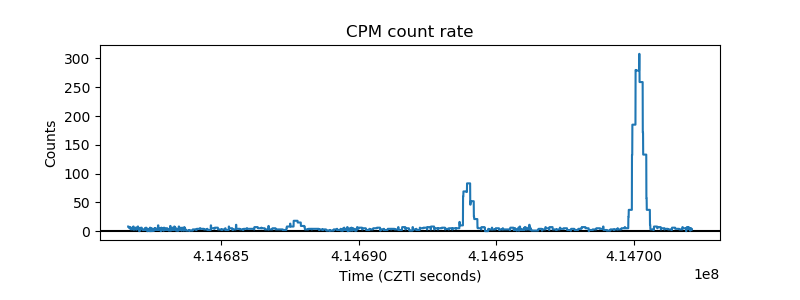 |
| CZT Counter | 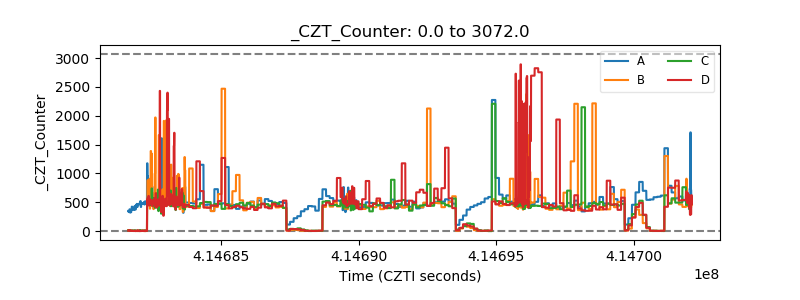 |
| +2.5 Volts monitor | 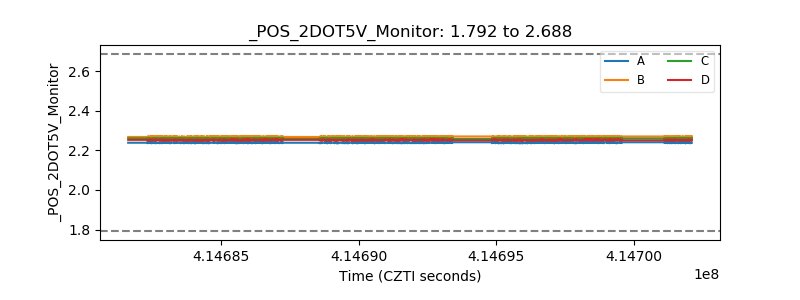 |
| +5 Volts monitor | 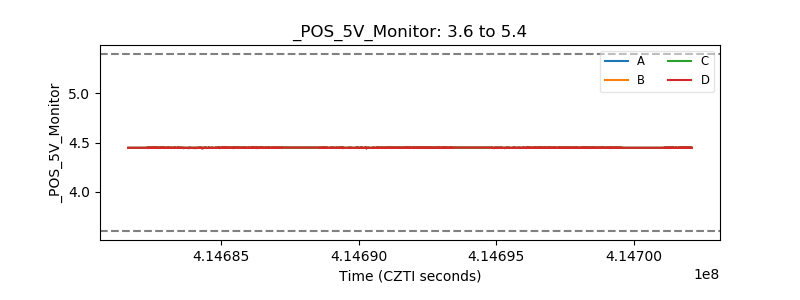 |
| _ROLL_ROT | 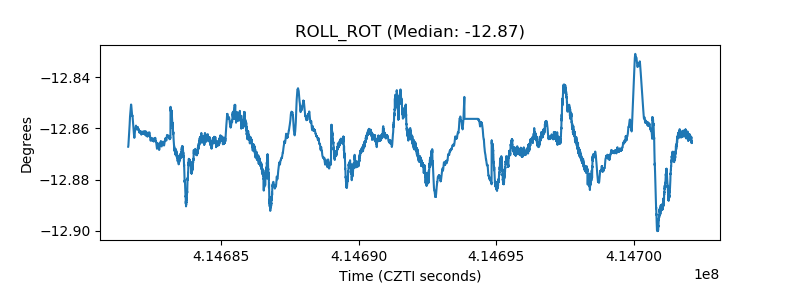 |
| _Roll_DEC | 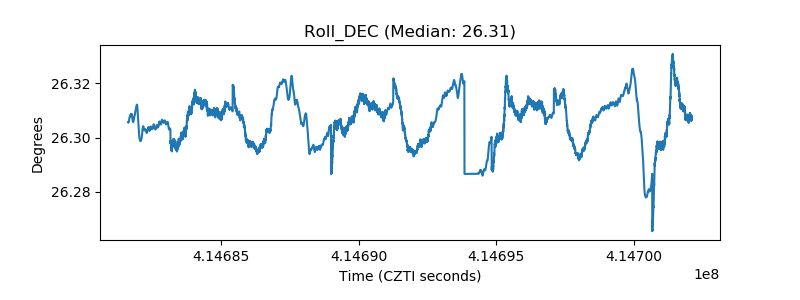 |
| _Roll_RA | 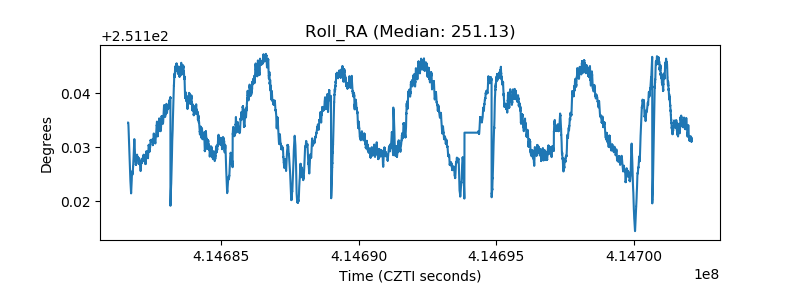 |
| Veto Counter | 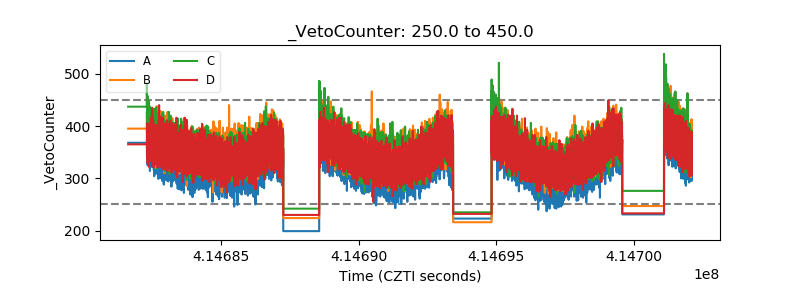 |