| Param | Original file | Final file |
|---|---|---|
| Filename | modeM0/AS1A12_054T03_9000005516_40021cztM0_level2.fits | modeM0/AS1A12_054T03_9000005516_40021cztM0_level2_quad_clean.evt |
| Size (bytes) | 319,841,280 | 89,887,680 |
| Size | 305.0 MB | 85.7 MB |
| Events in quadrant A | 2,984,897 | 596,010 |
| Events in quadrant B | 2,708,930 | 612,836 |
| Events in quadrant C | 2,685,607 | 591,491 |
| Events in quadrant D | 3,035,272 | 539,522 |
| Mode M9 | |||
|---|---|---|---|
| Quadrant | BADHDUFLAG | Total packets | Discarded packets |
| A | 0 | 28 | 0 |
| B | 0 | 28 | 0 |
| C | 0 | 28 | 0 |
| D | 0 | 29 | 0 |
| Mode SS | |||
|---|---|---|---|
| Quadrant | BADHDUFLAG | Total packets | Discarded packets |
| A | 0 | 112 | 0 |
| B | 0 | 112 | 0 |
| C | 0 | 112 | 0 |
| D | 0 | 112 | 0 |
| Mode M0 | |||
|---|---|---|---|
| Quadrant | BADHDUFLAG | Total packets | Discarded packets |
| A | 0 | 12465 | 3 |
| B | 0 | 11840 | 2 |
| C | 0 | 11475 | 2 |
| D | 0 | 12874 | 2 |
| Quadrant | Total seconds | Saturated seconds | Saturation percentage |
|---|---|---|---|
| A | 5451 | 48 | 0.880572% |
| B | 5451 | 47 | 0.862227% |
| C | 5451 | 43 | 0.788846% |
| D | 5451 | 94 | 1.724454% |
Noise dominated data is calculated using 1-second bins in cleaned event files. If a bin has >2000 counts, and if more than 50% of those come from <1% of pixels, then it is considered to be noise-dominated and hence unusable.
| Quadrant | # 1 sec bins | Bins with >0 counts | Bins with >2000 counts | High rate bins dominated by noise | Noise dominated (total time) | Noise dominated (detector-on time) | Marked lightcurve |
|---|---|---|---|---|---|---|---|
| A | 7094 | 5452 | 30 | 30 | 0.42% | 0.55% | 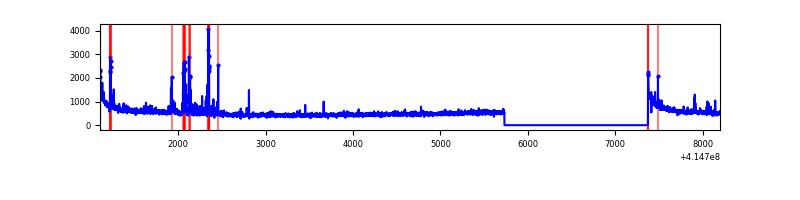 |
| B | 7094 | 5452 | 20 | 20 | 0.28% | 0.37% | 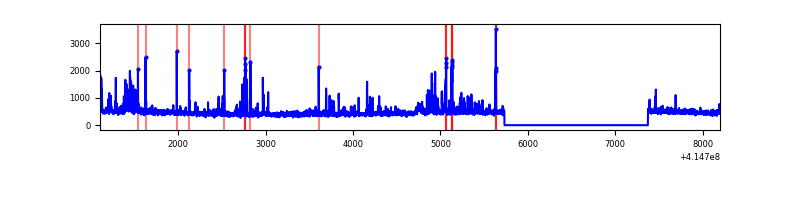 |
| C | 7094 | 5452 | 30 | 30 | 0.42% | 0.55% | 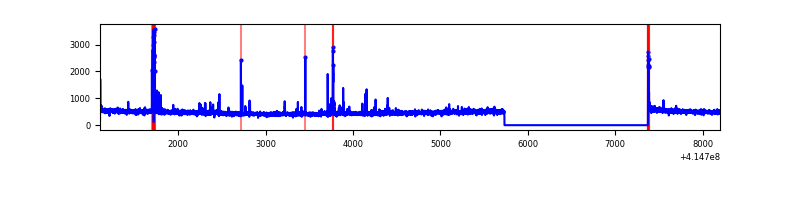 |
| D | 7094 | 5452 | 88 | 88 | 1.24% | 1.61% | 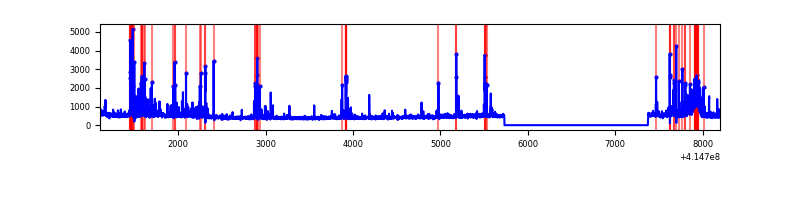 |
Top three noisy pixels from each quadrant. If the there are fewer than three noisy pixels in the level2.evt file, extra rows are filled as -1
| Pixel properties | Quadrant properties | ||||||
|---|---|---|---|---|---|---|---|
| Quadrant | DetID | PixID | Counts | Sigma | Mean | Median | Sigma |
| A | 10 | 83 | 464904 | 3813.03 | 593 | 581 | 121.8 |
| A | 13 | 248 | 116959 | 955.7 | 593 | 581 | 121.8 |
| A | 7 | 3 | 24363 | 195.3 | 593 | 581 | 121.8 |
| B | 4 | 171 | 296461 | 2527.27 | 594 | 578 | 117.1 |
| B | 4 | 81 | 35580 | 298.97 | 594 | 578 | 117.1 |
| B | 0 | 230 | 20967 | 174.15 | 594 | 578 | 117.1 |
| C | 15 | 214 | 225741 | 1639.83 | 583 | 587 | 137.3 |
| C | 14 | 254 | 150296 | 1090.35 | 583 | 587 | 137.3 |
| C | 10 | 20 | 15551 | 108.99 | 583 | 587 | 137.3 |
| D | 12 | 227 | 423932 | 2955.5 | 578 | 562 | 143.2 |
| D | 2 | 31 | 133670 | 929.21 | 578 | 562 | 143.2 |
| D | 2 | 250 | 128875 | 895.74 | 578 | 562 | 143.2 |
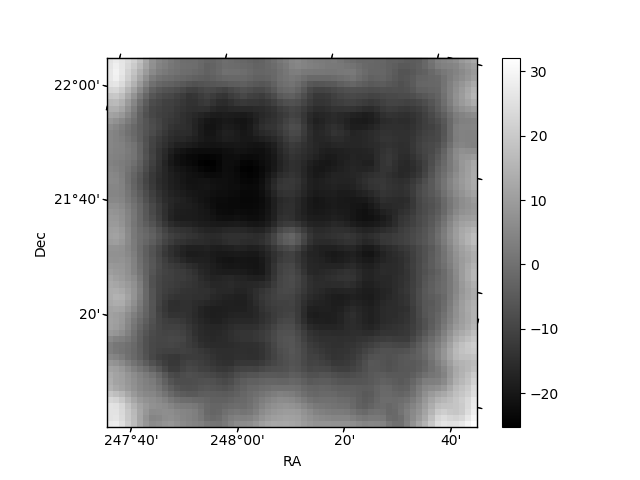
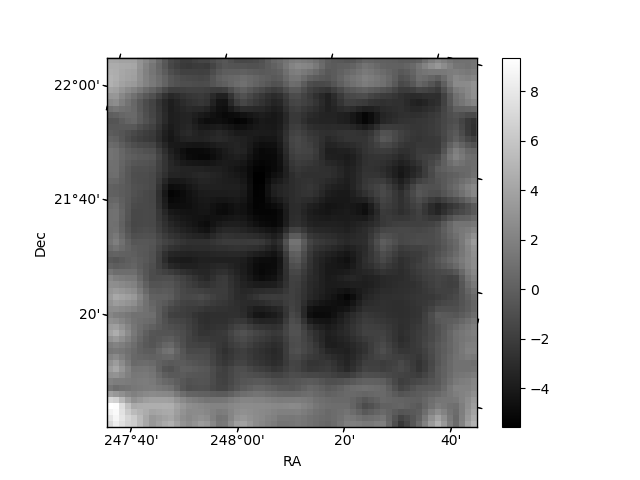
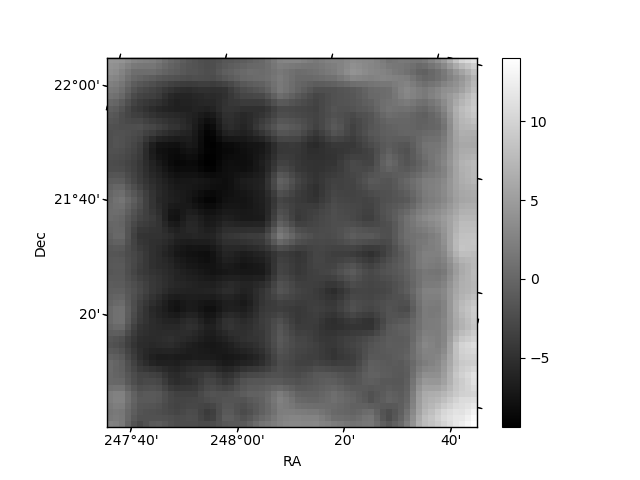
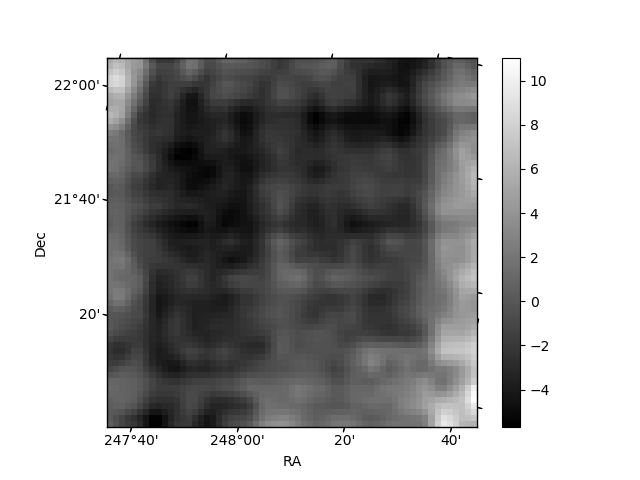
Histogram calculated using DETX and DETY for each event in the final _common_clean file
| Quadrant A | 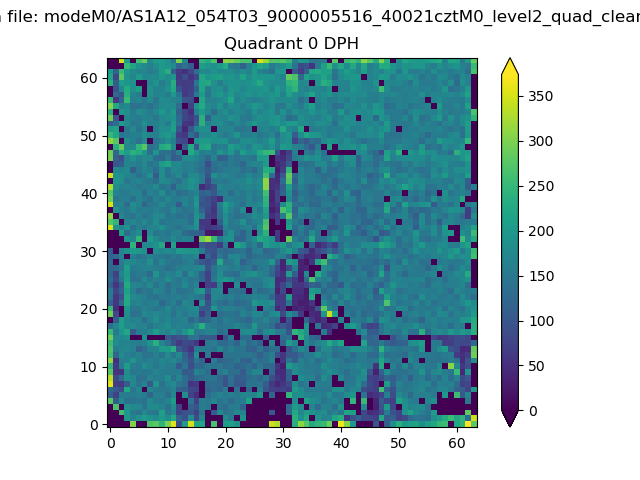 |
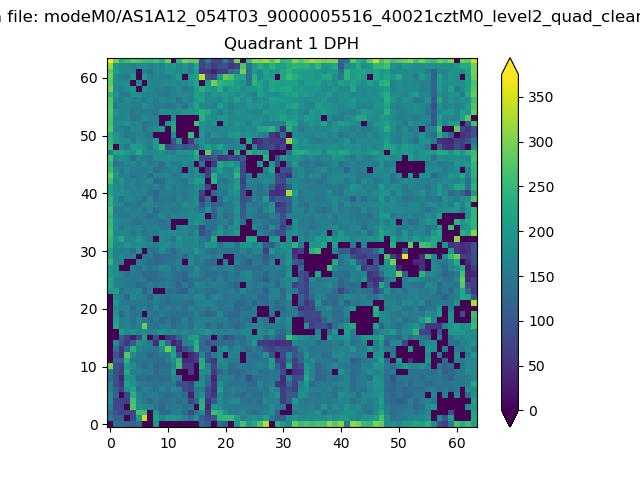 |
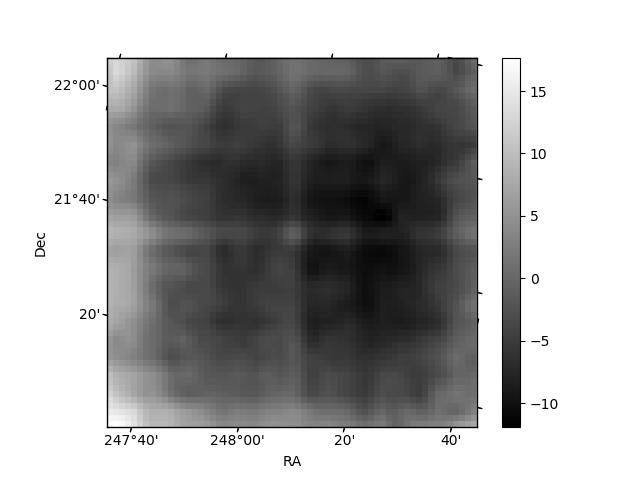
Quadrant B |
|---|---|---|---|
| Quadrant D | 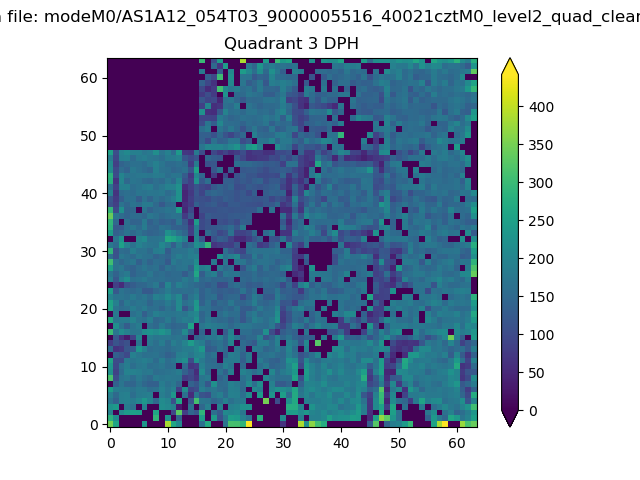 |
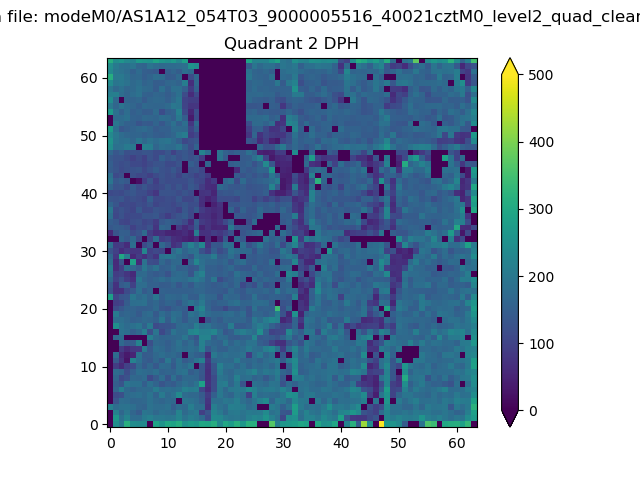 |
Quadrant C |
| Plot type | Count rate plots | Images |
|---|---|---|
| Comparison with Poisson distribution Blue bars denote a histogram of data divided into 1 sec bins. Red curve is a Poisson curve with rate = median count rate of data. |
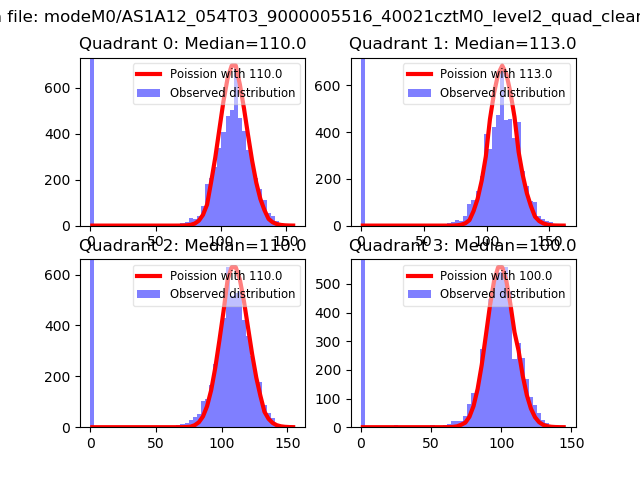 |
 |
| Quadrant-wise count rates Data is divided into 100 sec bins |
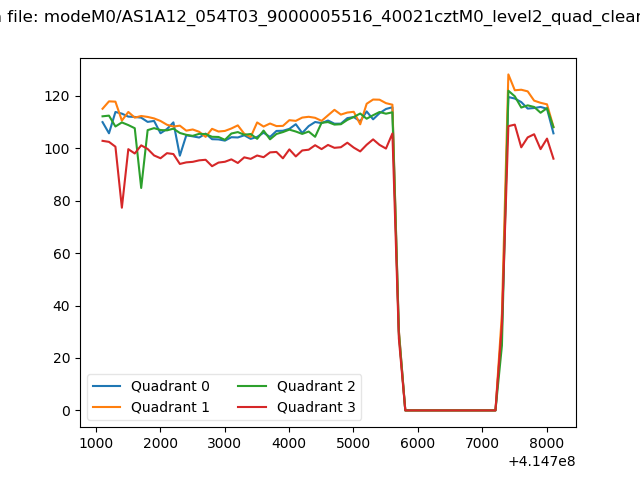 |
|
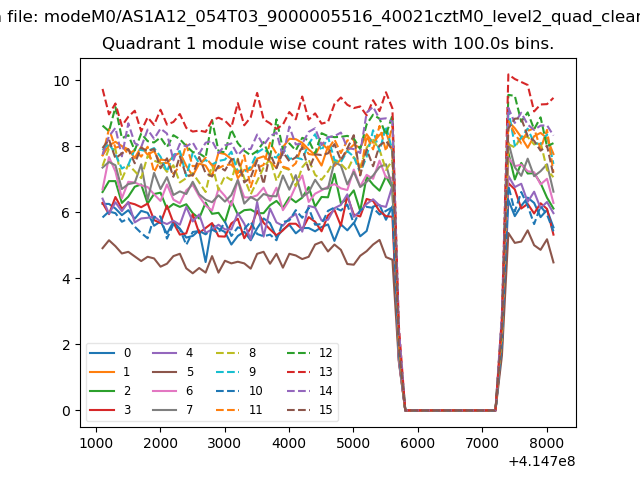
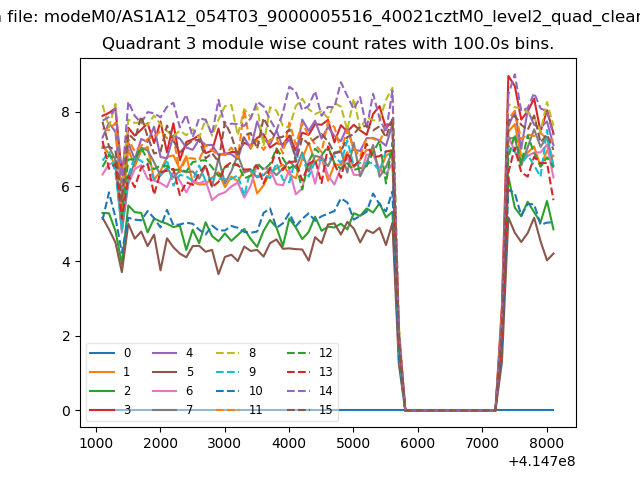
| Module-wise count rates for Quadrant A Data is divided into 100 sec bins |
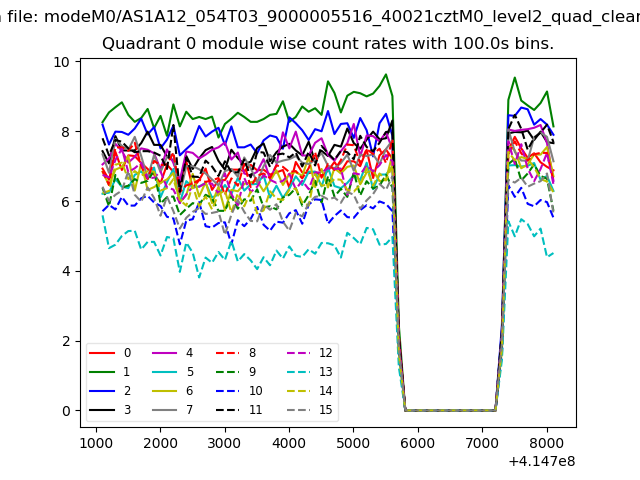 |
 |
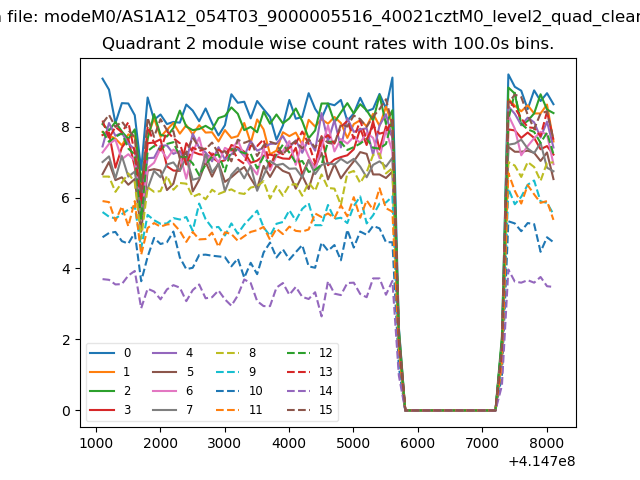
| Module-wise count rates for Quadrant B Data is divided into 100 sec bins |
 |
 |
| Module-wise count rates for Quadrant C Data is divided into 100 sec bins |
 |
 |
| Module-wise count rates for Quadrant D Data is divided into 100 sec bins |
 |
 |
| Parameter | Plot |
|---|---|
| CZT HV Monitor | 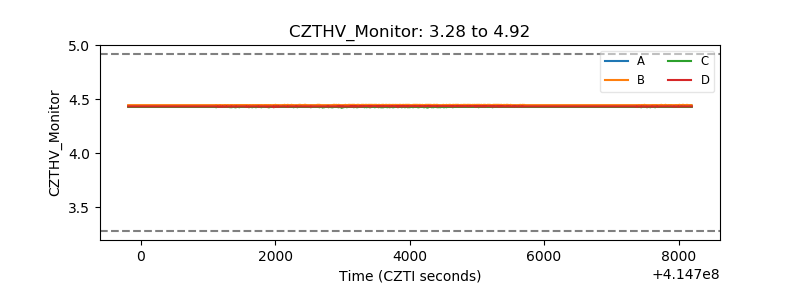 |
| D_VDD | 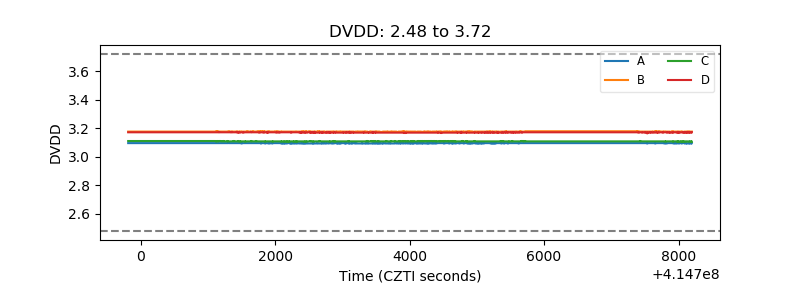 |
| Temperature 1 | 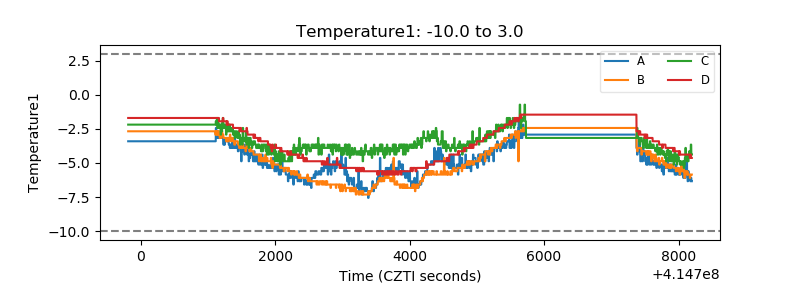 |
| Veto HV Monitor | 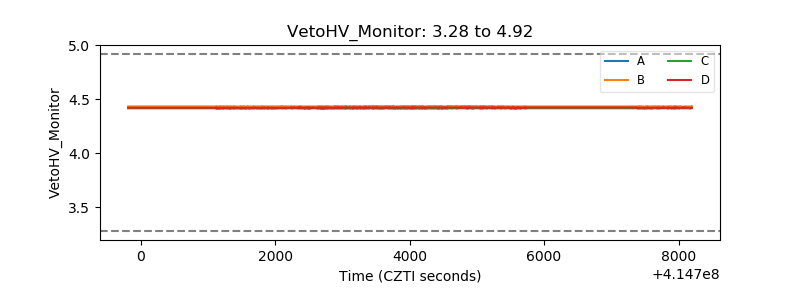 |
| Veto LLD |  |
| Alpha Counter | 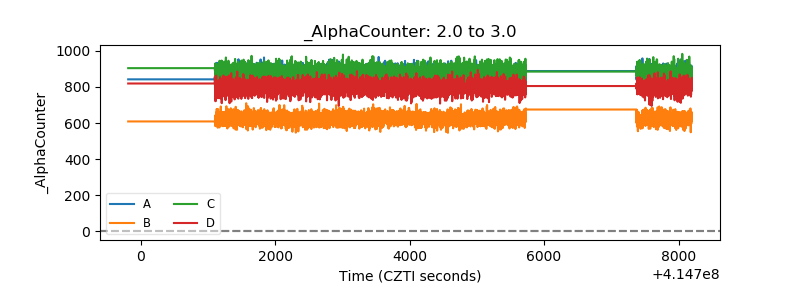 |
| _CPM_Rate | 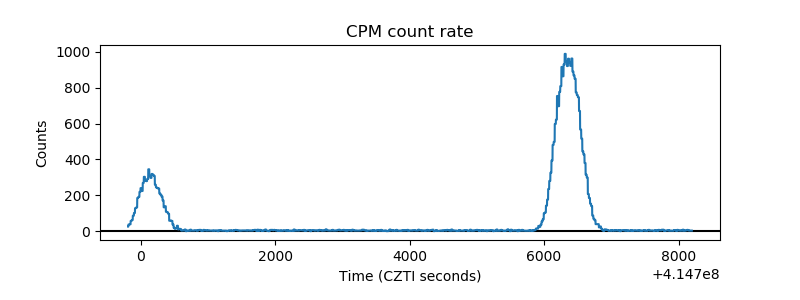 |
| CZT Counter | 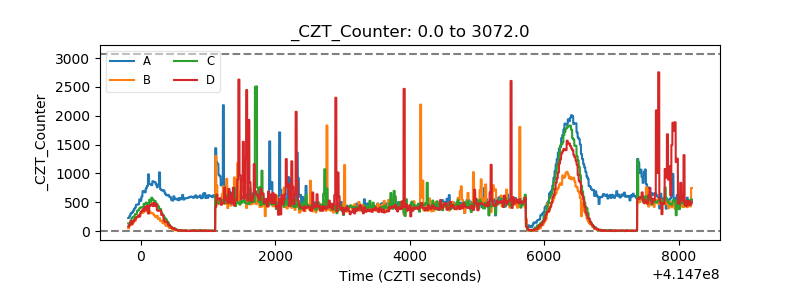 |
| +2.5 Volts monitor | 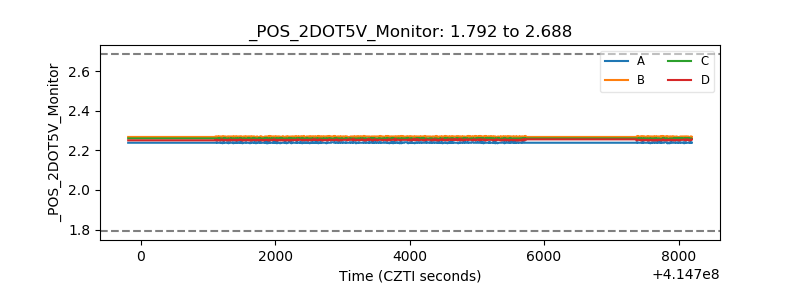 |
| +5 Volts monitor | 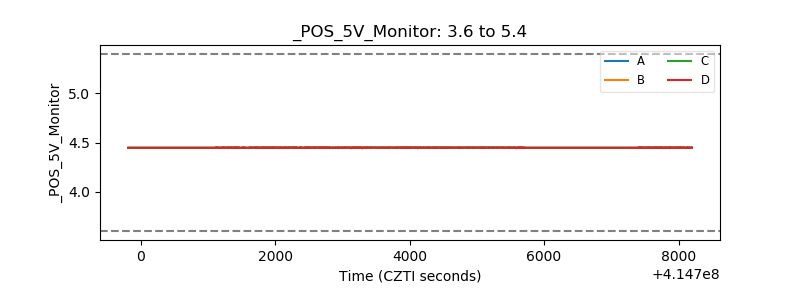 |
| _ROLL_ROT | 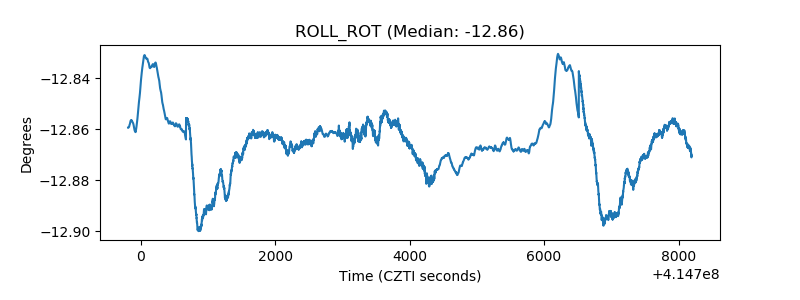 |
| _Roll_DEC | 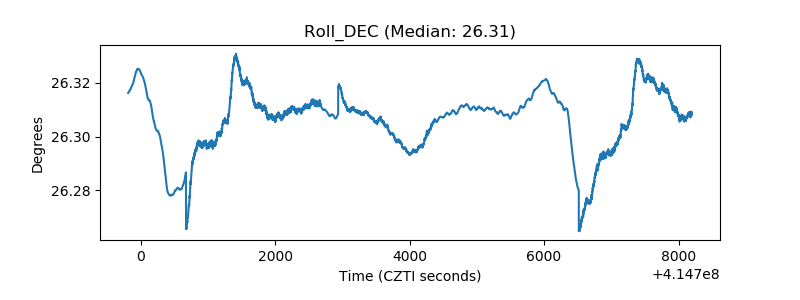 |
| _Roll_RA | 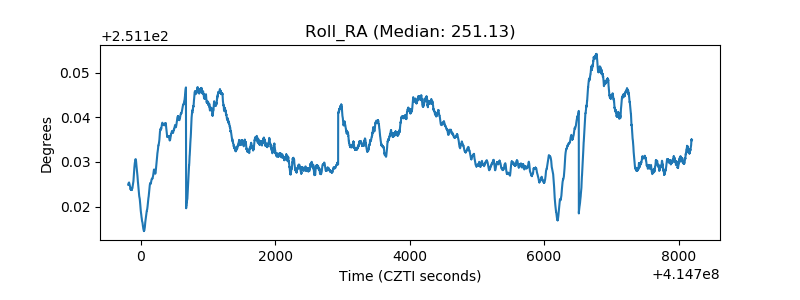 |
| Veto Counter | 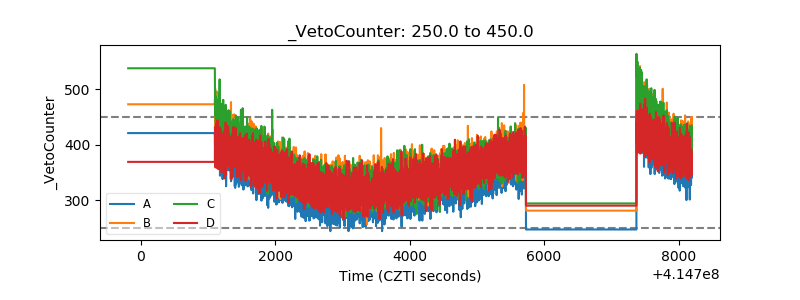 |