| Param | Original file | Final file |
|---|---|---|
| Filename | modeM0/AS1A12_054T03_9000005516_40023cztM0_level2.fits | modeM0/AS1A12_054T03_9000005516_40023cztM0_level2_quad_clean.evt |
| Size (bytes) | 314,078,400 | 89,533,440 |
| Size | 299.5 MB | 85.4 MB |
| Events in quadrant A | 2,862,032 | 595,958 |
| Events in quadrant B | 2,483,803 | 618,445 |
| Events in quadrant C | 2,541,541 | 595,901 |
| Events in quadrant D | 3,327,411 | 531,148 |
| Mode M9 | |||
|---|---|---|---|
| Quadrant | BADHDUFLAG | Total packets | Discarded packets |
| A | 0 | 24 | 0 |
| B | 0 | 24 | 0 |
| C | 0 | 24 | 0 |
| D | 0 | 25 | 0 |
| Mode SS | |||
|---|---|---|---|
| Quadrant | BADHDUFLAG | Total packets | Discarded packets |
| A | 0 | 108 | 0 |
| B | 0 | 108 | 0 |
| C | 0 | 108 | 0 |
| D | 0 | 108 | 0 |
| Mode M0 | |||
|---|---|---|---|
| Quadrant | BADHDUFLAG | Total packets | Discarded packets |
| A | 0 | 11925 | 3 |
| B | 0 | 11088 | 2 |
| C | 0 | 10931 | 2 |
| D | 0 | 13527 | 2 |
| Quadrant | Total seconds | Saturated seconds | Saturation percentage |
|---|---|---|---|
| A | 5277 | 25 | 0.473754% |
| B | 5277 | 31 | 0.587455% |
| C | 5277 | 21 | 0.397953% |
| D | 5277 | 205 | 3.884783% |
Noise dominated data is calculated using 1-second bins in cleaned event files. If a bin has >2000 counts, and if more than 50% of those come from <1% of pixels, then it is considered to be noise-dominated and hence unusable.
| Quadrant | # 1 sec bins | Bins with >0 counts | Bins with >2000 counts | High rate bins dominated by noise | Noise dominated (total time) | Noise dominated (detector-on time) | Marked lightcurve |
|---|---|---|---|---|---|---|---|
| A | 7070 | 5278 | 16 | 16 | 0.23% | 0.30% | 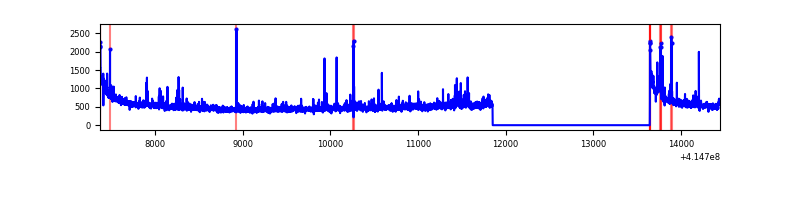 |
| B | 7070 | 5278 | 10 | 10 | 0.14% | 0.19% | 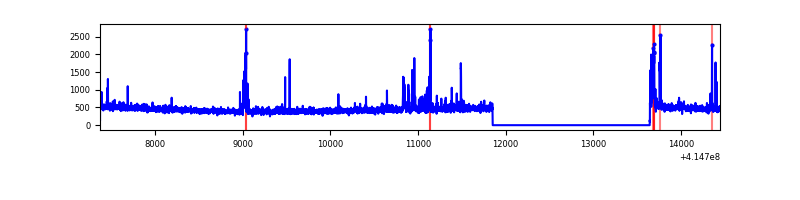 |
| C | 7070 | 5278 | 15 | 15 | 0.21% | 0.28% | 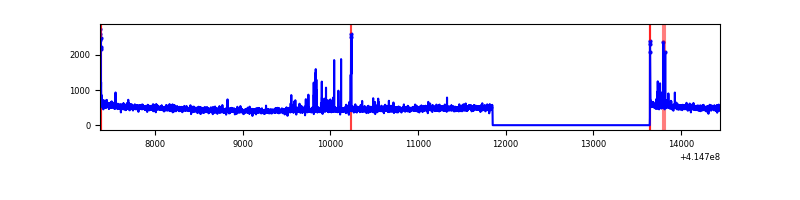 |
| D | 7070 | 5278 | 197 | 197 | 2.79% | 3.73% | 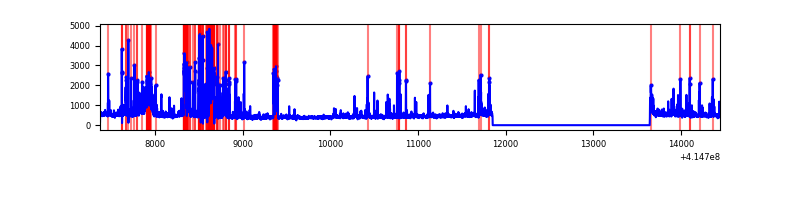 |
Top three noisy pixels from each quadrant. If the there are fewer than three noisy pixels in the level2.evt file, extra rows are filled as -1
| Pixel properties | Quadrant properties | ||||||
|---|---|---|---|---|---|---|---|
| Quadrant | DetID | PixID | Counts | Sigma | Mean | Median | Sigma |
| A | 10 | 83 | 438797 | 3702.88 | 577 | 565 | 118.3 |
| A | 12 | 189 | 67186 | 562.92 | 577 | 565 | 118.3 |
| A | 9 | 143 | 55314 | 462.61 | 577 | 565 | 118.3 |
| B | 4 | 171 | 188762 | 1660.2 | 579 | 563 | 113.4 |
| B | 12 | 111 | 13969 | 118.26 | 579 | 563 | 113.4 |
| B | 11 | 111 | 12900 | 108.83 | 579 | 563 | 113.4 |
| C | 15 | 214 | 219205 | 1634.65 | 570 | 575 | 133.7 |
| C | 14 | 254 | 62977 | 466.57 | 570 | 575 | 133.7 |
| C | 0 | 10 | 16682 | 120.43 | 570 | 575 | 133.7 |
| D | 12 | 227 | 582994 | 4289.3 | 554 | 542 | 135.8 |
| D | 13 | 249 | 286034 | 2102.42 | 554 | 542 | 135.8 |
| D | 2 | 250 | 174631 | 1282.03 | 554 | 542 | 135.8 |
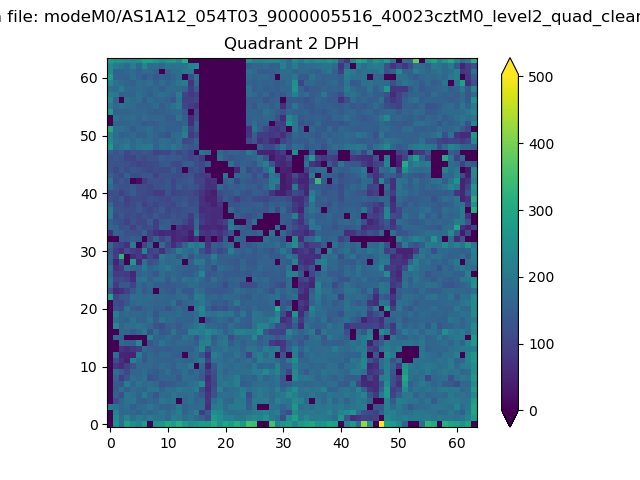
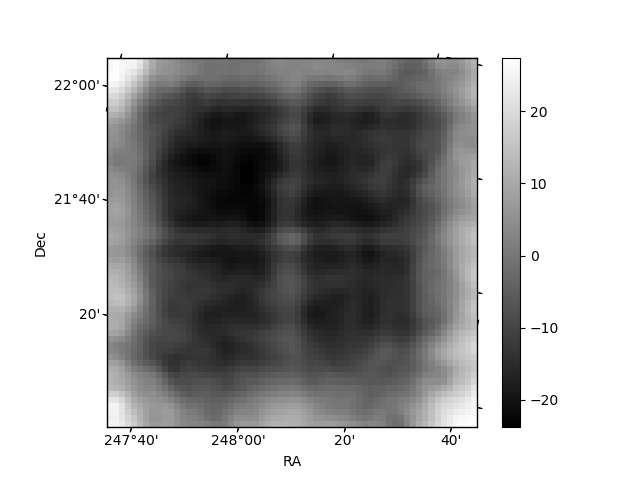
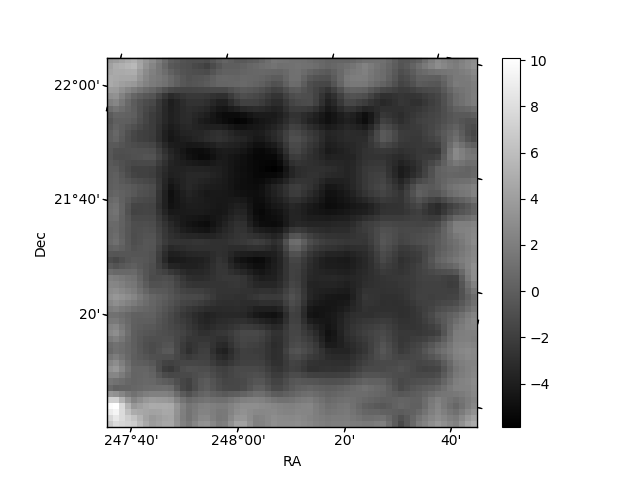
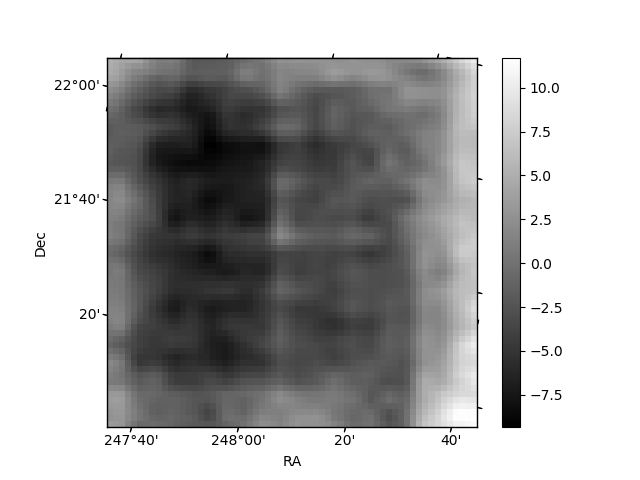
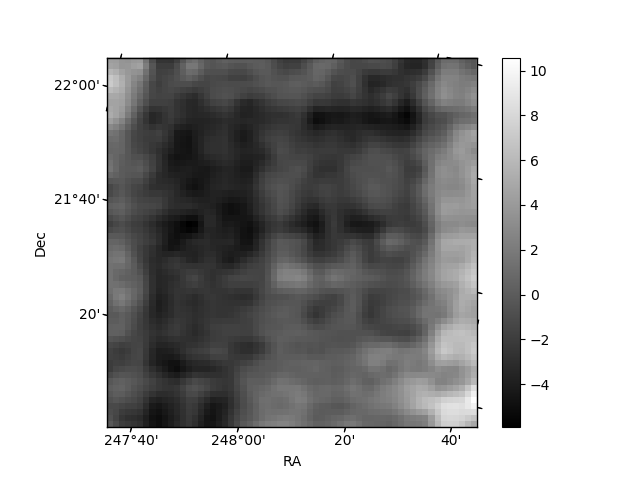
Histogram calculated using DETX and DETY for each event in the final _common_clean file
| Quadrant A | 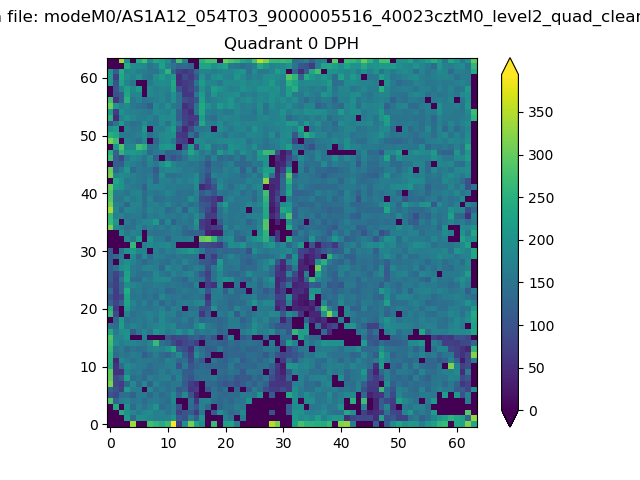 |
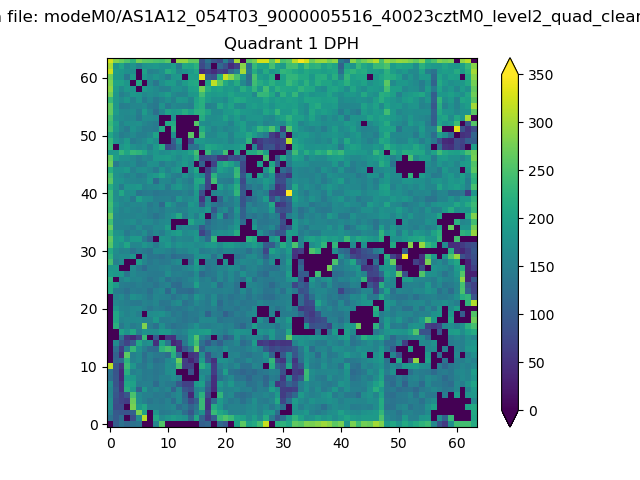 |
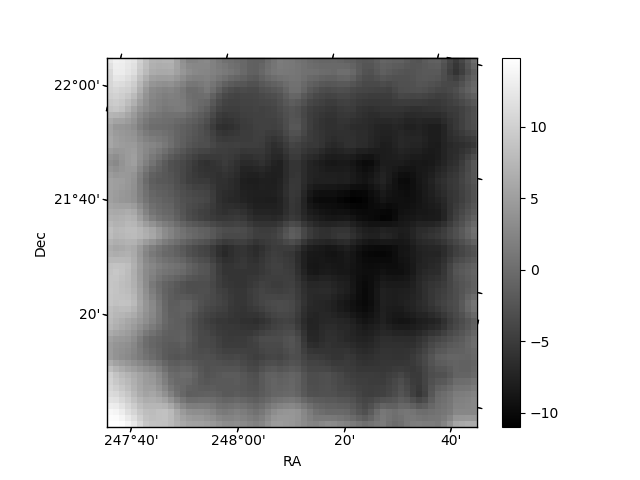
Quadrant B |
|---|---|---|---|
| Quadrant D | 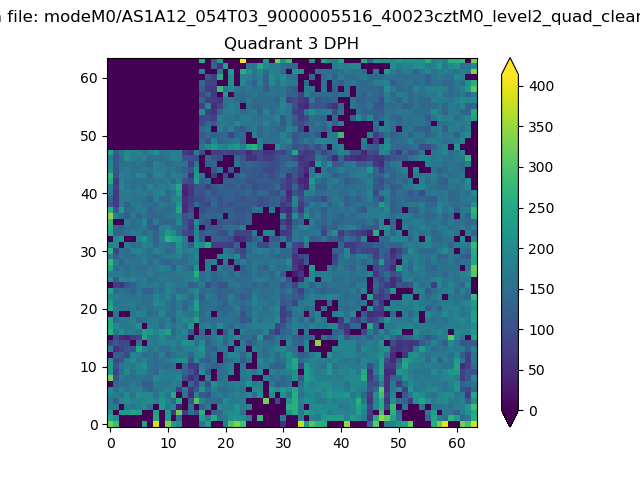 |
 |
Quadrant C |
| Plot type | Count rate plots | Images |
|---|---|---|
| Comparison with Poisson distribution Blue bars denote a histogram of data divided into 1 sec bins. Red curve is a Poisson curve with rate = median count rate of data. |
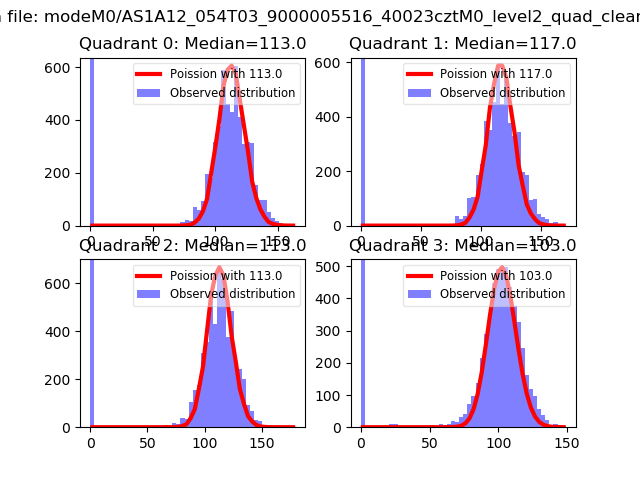 |
 |
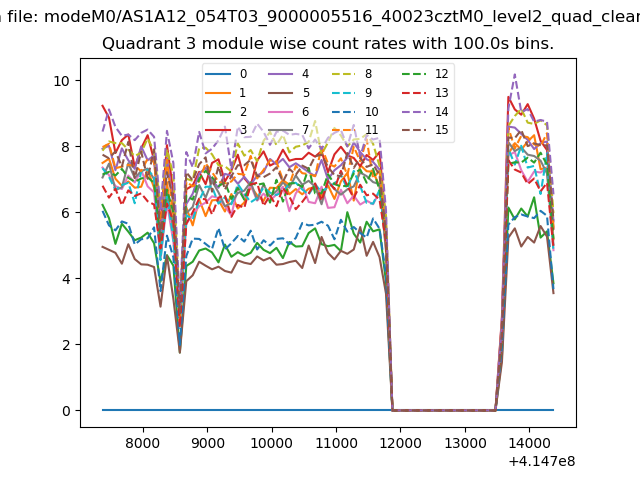
| Quadrant-wise count rates Data is divided into 100 sec bins |
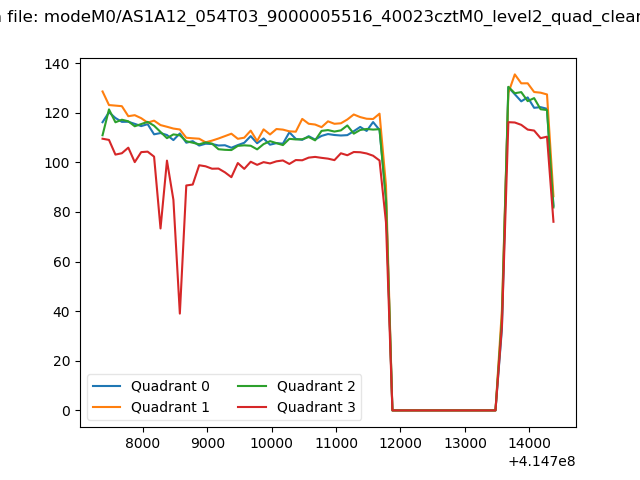 |
|
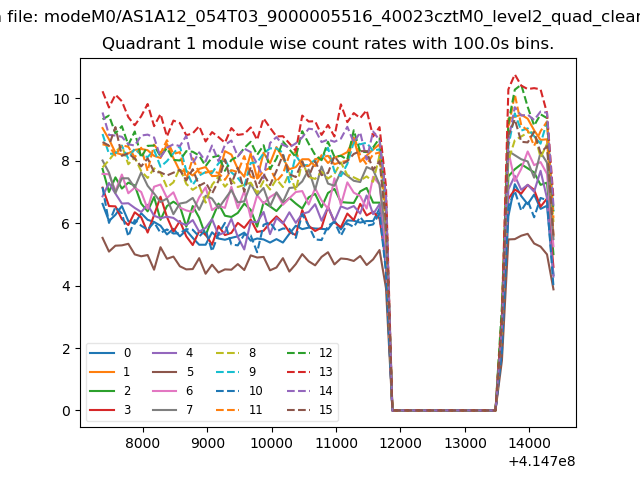
| Module-wise count rates for Quadrant A Data is divided into 100 sec bins |
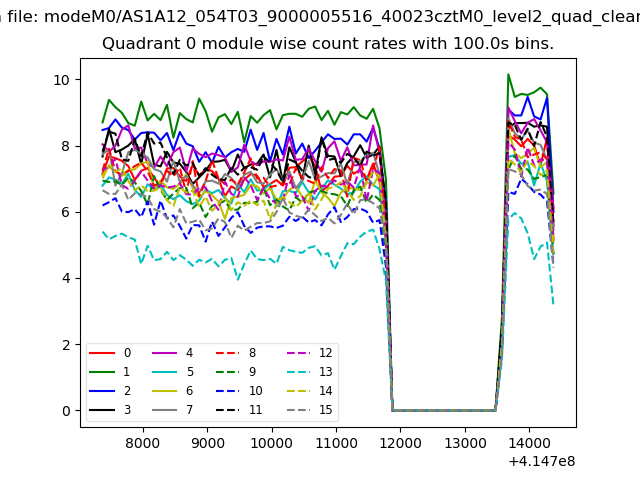 |
 |
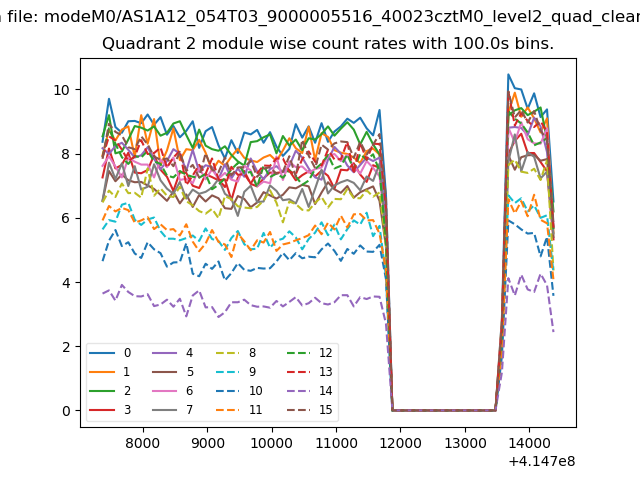
| Module-wise count rates for Quadrant B Data is divided into 100 sec bins |
 |
 |
| Module-wise count rates for Quadrant C Data is divided into 100 sec bins |
 |
 |
| Module-wise count rates for Quadrant D Data is divided into 100 sec bins |
 |
 |
| Parameter | Plot |
|---|---|
| CZT HV Monitor | 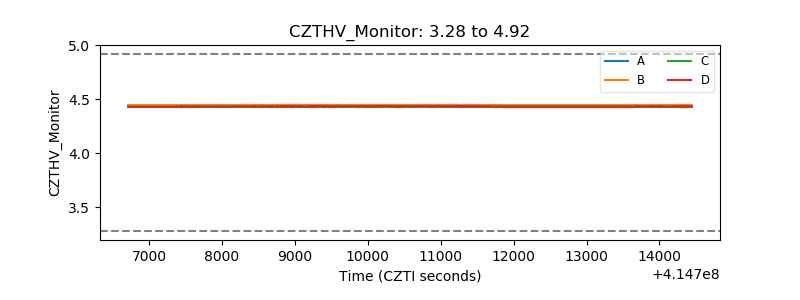 |
| D_VDD | 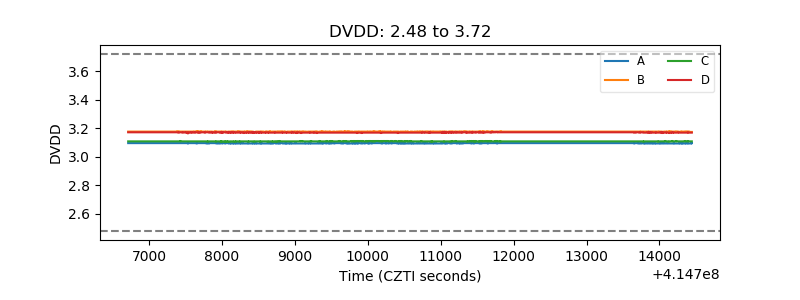 |
| Temperature 1 | 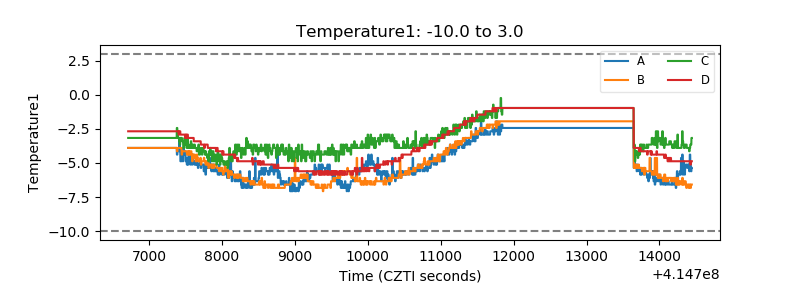 |
| Veto HV Monitor | 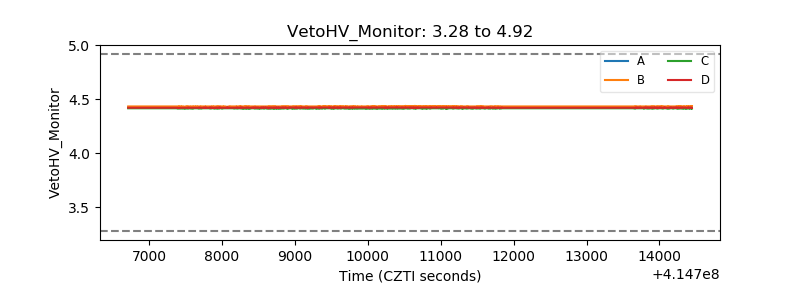 |
| Veto LLD | 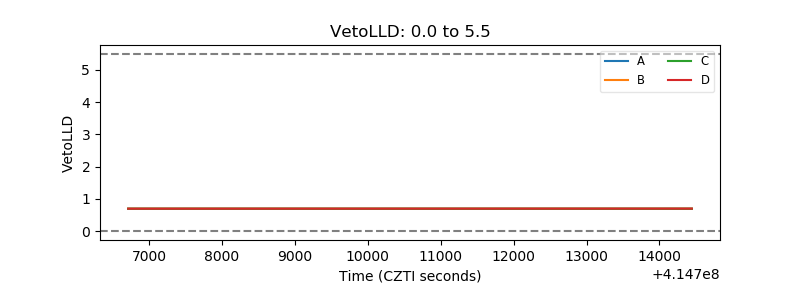 |
| Alpha Counter | 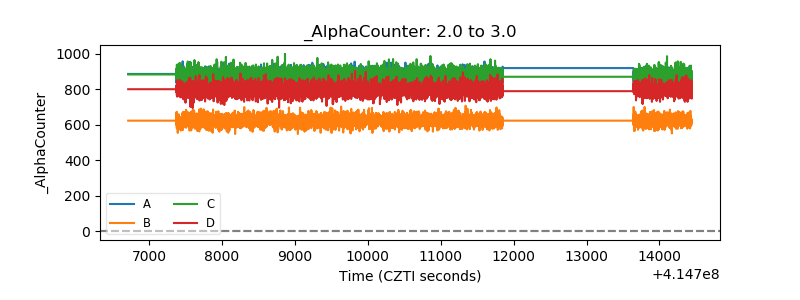 |
| _CPM_Rate | 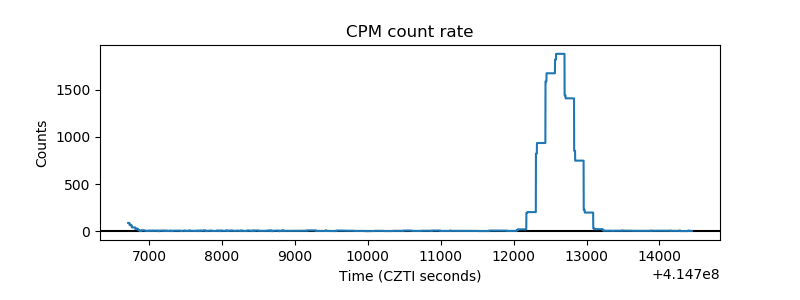 |
| CZT Counter | 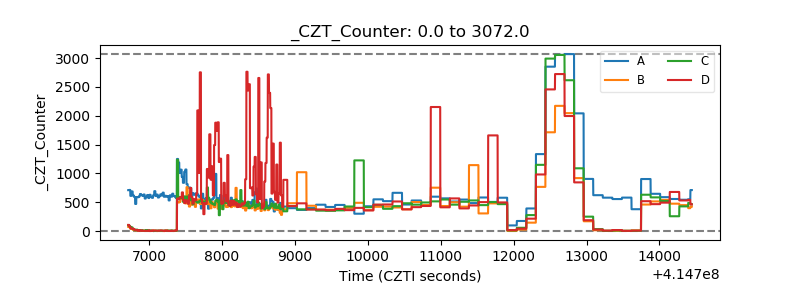 |
| +2.5 Volts monitor | 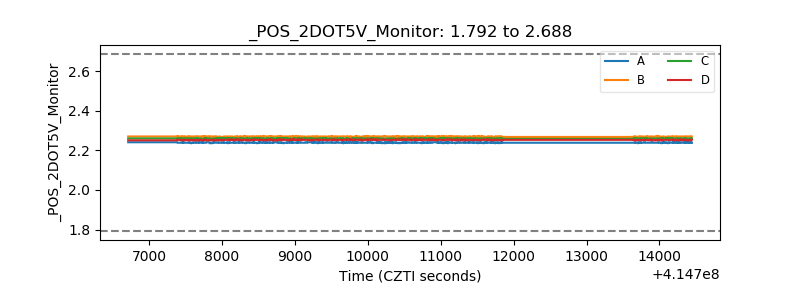 |
| +5 Volts monitor | 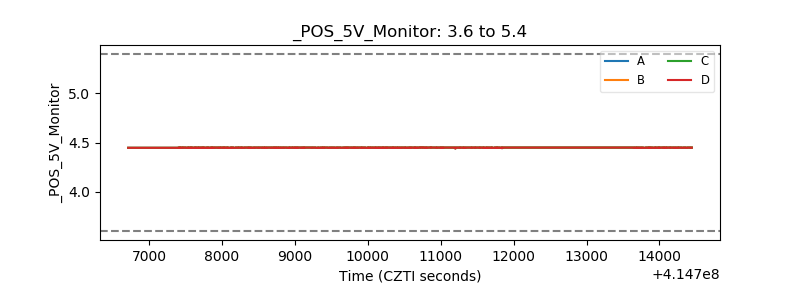 |
| _ROLL_ROT | 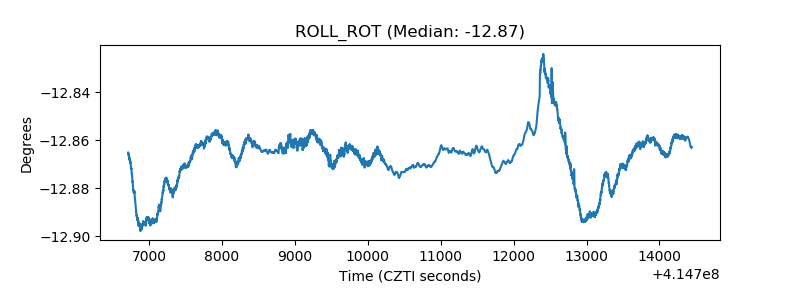 |
| _Roll_DEC | 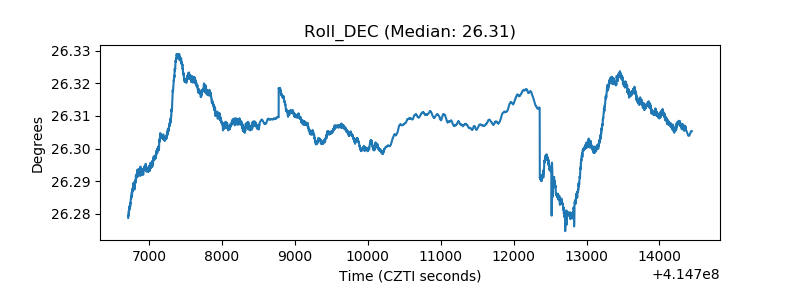 |
| _Roll_RA | 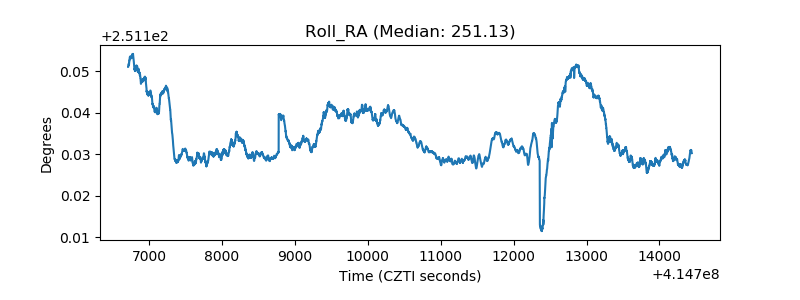 |
| Veto Counter | 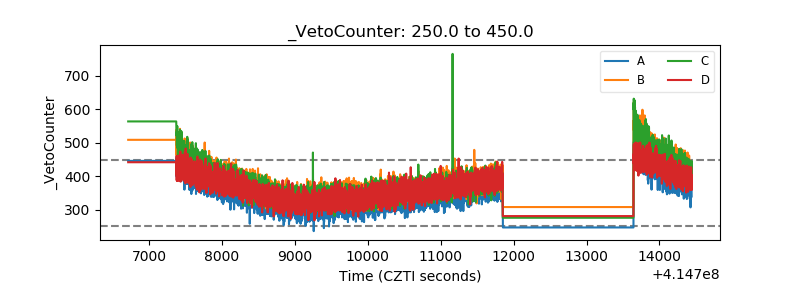 |