| Param | Original file | Final file |
|---|---|---|
| Filename | modeM0/AS1A12_054T03_9000005516_40024cztM0_level2.fits | modeM0/AS1A12_054T03_9000005516_40024cztM0_level2_quad_clean.evt |
| Size (bytes) | 361,454,400 | 96,658,560 |
| Size | 344.7 MB | 92.2 MB |
| Events in quadrant A | 3,299,815 | 650,700 |
| Events in quadrant B | 2,746,637 | 682,728 |
| Events in quadrant C | 3,602,289 | 618,128 |
| Events in quadrant D | 3,296,893 | 585,323 |
| Mode M9 | |||
|---|---|---|---|
| Quadrant | BADHDUFLAG | Total packets | Discarded packets |
| A | 0 | 37 | 0 |
| B | 0 | 37 | 0 |
| C | 0 | 37 | 0 |
| D | 0 | 37 | 0 |
| Mode SS | |||
|---|---|---|---|
| Quadrant | BADHDUFLAG | Total packets | Discarded packets |
| A | 0 | 116 | 0 |
| B | 0 | 116 | 0 |
| C | 0 | 116 | 0 |
| D | 0 | 116 | 0 |
| Mode M0 | |||
|---|---|---|---|
| Quadrant | BADHDUFLAG | Total packets | Discarded packets |
| A | 0 | 13403 | 3 |
| B | 0 | 11903 | 2 |
| C | 0 | 14077 | 2 |
| D | 0 | 13631 | 2 |
| Quadrant | Total seconds | Saturated seconds | Saturation percentage |
|---|---|---|---|
| A | 5575 | 56 | 1.004484% |
| B | 5575 | 44 | 0.789238% |
| C | 5575 | 344 | 6.170404% |
| D | 5575 | 135 | 2.421525% |
Noise dominated data is calculated using 1-second bins in cleaned event files. If a bin has >2000 counts, and if more than 50% of those come from <1% of pixels, then it is considered to be noise-dominated and hence unusable.
| Quadrant | # 1 sec bins | Bins with >0 counts | Bins with >2000 counts | High rate bins dominated by noise | Noise dominated (total time) | Noise dominated (detector-on time) | Marked lightcurve |
|---|---|---|---|---|---|---|---|
| A | 9251 | 5577 | 36 | 36 | 0.39% | 0.65% | 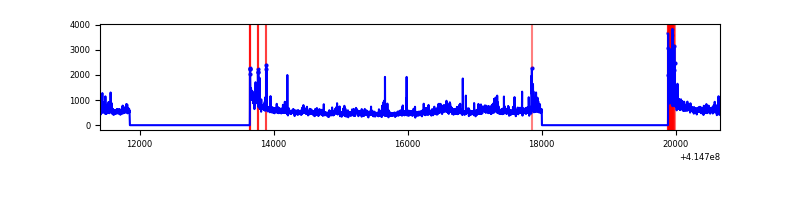 |
| B | 9251 | 5577 | 22 | 22 | 0.24% | 0.39% | 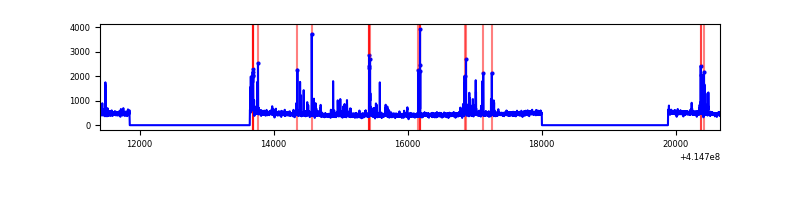 |
| C | 9251 | 5577 | 310 | 310 | 3.35% | 5.56% | 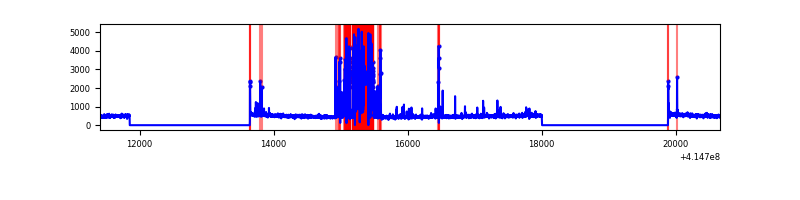 |
| D | 9251 | 5577 | 126 | 126 | 1.36% | 2.26% | 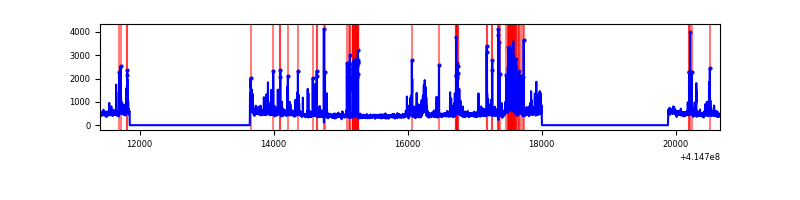 |
Top three noisy pixels from each quadrant. If the there are fewer than three noisy pixels in the level2.evt file, extra rows are filled as -1
| Pixel properties | Quadrant properties | ||||||
|---|---|---|---|---|---|---|---|
| Quadrant | DetID | PixID | Counts | Sigma | Mean | Median | Sigma |
| A | 10 | 83 | 448059 | 3556.81 | 621 | 610 | 125.8 |
| A | 12 | 189 | 248415 | 1969.82 | 621 | 610 | 125.8 |
| A | 13 | 248 | 131865 | 1043.36 | 621 | 610 | 125.8 |
| B | 4 | 171 | 272241 | 2275.48 | 625 | 607 | 119.4 |
| B | 12 | 111 | 15042 | 120.92 | 625 | 607 | 119.4 |
| B | 11 | 111 | 13731 | 109.94 | 625 | 607 | 119.4 |
| C | 14 | 254 | 1049298 | 7584.18 | 590 | 596 | 138.3 |
| C | 15 | 214 | 222134 | 1602.16 | 590 | 596 | 138.3 |
| C | 0 | 10 | 18043 | 126.18 | 590 | 596 | 138.3 |
| D | 12 | 227 | 353506 | 2379.91 | 603 | 586 | 148.3 |
| D | 13 | 249 | 198948 | 1337.65 | 603 | 586 | 148.3 |
| D | 2 | 250 | 197860 | 1330.31 | 603 | 586 | 148.3 |
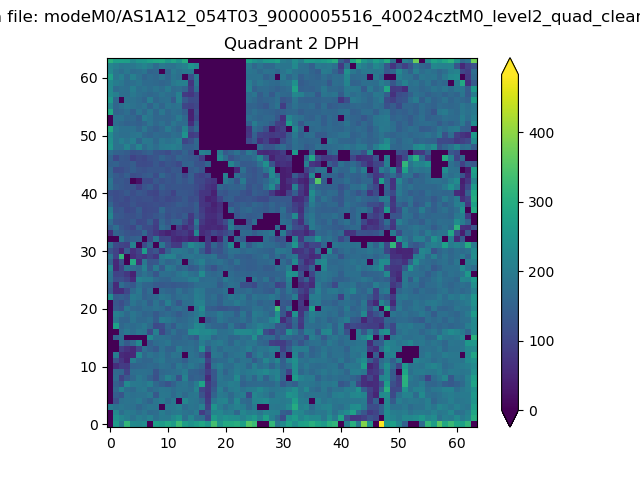
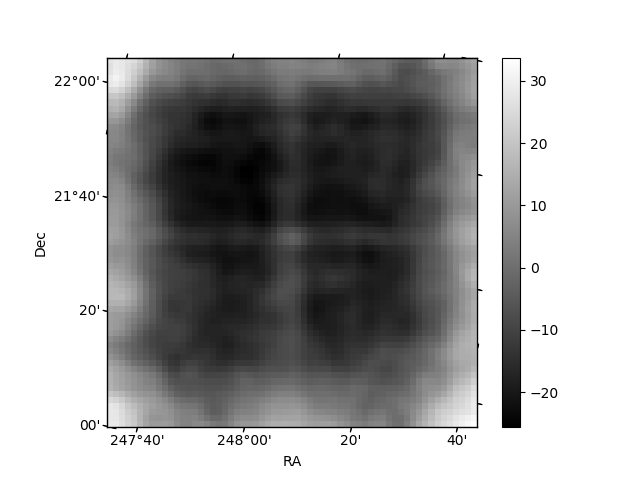
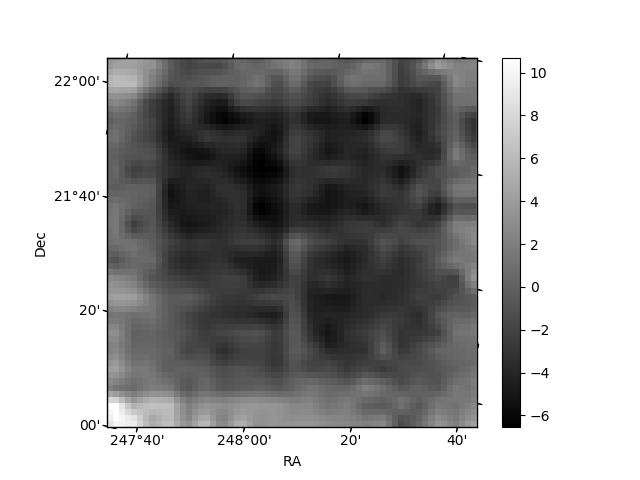
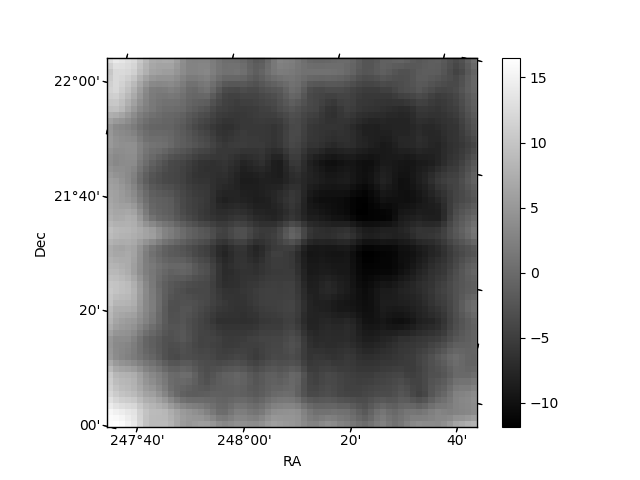
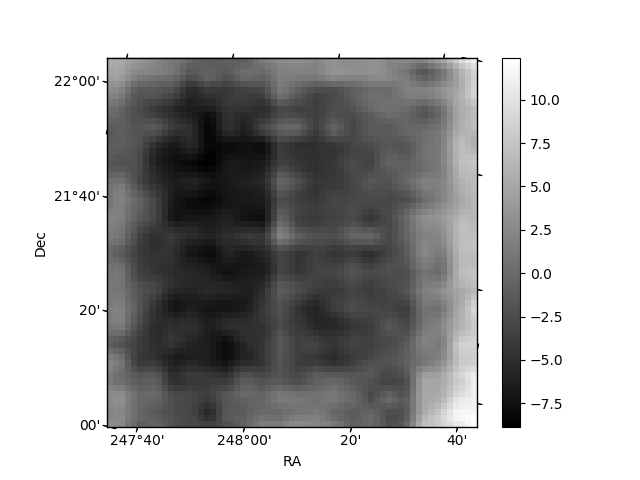
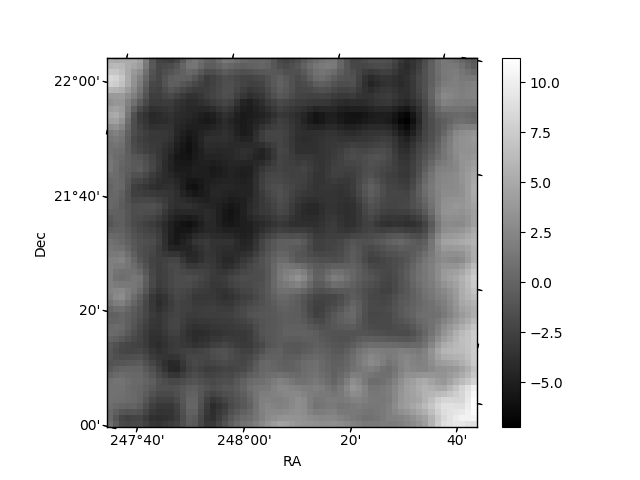
Histogram calculated using DETX and DETY for each event in the final _common_clean file
| Quadrant A | 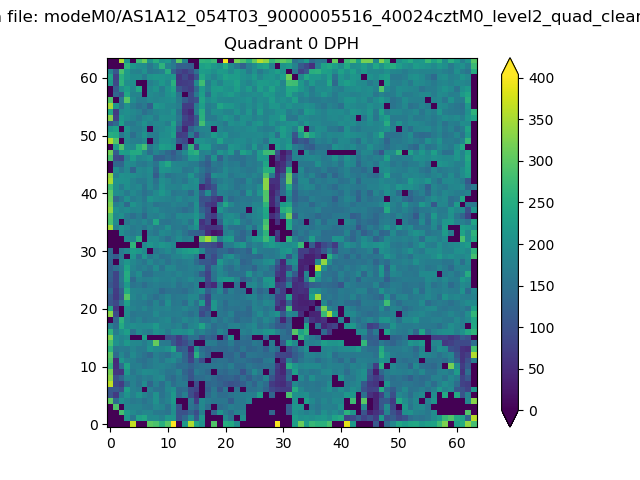 |
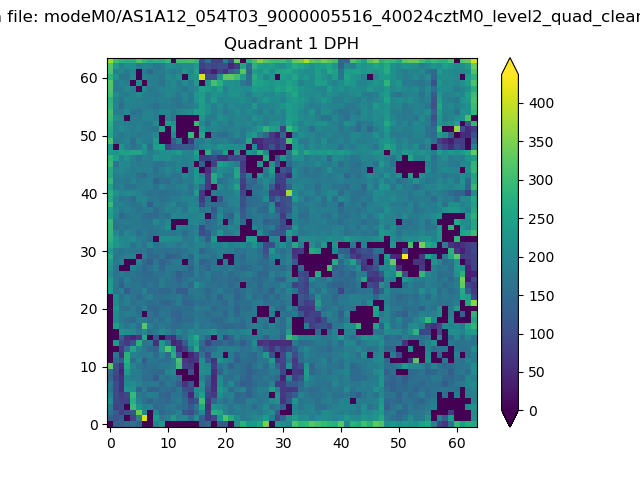 |
Quadrant B |
|---|---|---|---|
| Quadrant D | 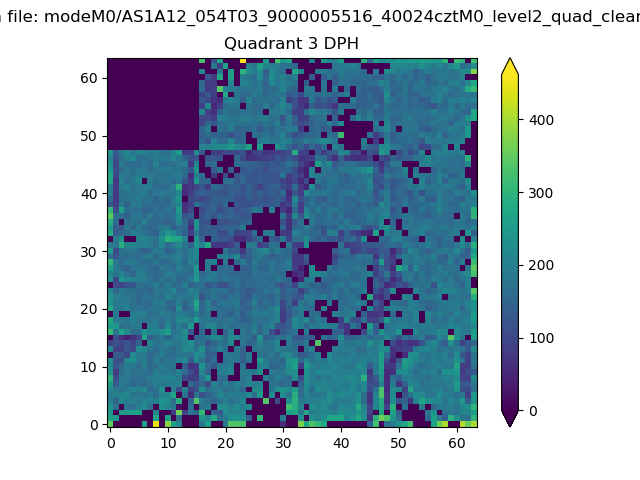 |
 |
Quadrant C |
| Plot type | Count rate plots | Images |
|---|---|---|
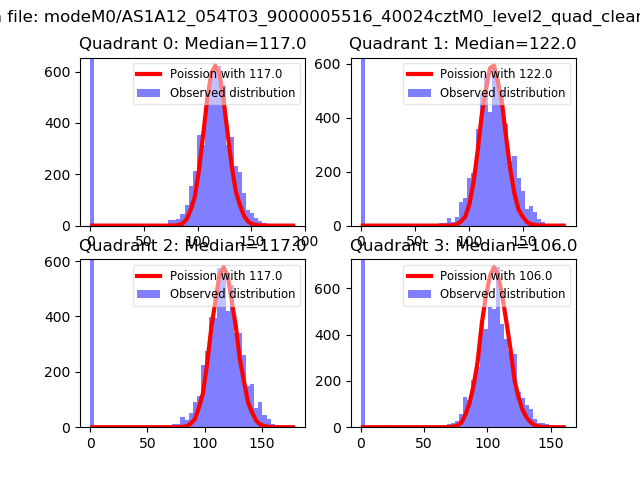
| Comparison with Poisson distribution Blue bars denote a histogram of data divided into 1 sec bins. Red curve is a Poisson curve with rate = median count rate of data. |
 |
 |
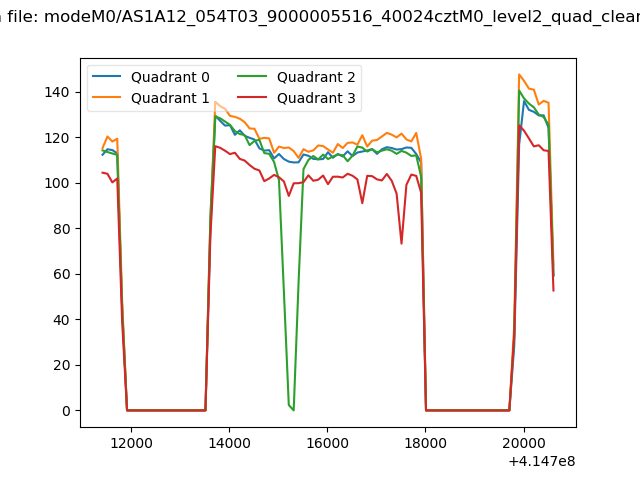
| Quadrant-wise count rates Data is divided into 100 sec bins |
 |
|
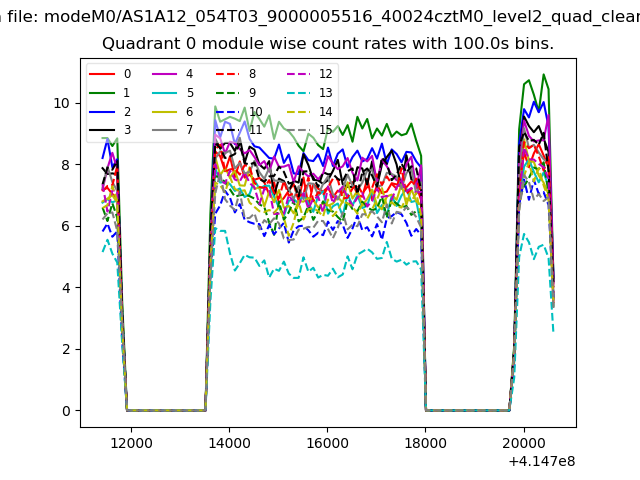
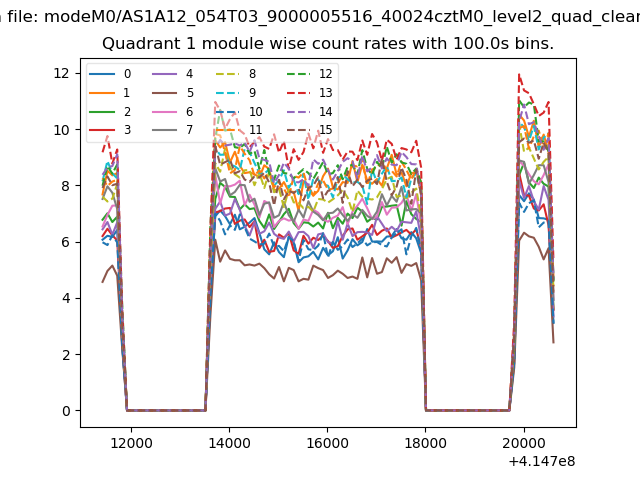
| Module-wise count rates for Quadrant A Data is divided into 100 sec bins |
 |
 |
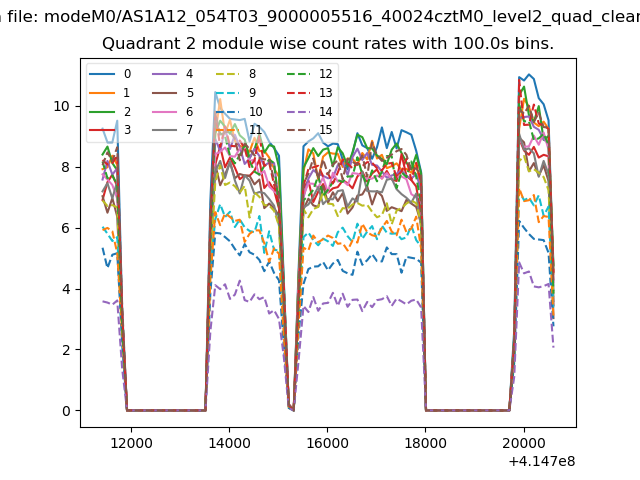
| Module-wise count rates for Quadrant B Data is divided into 100 sec bins |
 |
 |
| Module-wise count rates for Quadrant C Data is divided into 100 sec bins |
 |
 |
| Module-wise count rates for Quadrant D Data is divided into 100 sec bins |
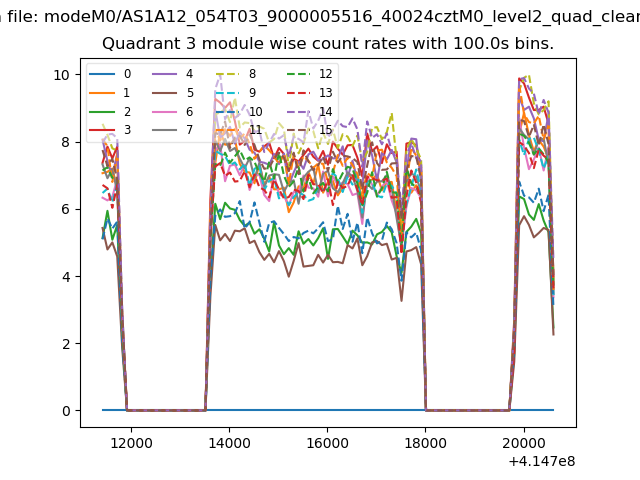 |
 |
| Parameter | Plot |
|---|---|
| CZT HV Monitor | 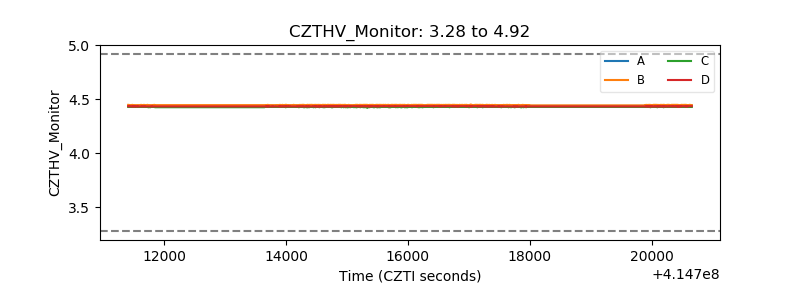 |
| D_VDD | 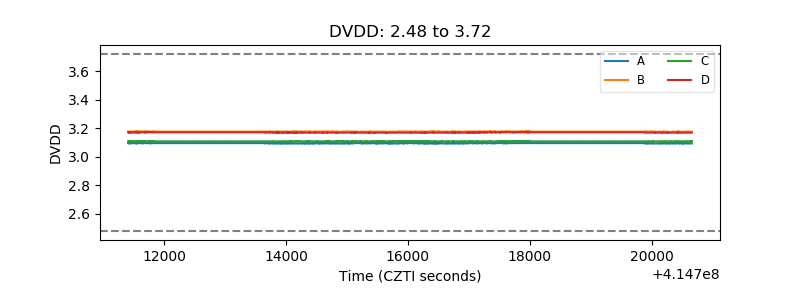 |
| Temperature 1 | 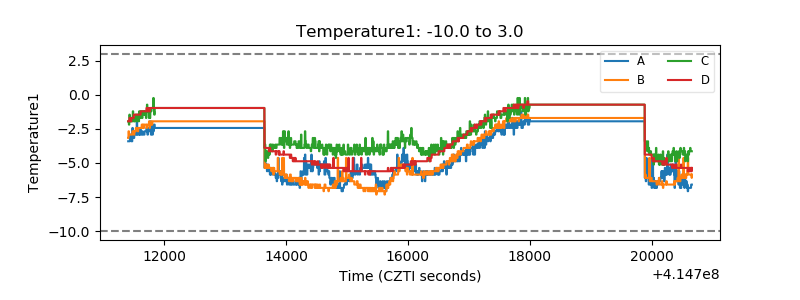 |
| Veto HV Monitor | 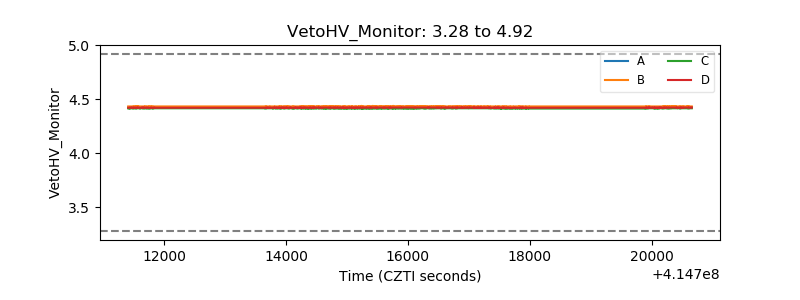 |
| Veto LLD | 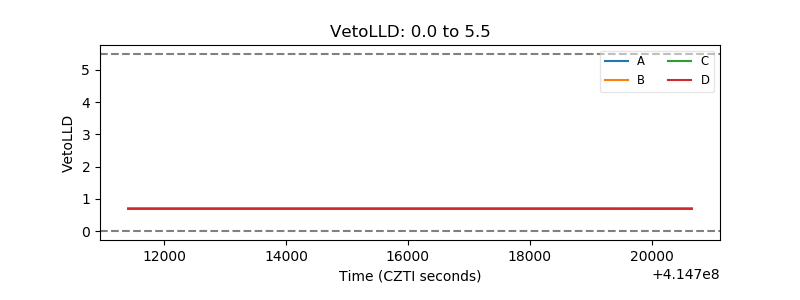 |
| Alpha Counter | 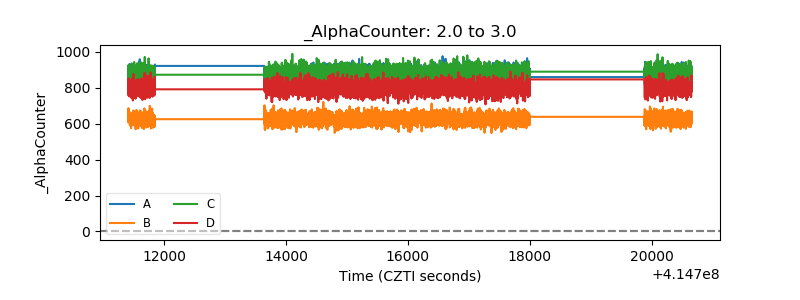 |
| _CPM_Rate | 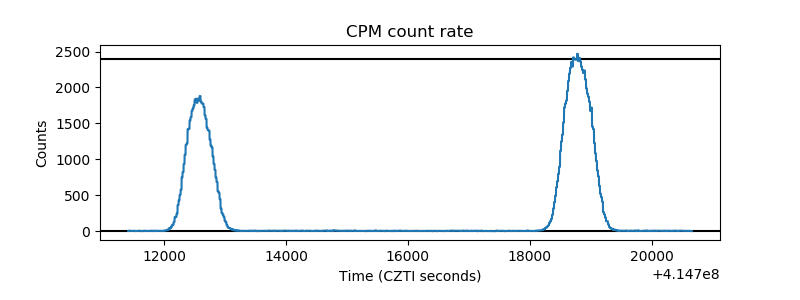 |
| CZT Counter | 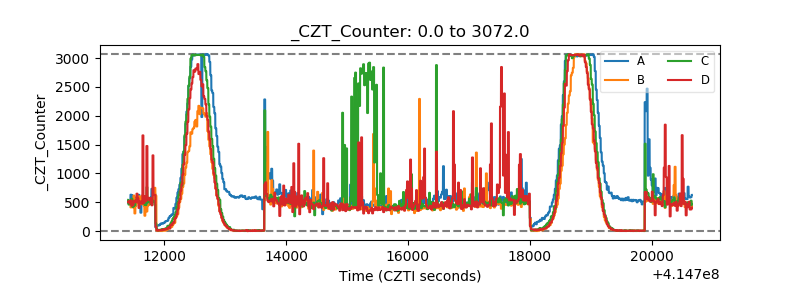 |
| +2.5 Volts monitor | 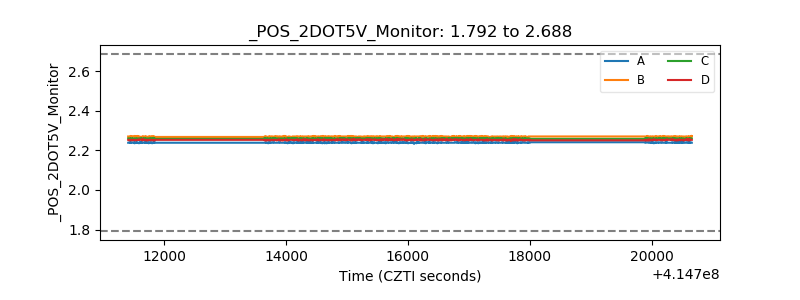 |
| +5 Volts monitor | 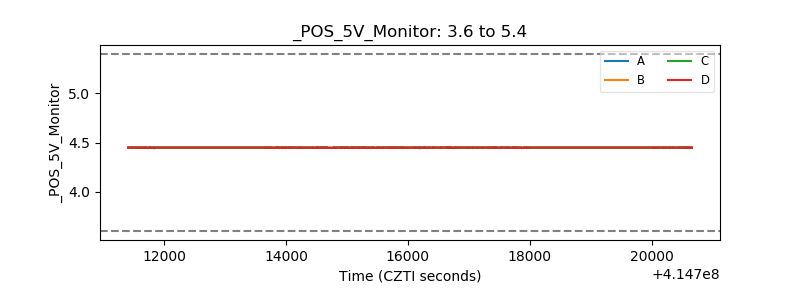 |
| _ROLL_ROT | 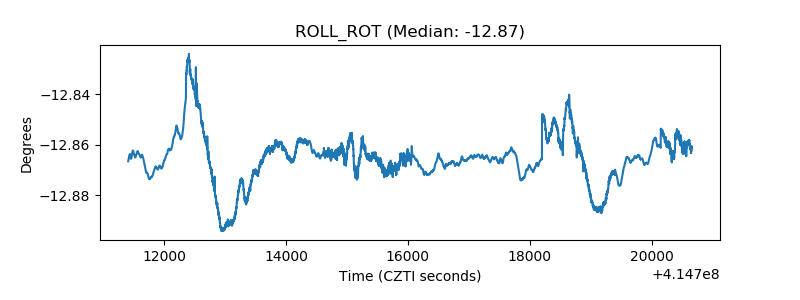 |
| _Roll_DEC | 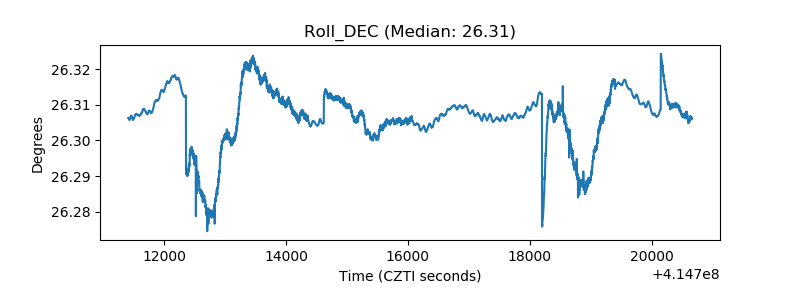 |
| _Roll_RA | 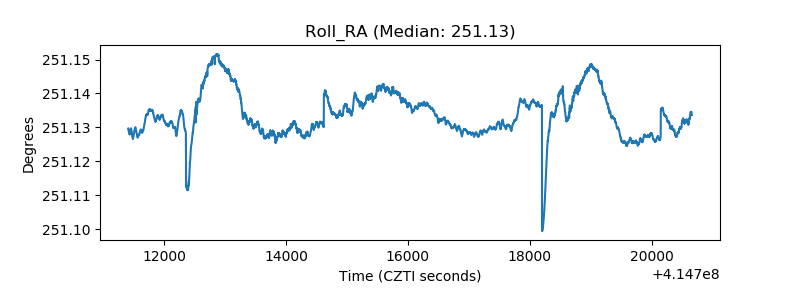 |
| Veto Counter | 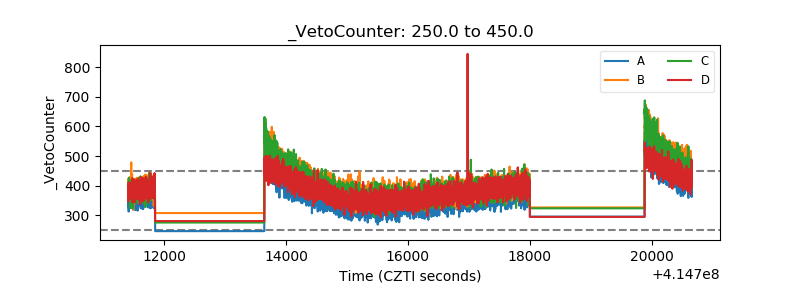 |