| Param | Original file | Final file |
|---|---|---|
| Filename | modeM0/AS1A12_054T03_9000005516_40025cztM0_level2.fits | modeM0/AS1A12_054T03_9000005516_40025cztM0_level2_quad_clean.evt |
| Size (bytes) | 327,441,600 | 94,656,960 |
| Size | 312.3 MB | 90.3 MB |
| Events in quadrant A | 3,283,812 | 638,604 |
| Events in quadrant B | 3,094,928 | 651,844 |
| Events in quadrant C | 2,631,657 | 635,474 |
| Events in quadrant D | 2,700,755 | 572,349 |
| Mode M9 | |||
|---|---|---|---|
| Quadrant | BADHDUFLAG | Total packets | Discarded packets |
| A | 0 | 39 | 0 |
| B | 0 | 39 | 0 |
| C | 0 | 39 | 0 |
| D | 0 | 39 | 0 |
| Mode SS | |||
|---|---|---|---|
| Quadrant | BADHDUFLAG | Total packets | Discarded packets |
| A | 0 | 108 | 0 |
| B | 0 | 108 | 0 |
| C | 0 | 108 | 0 |
| D | 0 | 108 | 0 |
| Mode M0 | |||
|---|---|---|---|
| Quadrant | BADHDUFLAG | Total packets | Discarded packets |
| A | 0 | 13192 | 3 |
| B | 0 | 12571 | 2 |
| C | 0 | 10972 | 2 |
| D | 0 | 11713 | 2 |
| Quadrant | Total seconds | Saturated seconds | Saturation percentage |
|---|---|---|---|
| A | 5259 | 71 | 1.350067% |
| B | 5259 | 218 | 4.145275% |
| C | 5259 | 23 | 0.437346% |
| D | 5259 | 30 | 0.570451% |
Noise dominated data is calculated using 1-second bins in cleaned event files. If a bin has >2000 counts, and if more than 50% of those come from <1% of pixels, then it is considered to be noise-dominated and hence unusable.
| Quadrant | # 1 sec bins | Bins with >0 counts | Bins with >2000 counts | High rate bins dominated by noise | Noise dominated (total time) | Noise dominated (detector-on time) | Marked lightcurve |
|---|---|---|---|---|---|---|---|
| A | 9144 | 5261 | 44 | 44 | 0.48% | 0.84% | 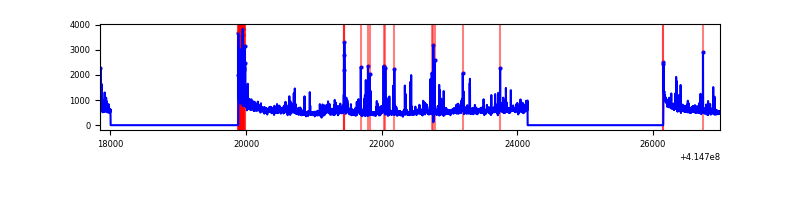 |
| B | 9144 | 5261 | 166 | 166 | 1.82% | 3.16% | 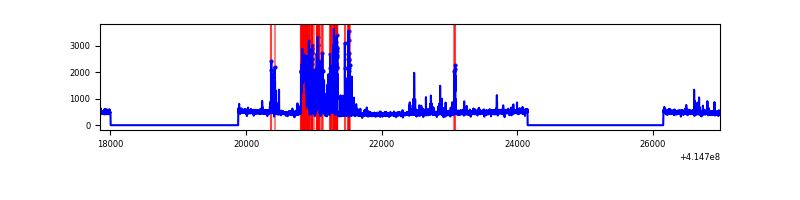 |
| C | 9144 | 5261 | 16 | 16 | 0.17% | 0.30% | 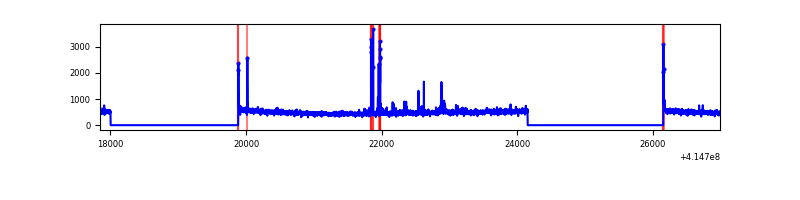 |
| D | 9144 | 5261 | 28 | 28 | 0.31% | 0.53% |  |
Top three noisy pixels from each quadrant. If the there are fewer than three noisy pixels in the level2.evt file, extra rows are filled as -1
| Pixel properties | Quadrant properties | ||||||
|---|---|---|---|---|---|---|---|
| Quadrant | DetID | PixID | Counts | Sigma | Mean | Median | Sigma |
| A | 10 | 83 | 439169 | 3620.22 | 595 | 584 | 121.1 |
| A | 12 | 189 | 293560 | 2418.32 | 595 | 584 | 121.1 |
| A | 13 | 248 | 119670 | 982.97 | 595 | 584 | 121.1 |
| B | 4 | 171 | 742370 | 6553.12 | 594 | 580 | 113.2 |
| B | 12 | 111 | 13594 | 114.97 | 594 | 580 | 113.2 |
| B | 11 | 111 | 12807 | 108.02 | 594 | 580 | 113.2 |
| C | 15 | 214 | 218690 | 1614.15 | 587 | 591 | 135.1 |
| C | 14 | 254 | 92230 | 678.22 | 587 | 591 | 135.1 |
| C | 0 | 10 | 23104 | 166.62 | 587 | 591 | 135.1 |
| D | 2 | 31 | 120900 | 849.36 | 575 | 558 | 141.7 |
| D | 12 | 227 | 118219 | 830.44 | 575 | 558 | 141.7 |
| D | 13 | 249 | 116902 | 821.14 | 575 | 558 | 141.7 |
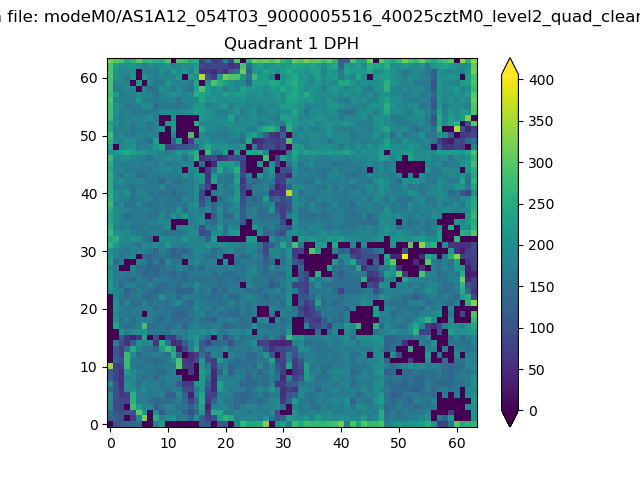
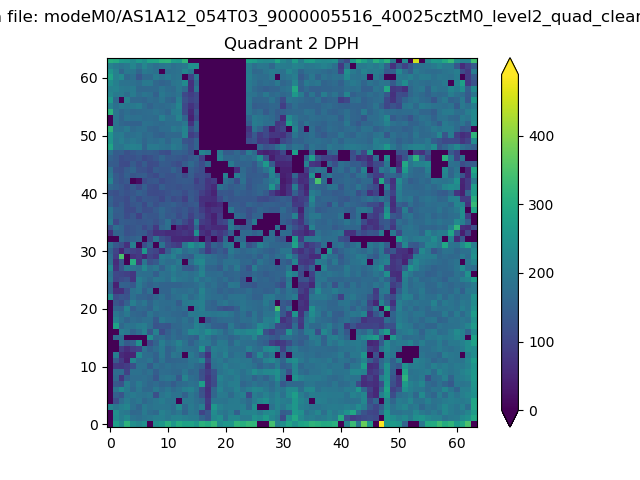
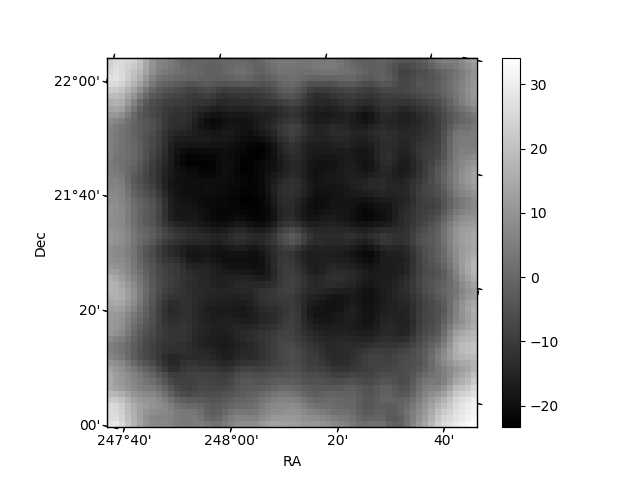
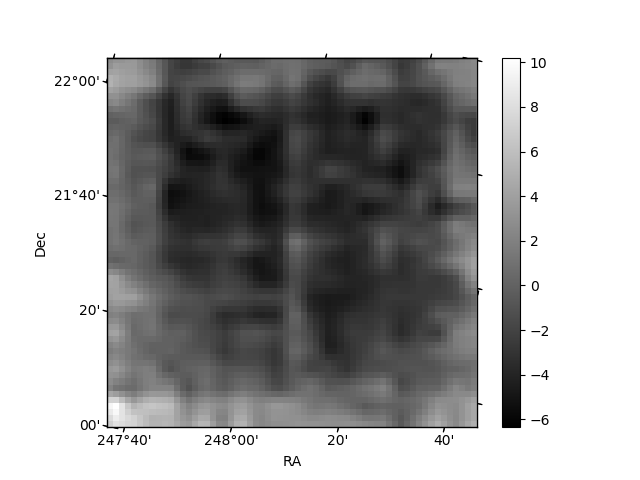
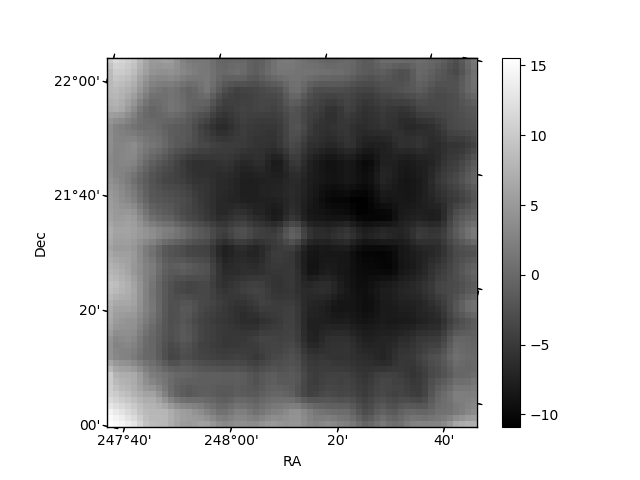
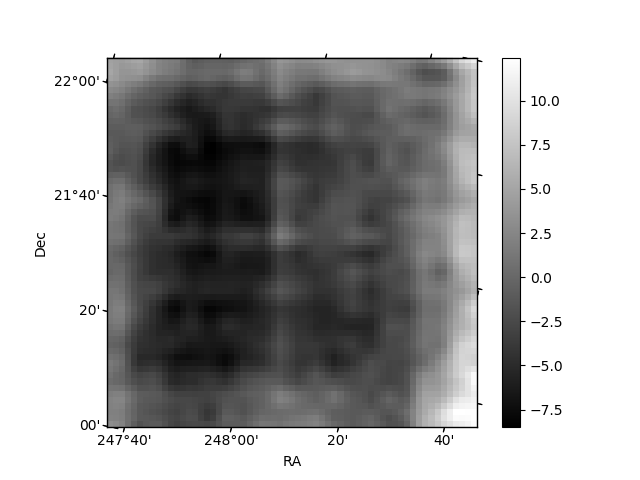
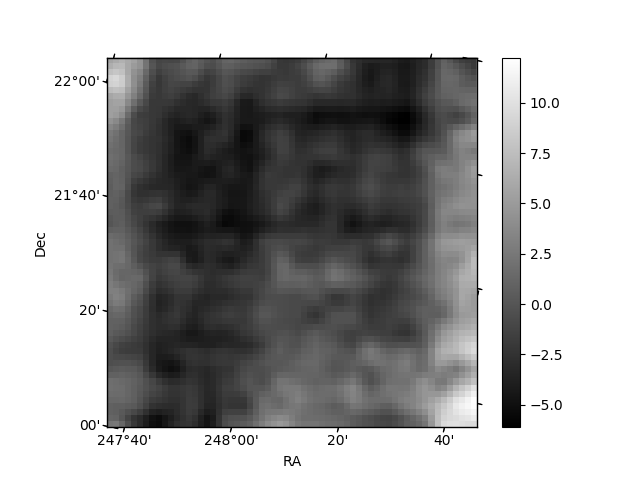
Histogram calculated using DETX and DETY for each event in the final _common_clean file
| Quadrant A | 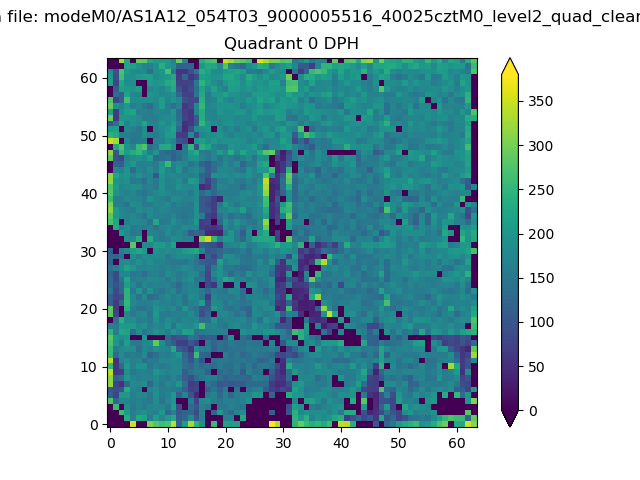 |
 |
Quadrant B |
|---|---|---|---|
| Quadrant D | 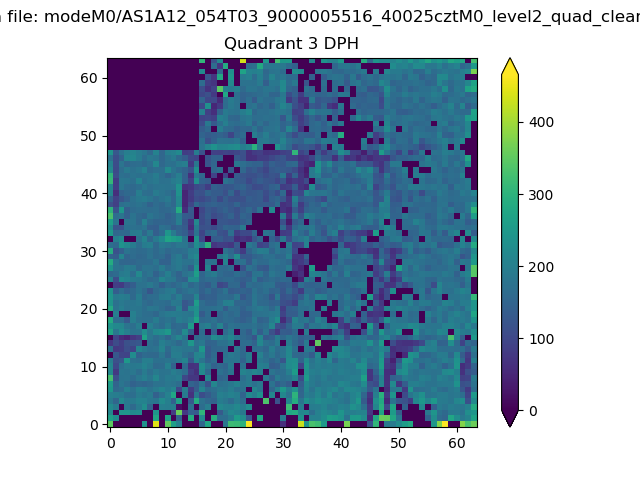 |
 |
Quadrant C |
| Plot type | Count rate plots | Images |
|---|---|---|
| Comparison with Poisson distribution Blue bars denote a histogram of data divided into 1 sec bins. Red curve is a Poisson curve with rate = median count rate of data. |
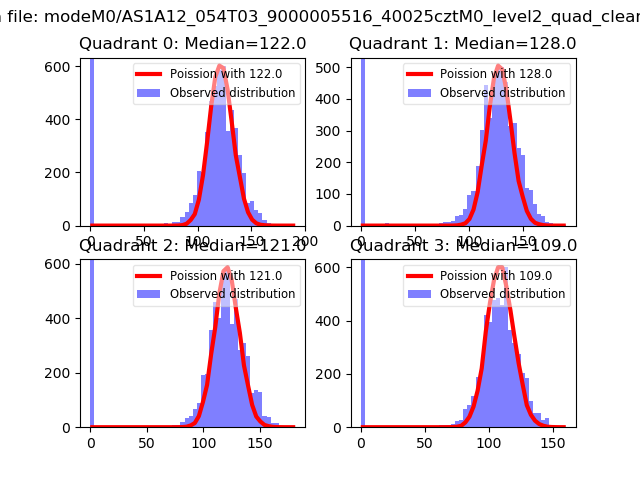 |
 |
| Quadrant-wise count rates Data is divided into 100 sec bins |
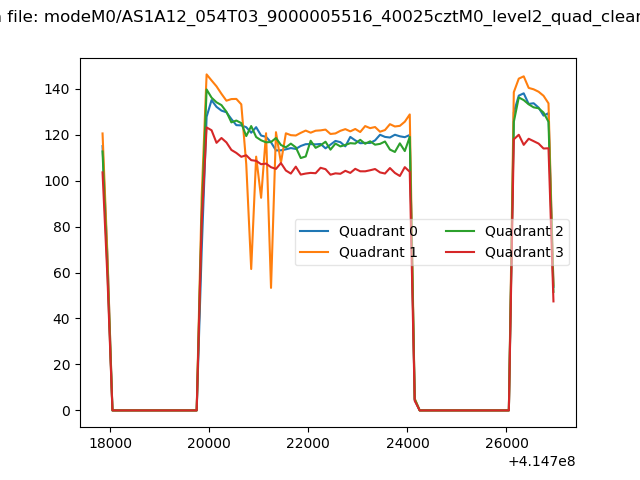 |
|
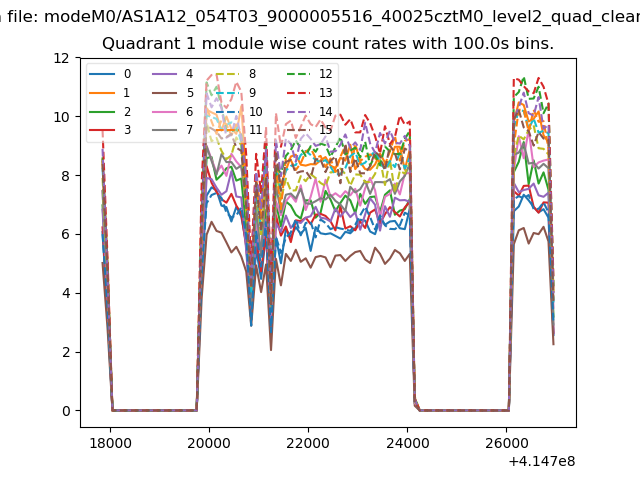
| Module-wise count rates for Quadrant A Data is divided into 100 sec bins |
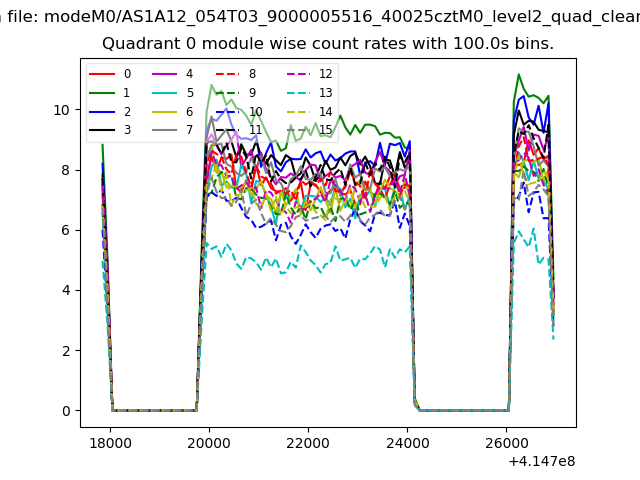 |
 |
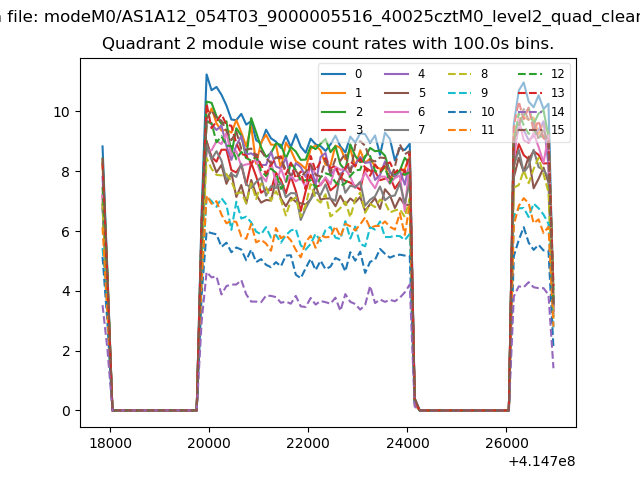
| Module-wise count rates for Quadrant B Data is divided into 100 sec bins |
 |
 |
| Module-wise count rates for Quadrant C Data is divided into 100 sec bins |
 |
 |
| Module-wise count rates for Quadrant D Data is divided into 100 sec bins |
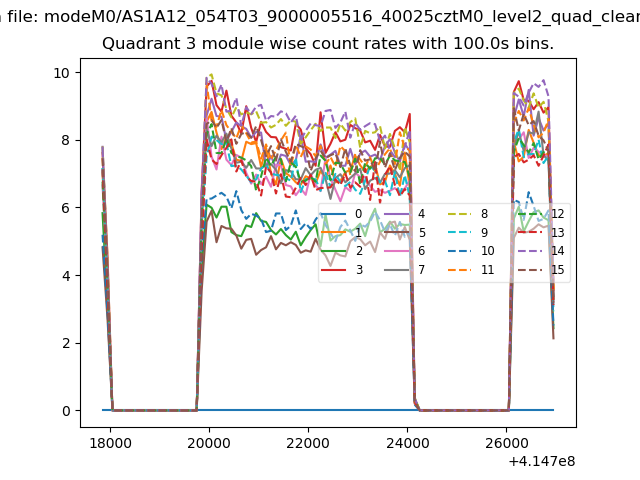 |
 |
| Parameter | Plot |
|---|---|
| CZT HV Monitor | 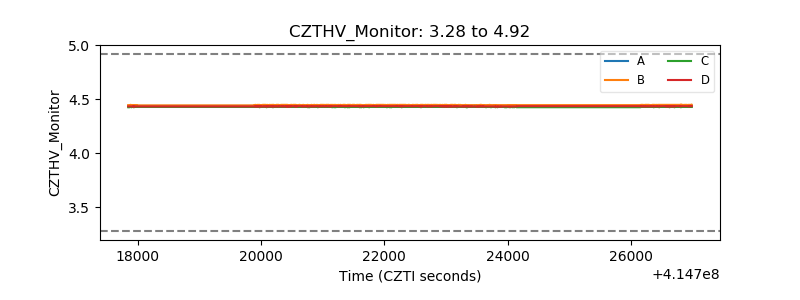 |
| D_VDD | 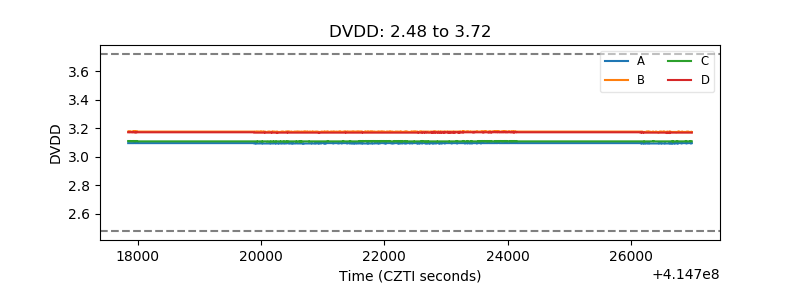 |
| Temperature 1 | 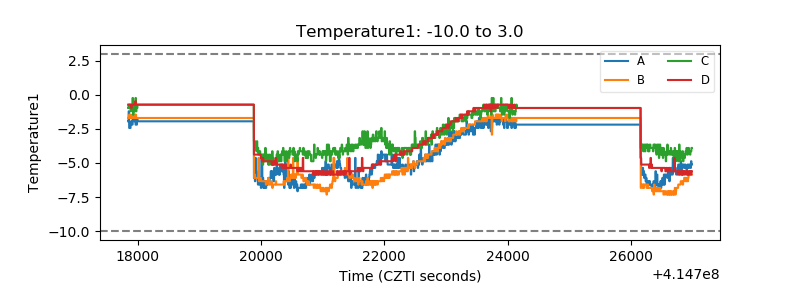 |
| Veto HV Monitor | 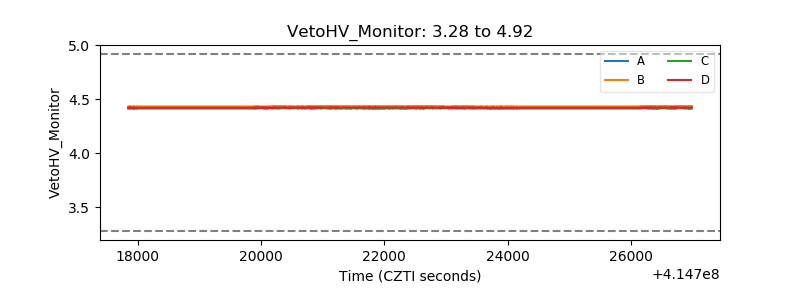 |
| Veto LLD | 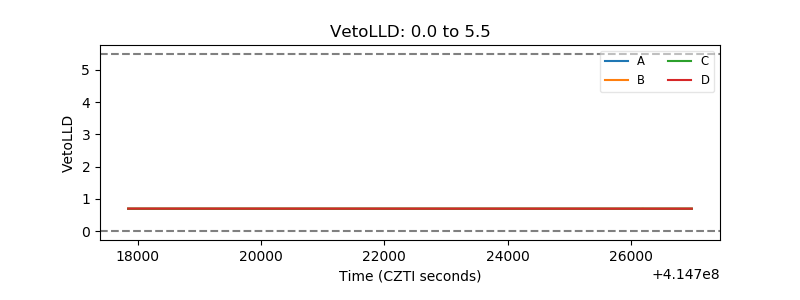 |
| Alpha Counter | 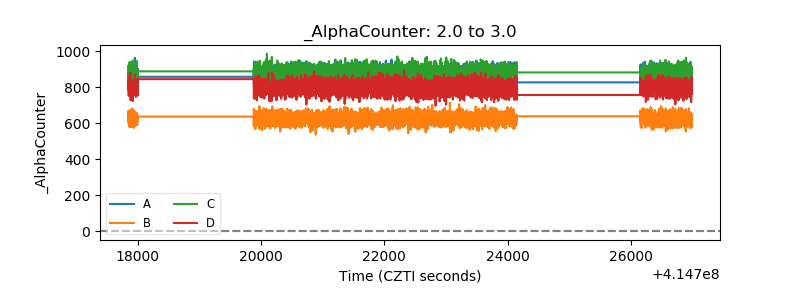 |
| _CPM_Rate | 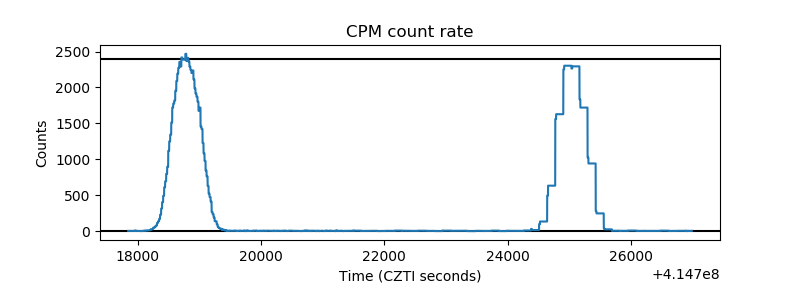 |
| CZT Counter | 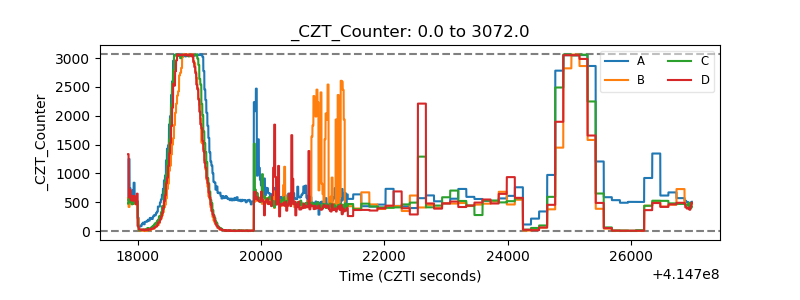 |
| +2.5 Volts monitor | 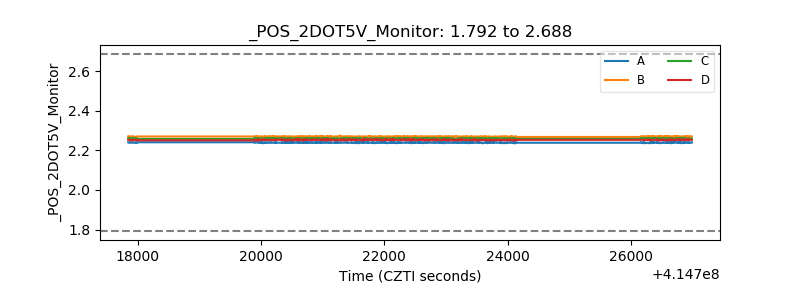 |
| +5 Volts monitor | 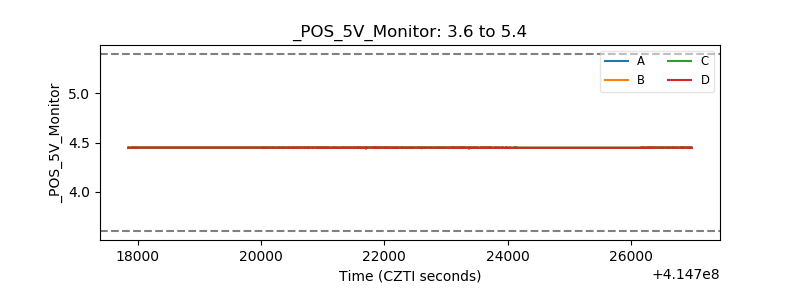 |
| _ROLL_ROT | 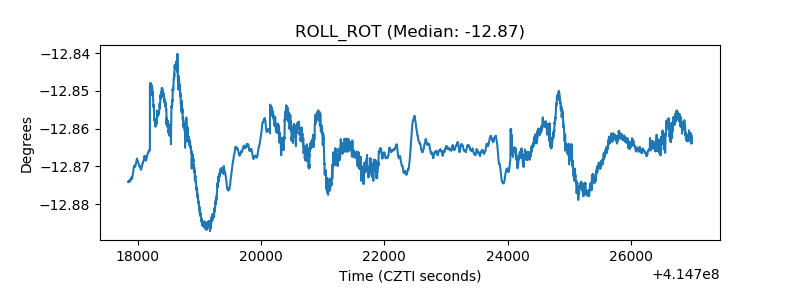 |
| _Roll_DEC | 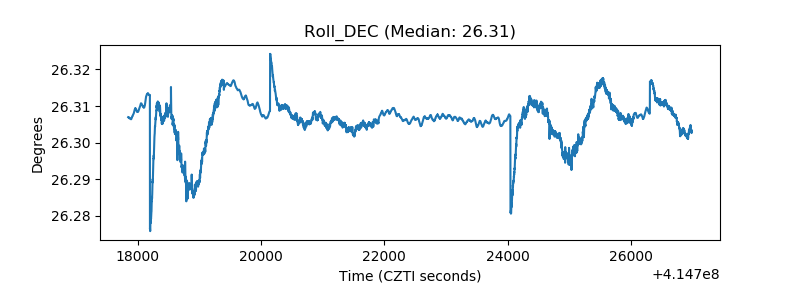 |
| _Roll_RA | 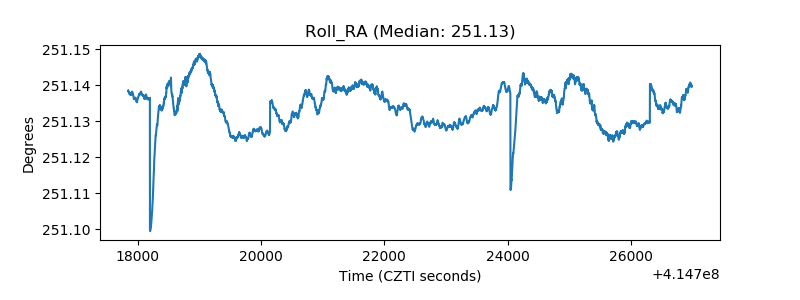 |
| Veto Counter | 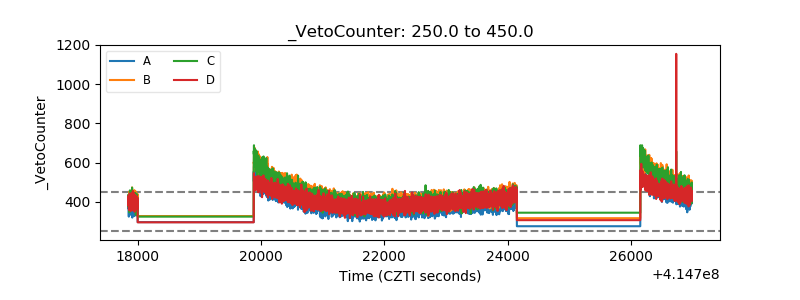 |