| Param | Original file | Final file |
|---|---|---|
| Filename | modeM0/AS1A12_054T03_9000005516_40026cztM0_level2.fits | modeM0/AS1A12_054T03_9000005516_40026cztM0_level2_quad_clean.evt |
| Size (bytes) | 299,505,600 | 96,091,200 |
| Size | 285.6 MB | 91.6 MB |
| Events in quadrant A | 3,108,173 | 647,210 |
| Events in quadrant B | 2,463,545 | 676,286 |
| Events in quadrant C | 2,539,940 | 640,927 |
| Events in quadrant D | 2,563,805 | 576,064 |
| Mode M9 | |||
|---|---|---|---|
| Quadrant | BADHDUFLAG | Total packets | Discarded packets |
| A | 0 | 31 | 0 |
| B | 0 | 31 | 0 |
| C | 0 | 31 | 0 |
| D | 0 | 32 | 0 |
| Mode SS | |||
|---|---|---|---|
| Quadrant | BADHDUFLAG | Total packets | Discarded packets |
| A | 0 | 108 | 0 |
| B | 0 | 108 | 0 |
| C | 0 | 108 | 0 |
| D | 0 | 108 | 0 |
| Mode M0 | |||
|---|---|---|---|
| Quadrant | BADHDUFLAG | Total packets | Discarded packets |
| A | 0 | 12568 | 3 |
| B | 0 | 10821 | 2 |
| C | 0 | 10739 | 2 |
| D | 0 | 11336 | 2 |
| Quadrant | Total seconds | Saturated seconds | Saturation percentage |
|---|---|---|---|
| A | 5275 | 18 | 0.341232% |
| B | 5275 | 15 | 0.284360% |
| C | 5275 | 5 | 0.094787% |
| D | 5275 | 25 | 0.473934% |
Noise dominated data is calculated using 1-second bins in cleaned event files. If a bin has >2000 counts, and if more than 50% of those come from <1% of pixels, then it is considered to be noise-dominated and hence unusable.
| Quadrant | # 1 sec bins | Bins with >0 counts | Bins with >2000 counts | High rate bins dominated by noise | Noise dominated (total time) | Noise dominated (detector-on time) | Marked lightcurve |
|---|---|---|---|---|---|---|---|
| A | 7368 | 5276 | 10 | 10 | 0.14% | 0.19% | 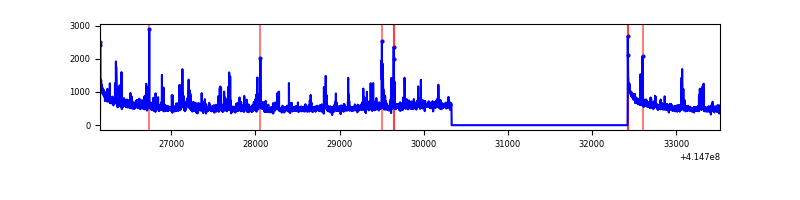 |
| B | 7368 | 5276 | 7 | 7 | 0.10% | 0.13% | 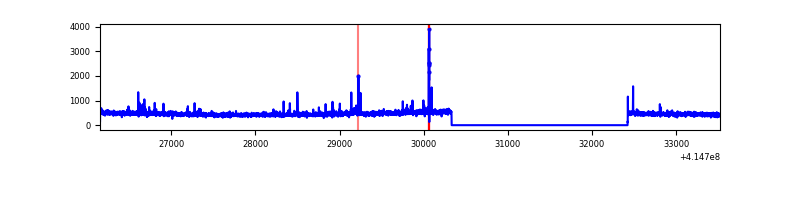 |
| C | 7368 | 5276 | 4 | 4 | 0.05% | 0.08% | 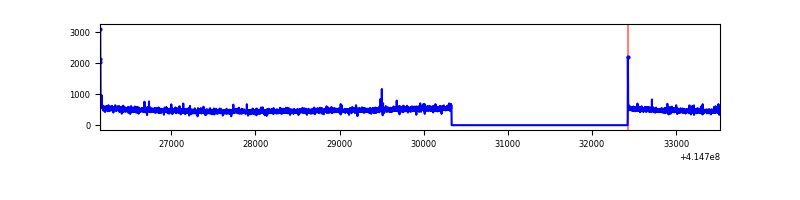 |
| D | 7368 | 5276 | 17 | 17 | 0.23% | 0.32% | 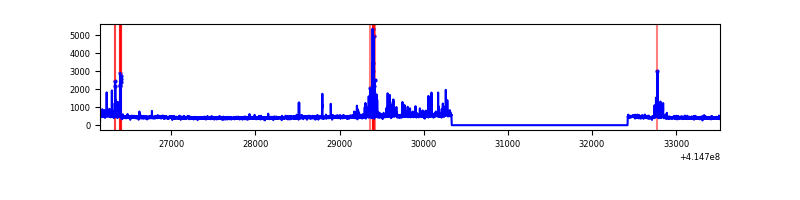 |
Top three noisy pixels from each quadrant. If the there are fewer than three noisy pixels in the level2.evt file, extra rows are filled as -1
| Pixel properties | Quadrant properties | ||||||
|---|---|---|---|---|---|---|---|
| Quadrant | DetID | PixID | Counts | Sigma | Mean | Median | Sigma |
| A | 10 | 83 | 453073 | 3756.75 | 595 | 584 | 120.4 |
| A | 12 | 189 | 133771 | 1105.77 | 595 | 584 | 120.4 |
| A | 6 | 10 | 131455 | 1086.54 | 595 | 584 | 120.4 |
| B | 4 | 171 | 51931 | 445.37 | 601 | 587 | 115.3 |
| B | 15 | 85 | 24715 | 209.29 | 601 | 587 | 115.3 |
| B | 0 | 230 | 18454 | 154.98 | 601 | 587 | 115.3 |
| C | 15 | 214 | 223229 | 1650.07 | 585 | 589 | 134.9 |
| C | 0 | 10 | 20314 | 146.19 | 585 | 589 | 134.9 |
| C | 12 | 249 | 6010 | 40.18 | 585 | 589 | 134.9 |
| D | 2 | 31 | 124192 | 886.63 | 575 | 560 | 139.4 |
| D | 13 | 249 | 100370 | 715.79 | 575 | 560 | 139.4 |
| D | 2 | 250 | 66728 | 474.53 | 575 | 560 | 139.4 |
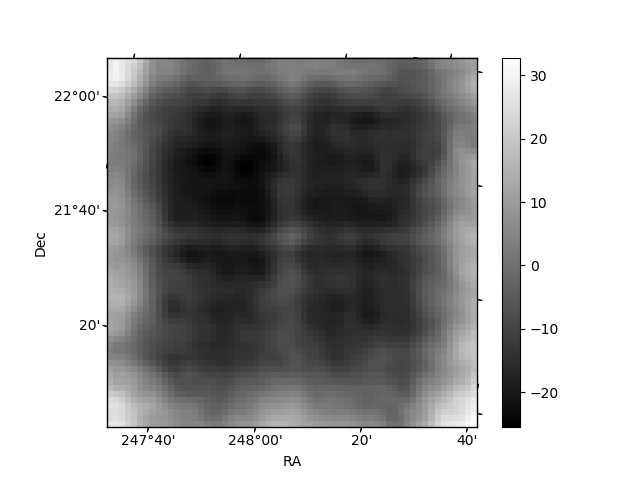
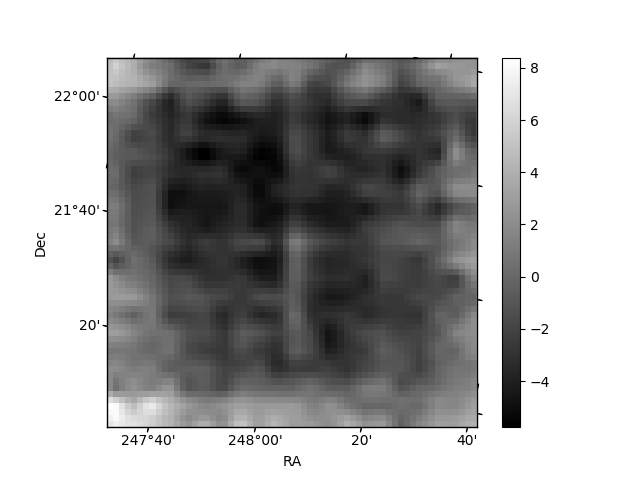
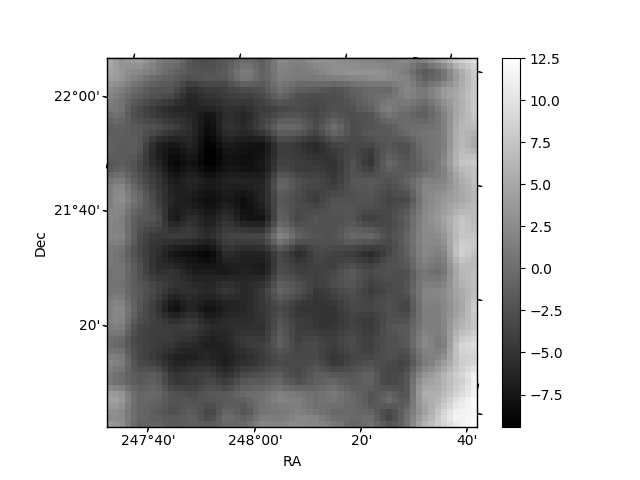
Histogram calculated using DETX and DETY for each event in the final _common_clean file
| Quadrant A | 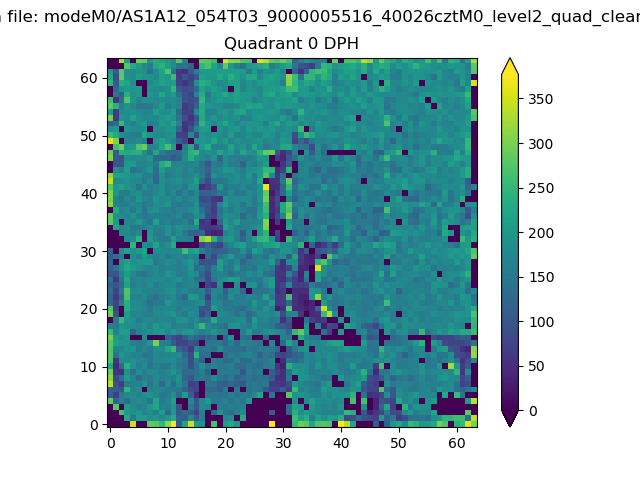 |
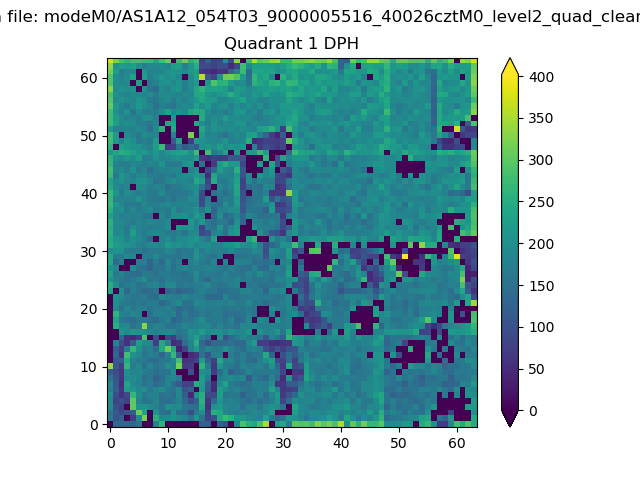 |
Quadrant B |
|---|---|---|---|
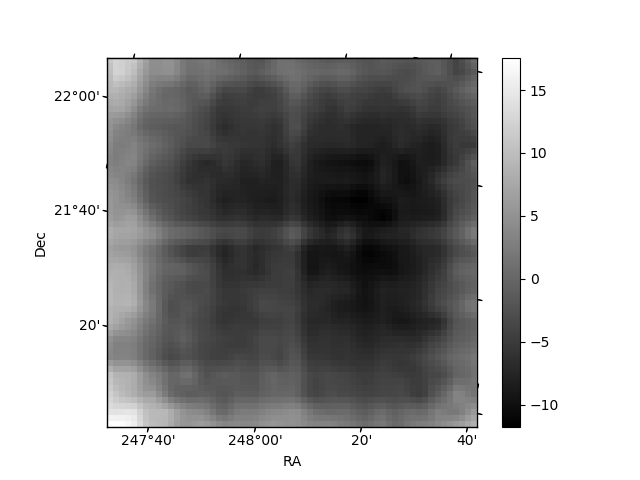
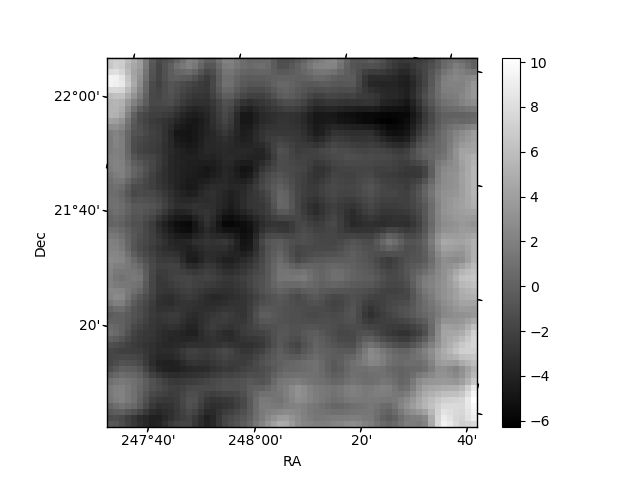
| Quadrant D | 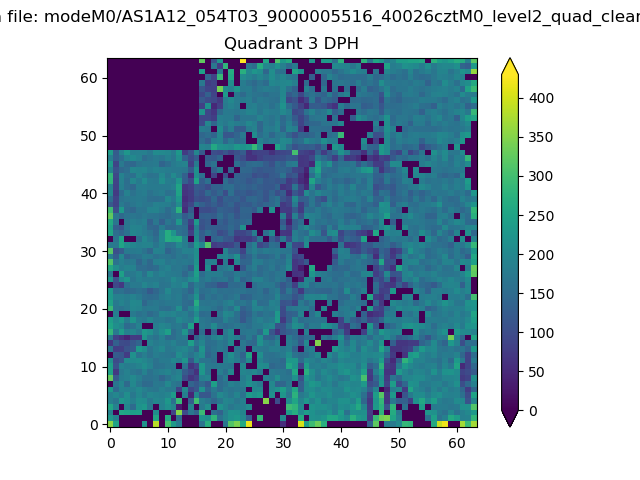 |
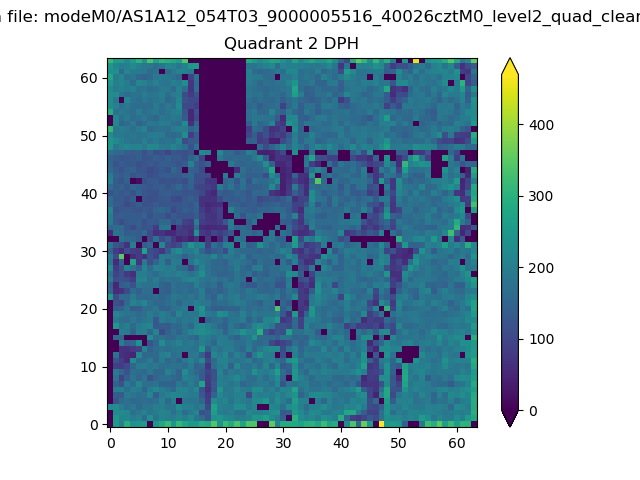 |
Quadrant C |
| Plot type | Count rate plots | Images |
|---|---|---|
| Comparison with Poisson distribution Blue bars denote a histogram of data divided into 1 sec bins. Red curve is a Poisson curve with rate = median count rate of data. |
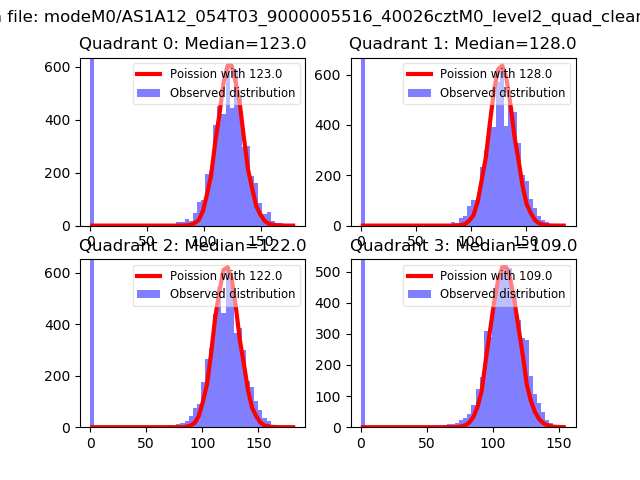 |
 |
| Quadrant-wise count rates Data is divided into 100 sec bins |
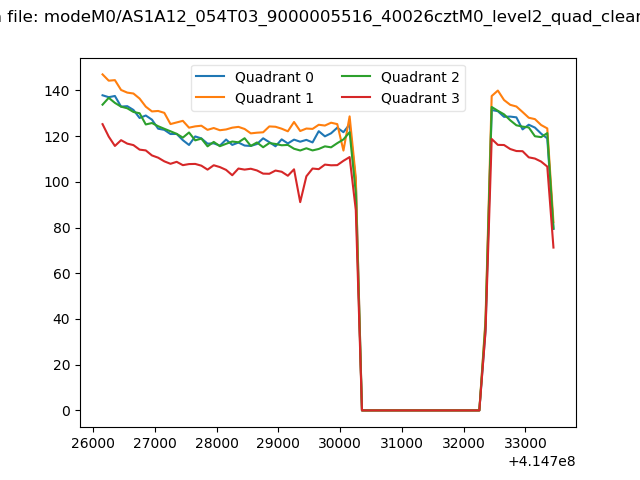 |
|
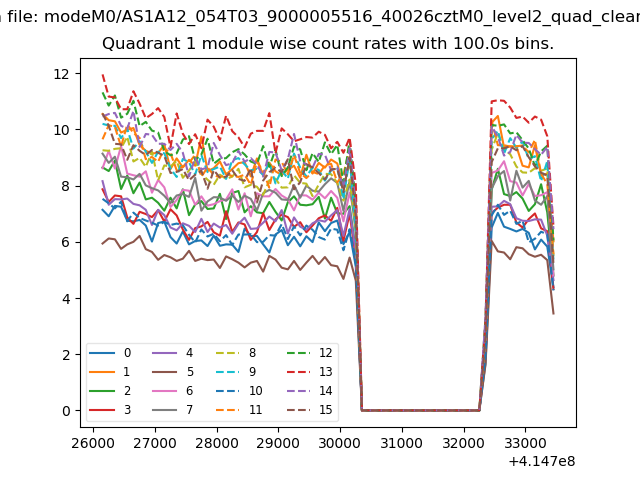
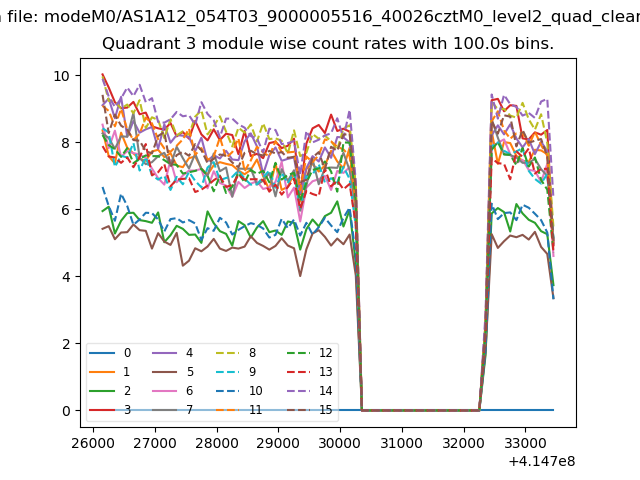
| Module-wise count rates for Quadrant A Data is divided into 100 sec bins |
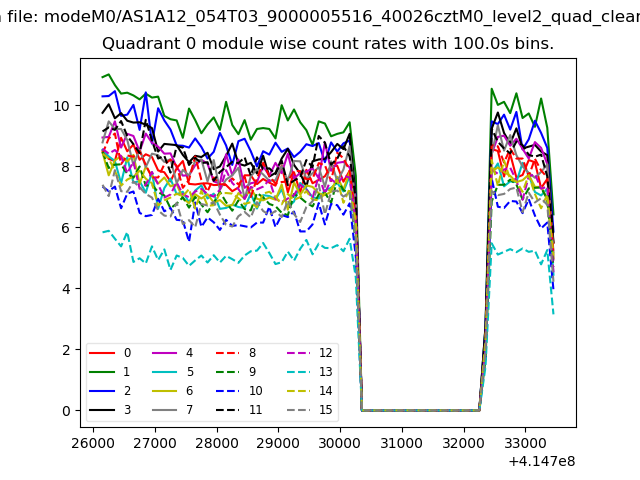 |
 |
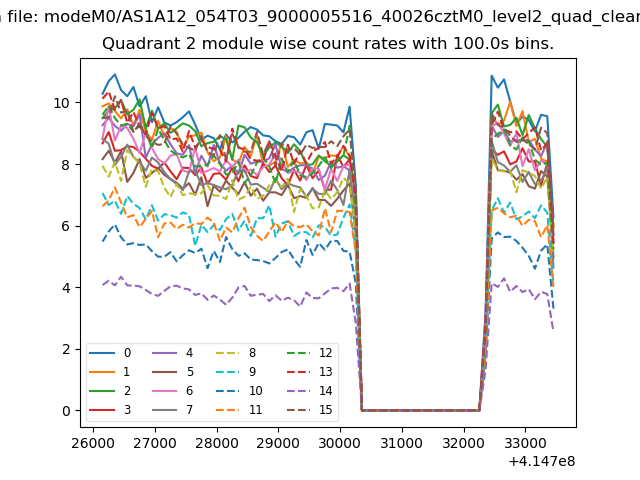
| Module-wise count rates for Quadrant B Data is divided into 100 sec bins |
 |
 |
| Module-wise count rates for Quadrant C Data is divided into 100 sec bins |
 |
 |
| Module-wise count rates for Quadrant D Data is divided into 100 sec bins |
 |
 |
| Parameter | Plot |
|---|---|
| CZT HV Monitor | 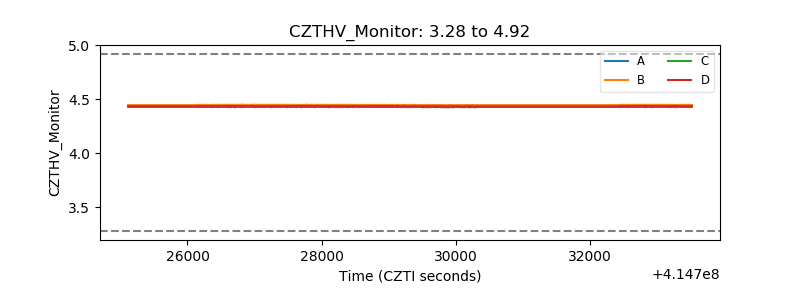 |
| D_VDD | 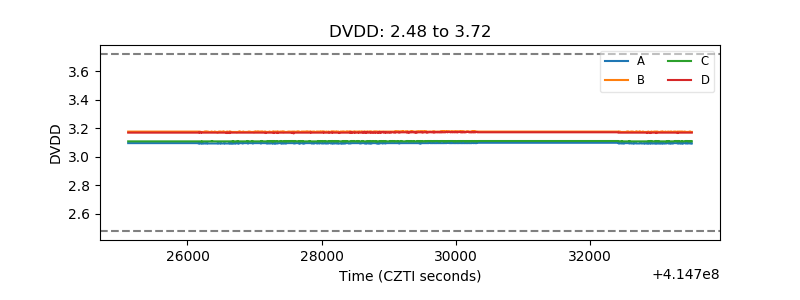 |
| Temperature 1 | 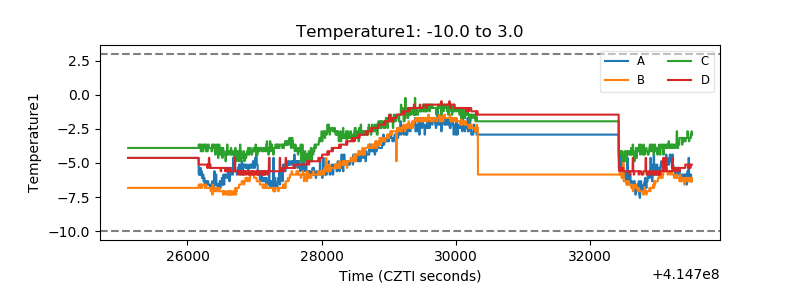 |
| Veto HV Monitor | 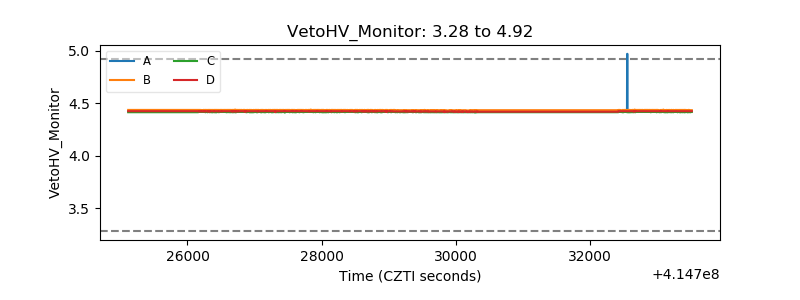 |
| Veto LLD | 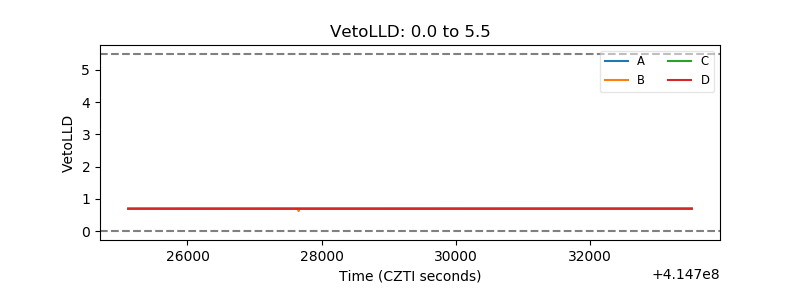 |
| Alpha Counter |  |
| _CPM_Rate | 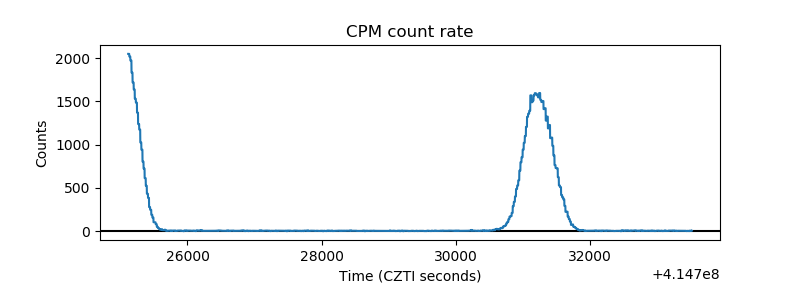 |
| CZT Counter | 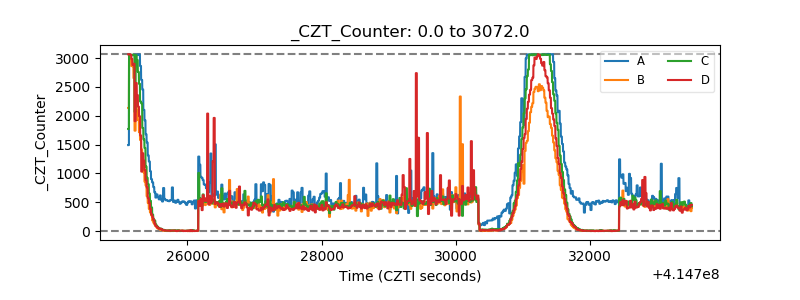 |
| +2.5 Volts monitor | 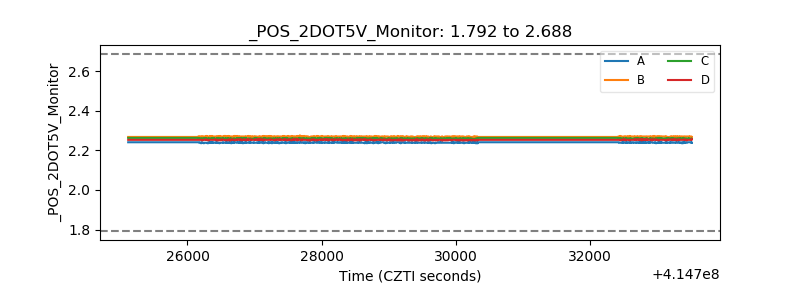 |
| +5 Volts monitor | 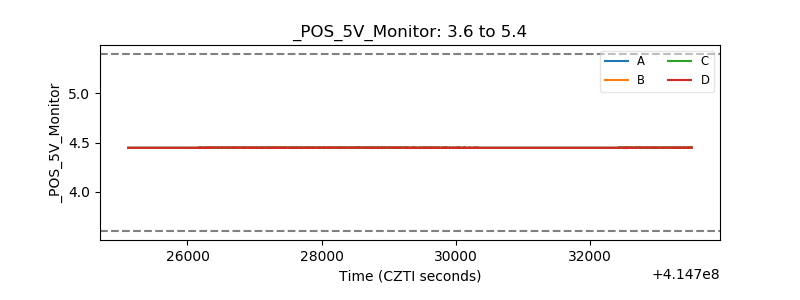 |
| _ROLL_ROT | 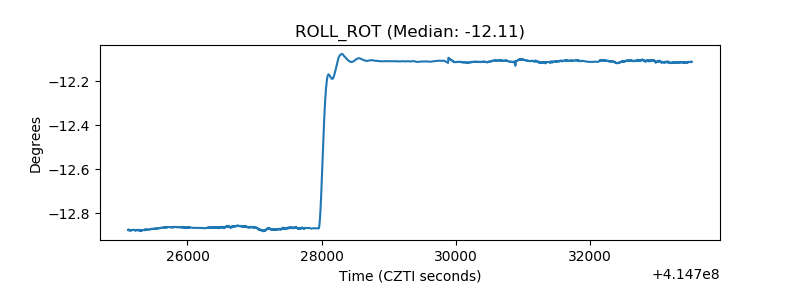 |
| _Roll_DEC | 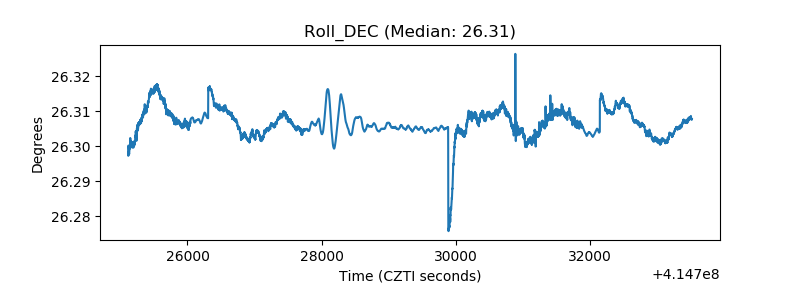 |
| _Roll_RA | 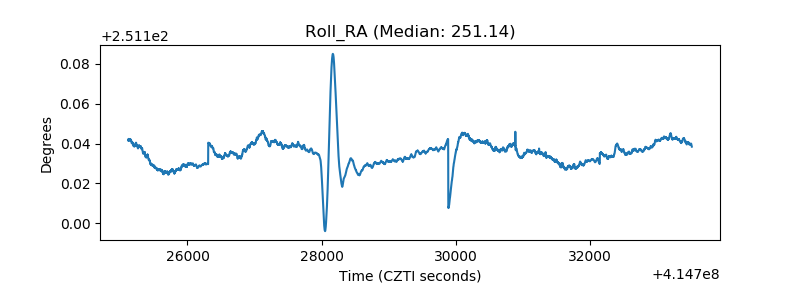 |
| Veto Counter | 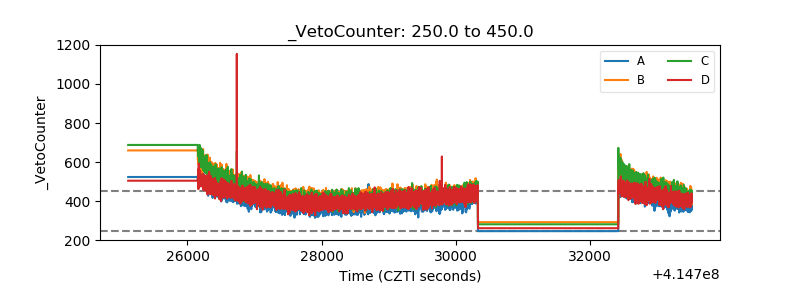 |