| Param | Original file | Final file |
|---|---|---|
| Filename | modeM0/AS1A12_054T03_9000005516_40027cztM0_level2.fits | modeM0/AS1A12_054T03_9000005516_40027cztM0_level2_quad_clean.evt |
| Size (bytes) | 300,804,480 | 92,525,760 |
| Size | 286.9 MB | 88.2 MB |
| Events in quadrant A | 2,901,932 | 623,477 |
| Events in quadrant B | 2,356,764 | 650,764 |
| Events in quadrant C | 2,636,201 | 614,576 |
| Events in quadrant D | 2,830,345 | 545,540 |
| Mode M9 | |||
|---|---|---|---|
| Quadrant | BADHDUFLAG | Total packets | Discarded packets |
| A | 0 | 33 | 0 |
| B | 0 | 33 | 0 |
| C | 0 | 33 | 0 |
| D | 0 | 34 | 0 |
| Mode SS | |||
|---|---|---|---|
| Quadrant | BADHDUFLAG | Total packets | Discarded packets |
| A | 0 | 106 | 0 |
| B | 0 | 106 | 0 |
| C | 0 | 106 | 0 |
| D | 0 | 106 | 0 |
| Mode M0 | |||
|---|---|---|---|
| Quadrant | BADHDUFLAG | Total packets | Discarded packets |
| A | 0 | 11913 | 3 |
| B | 0 | 10621 | 2 |
| C | 0 | 11031 | 2 |
| D | 0 | 12147 | 2 |
| Quadrant | Total seconds | Saturated seconds | Saturation percentage |
|---|---|---|---|
| A | 5250 | 16 | 0.304762% |
| B | 5250 | 5 | 0.095238% |
| C | 5250 | 21 | 0.400000% |
| D | 5250 | 158 | 3.009524% |
Noise dominated data is calculated using 1-second bins in cleaned event files. If a bin has >2000 counts, and if more than 50% of those come from <1% of pixels, then it is considered to be noise-dominated and hence unusable.
| Quadrant | # 1 sec bins | Bins with >0 counts | Bins with >2000 counts | High rate bins dominated by noise | Noise dominated (total time) | Noise dominated (detector-on time) | Marked lightcurve |
|---|---|---|---|---|---|---|---|
| A | 7371 | 5251 | 6 | 6 | 0.08% | 0.11% | 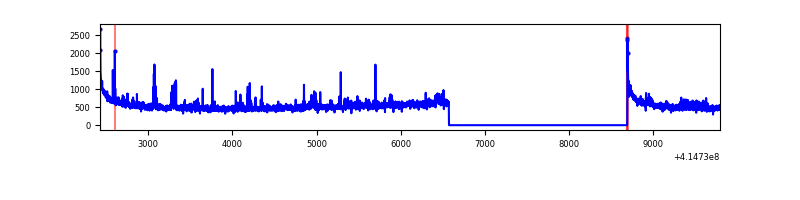 |
| B | 7371 | 5251 | 1 | 1 | 0.01% | 0.02% | 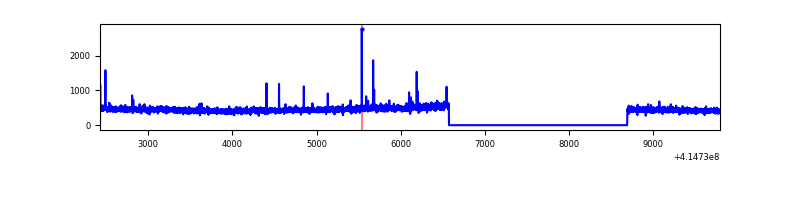 |
| C | 7371 | 5251 | 16 | 16 | 0.22% | 0.30% | 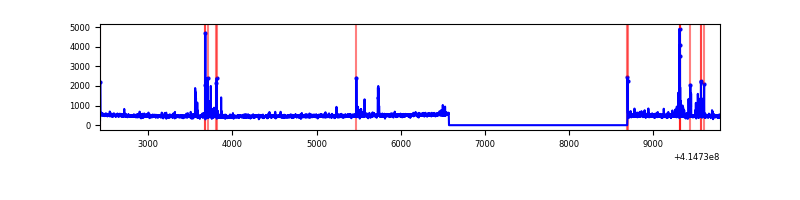 |
| D | 7371 | 5251 | 114 | 114 | 1.55% | 2.17% | 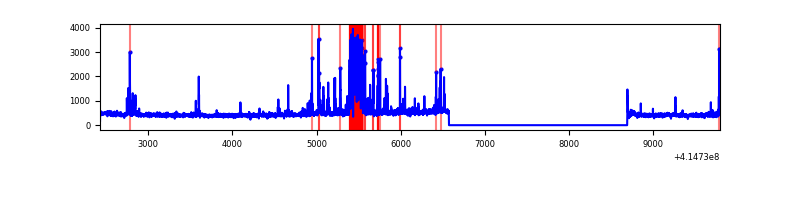 |
Top three noisy pixels from each quadrant. If the there are fewer than three noisy pixels in the level2.evt file, extra rows are filled as -1
| Pixel properties | Quadrant properties | ||||||
|---|---|---|---|---|---|---|---|
| Quadrant | DetID | PixID | Counts | Sigma | Mean | Median | Sigma |
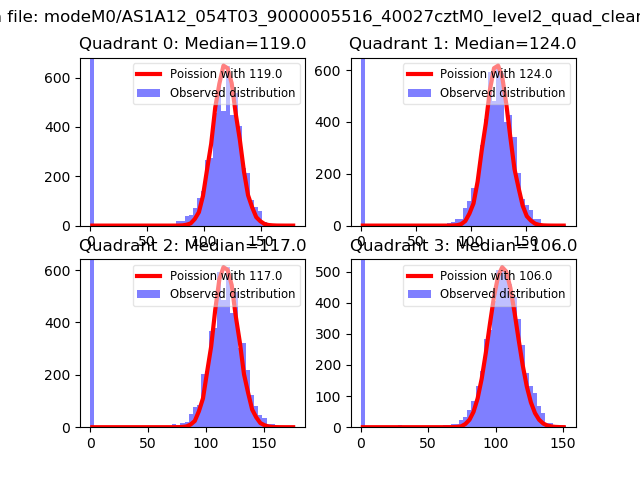
| A | 10 | 83 | 450312 | 3762.77 | 586 | 576 | 119.5 |
| A | 6 | 10 | 86377 | 717.86 | 586 | 576 | 119.5 |
| A | 12 | 189 | 47553 | 393.04 | 586 | 576 | 119.5 |
| B | 4 | 171 | 25410 | 220.74 | 588 | 572 | 112.5 |
| B | 12 | 111 | 13632 | 116.06 | 588 | 572 | 112.5 |
| B | 11 | 111 | 12406 | 105.17 | 588 | 572 | 112.5 |
| C | 15 | 214 | 234295 | 1762.61 | 571 | 575 | 132.6 |
| C | 14 | 254 | 135227 | 1015.48 | 571 | 575 | 132.6 |
| C | 0 | 10 | 17101 | 124.63 | 571 | 575 | 132.6 |
| D | 2 | 250 | 366113 | 2687.21 | 560 | 545 | 136.0 |
| D | 2 | 31 | 108777 | 795.59 | 560 | 545 | 136.0 |
| D | 1 | 47 | 80719 | 589.34 | 560 | 545 | 136.0 |
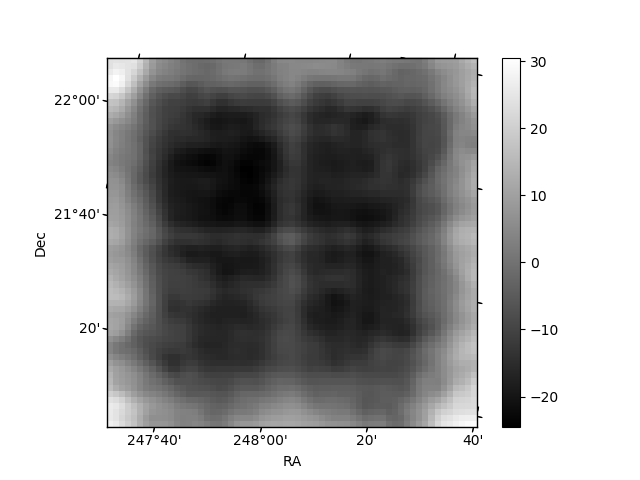
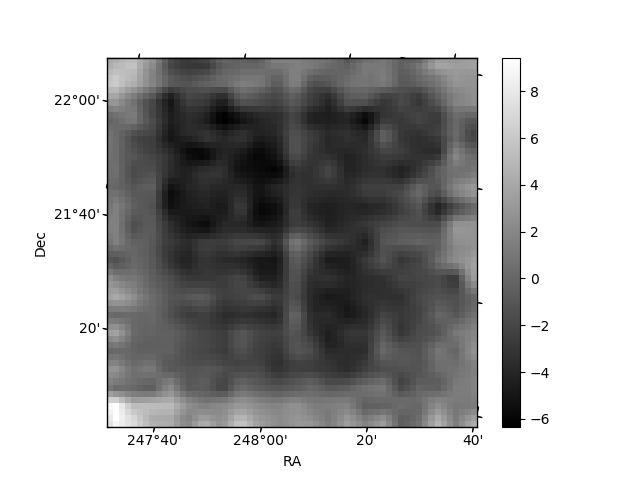
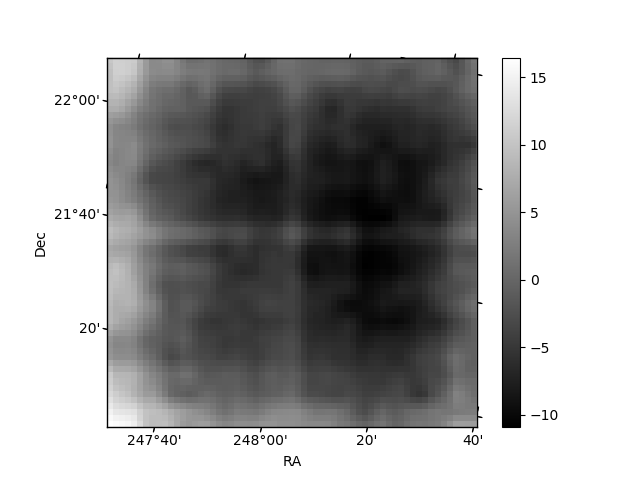
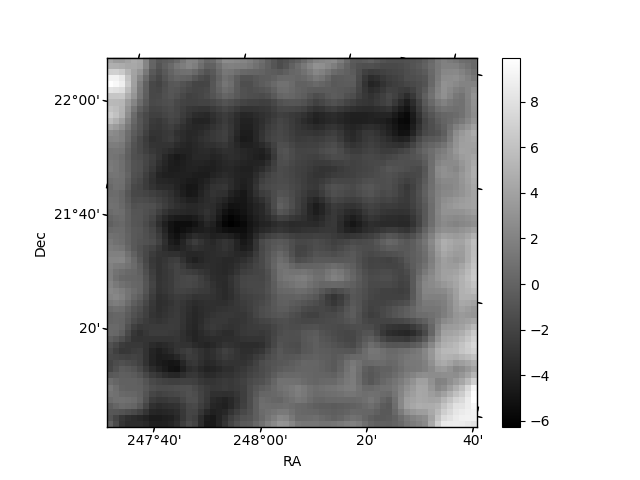
Histogram calculated using DETX and DETY for each event in the final _common_clean file
| Quadrant A | 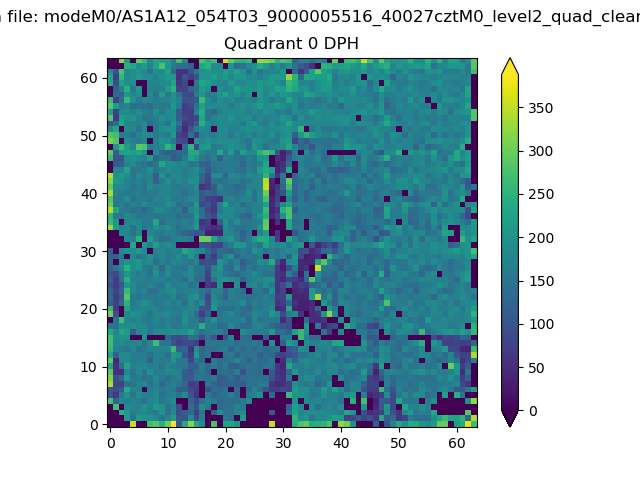 |
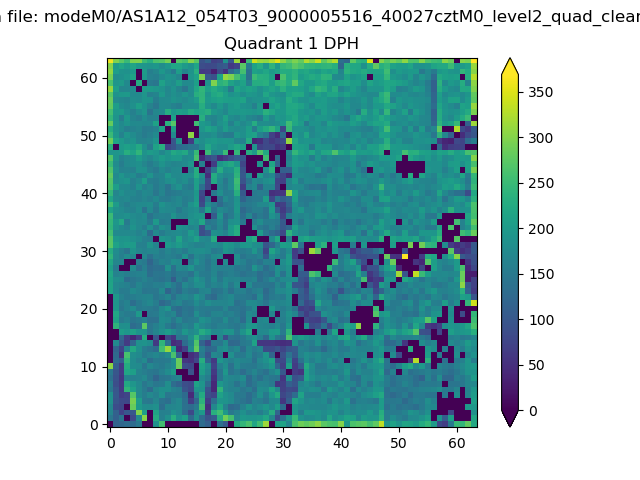 |
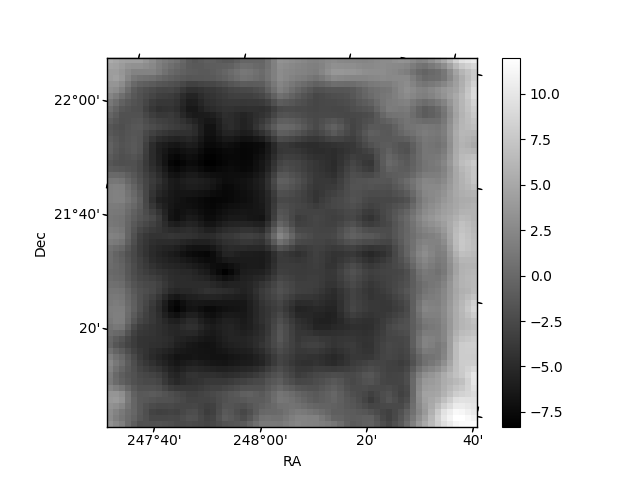
Quadrant B |
|---|---|---|---|
| Quadrant D | 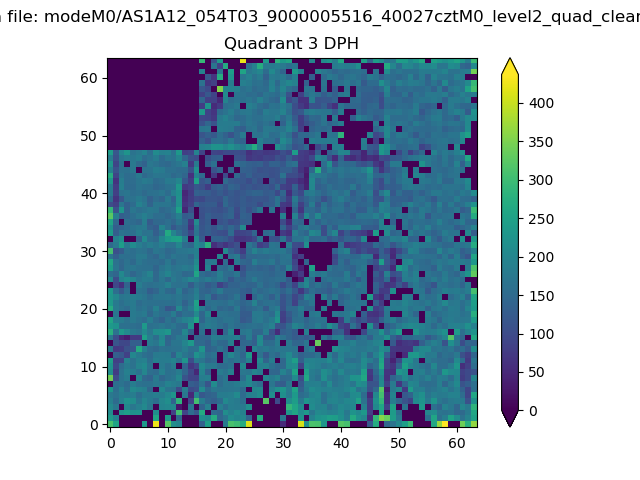 |
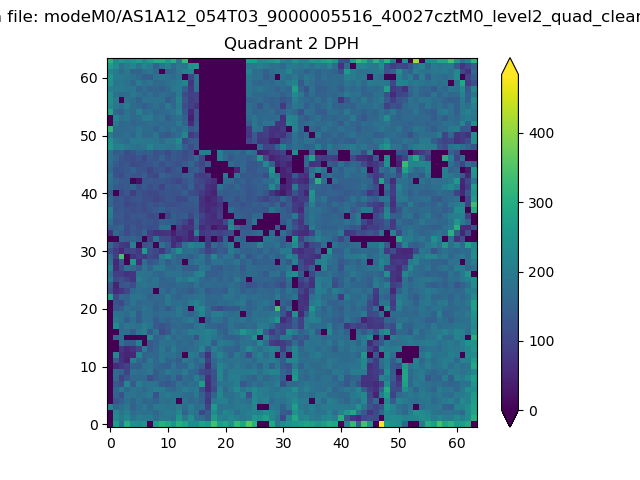 |
Quadrant C |
| Plot type | Count rate plots | Images |
|---|---|---|
| Comparison with Poisson distribution Blue bars denote a histogram of data divided into 1 sec bins. Red curve is a Poisson curve with rate = median count rate of data. |
 |
 |
| Quadrant-wise count rates Data is divided into 100 sec bins |
 |
|
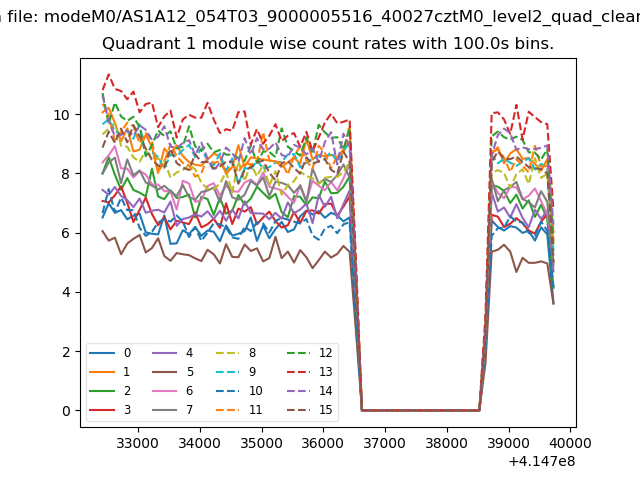
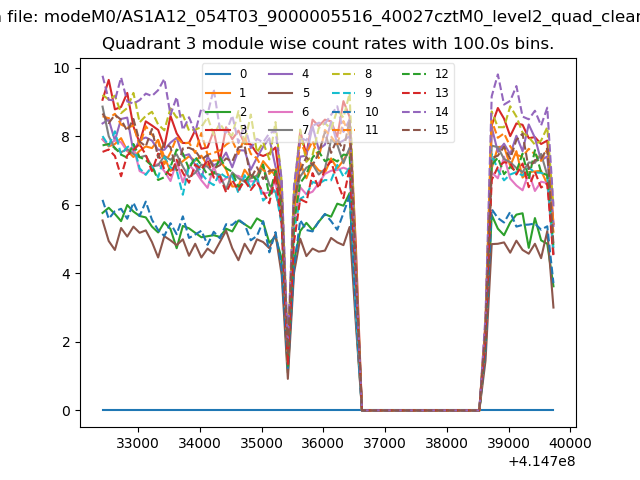
| Module-wise count rates for Quadrant A Data is divided into 100 sec bins |
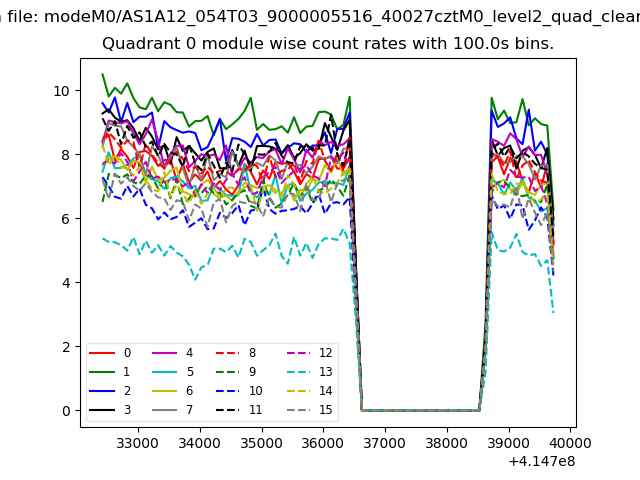 |
 |
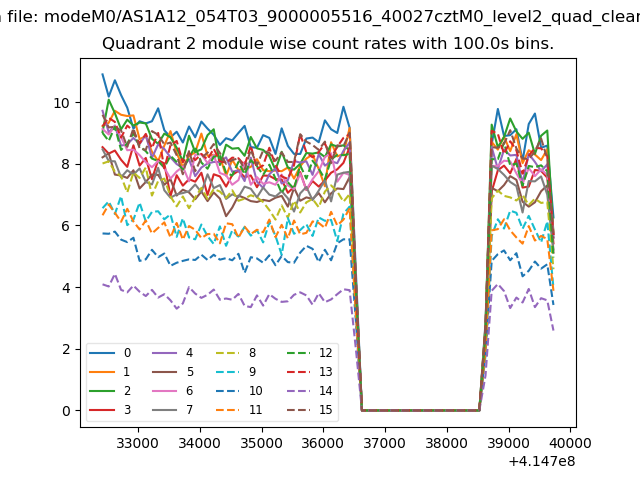
| Module-wise count rates for Quadrant B Data is divided into 100 sec bins |
 |
 |
| Module-wise count rates for Quadrant C Data is divided into 100 sec bins |
 |
 |
| Module-wise count rates for Quadrant D Data is divided into 100 sec bins |
 |
 |
| Parameter | Plot |
|---|---|
| CZT HV Monitor | 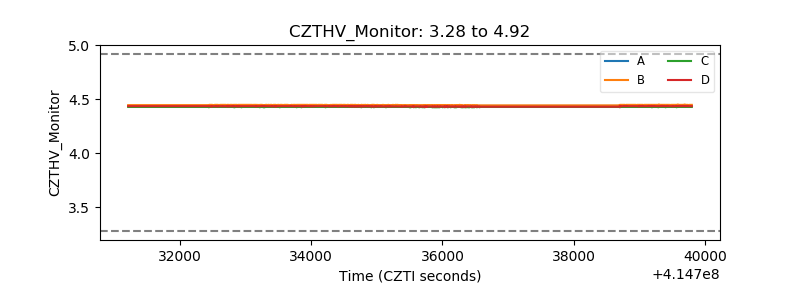 |
| D_VDD | 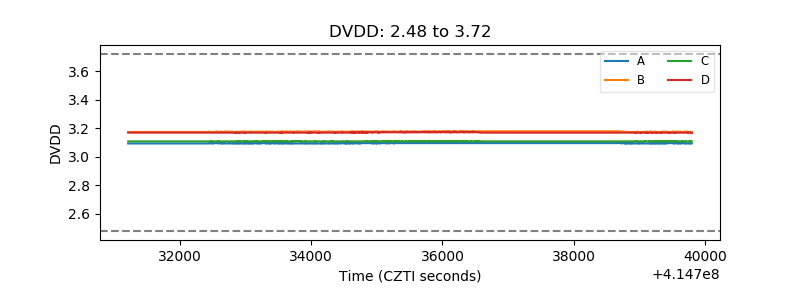 |
| Temperature 1 | 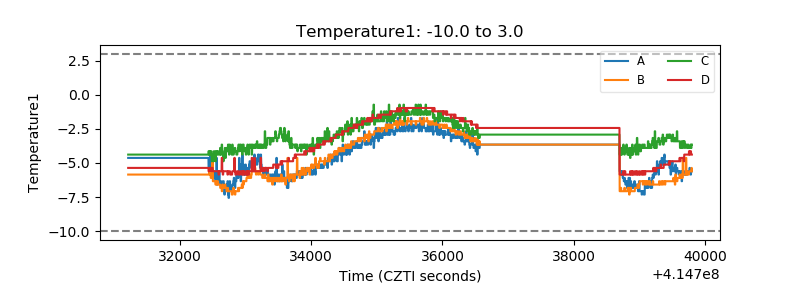 |
| Veto HV Monitor | 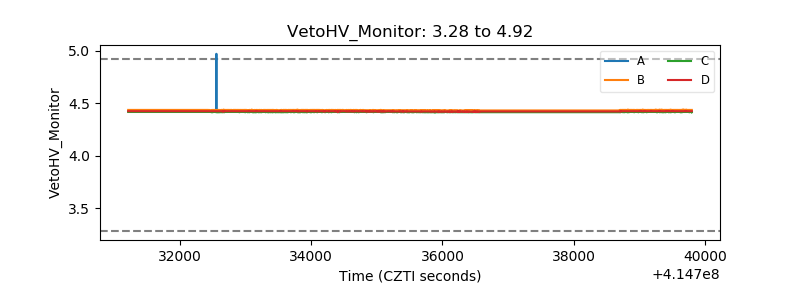 |
| Veto LLD | 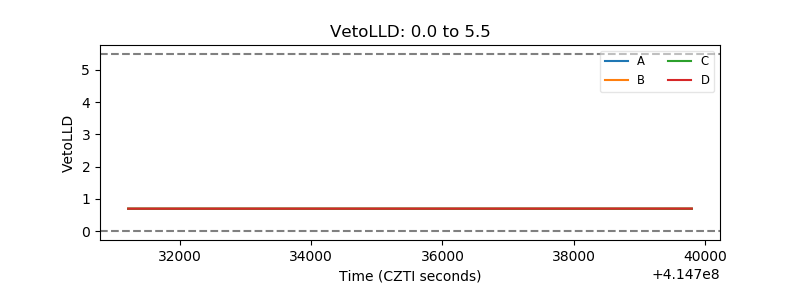 |
| Alpha Counter | 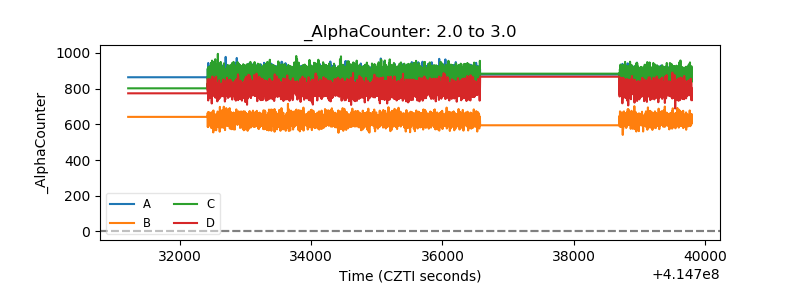 |
| _CPM_Rate | 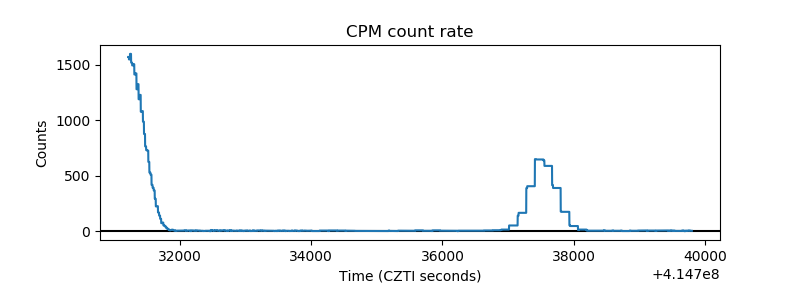 |
| CZT Counter | 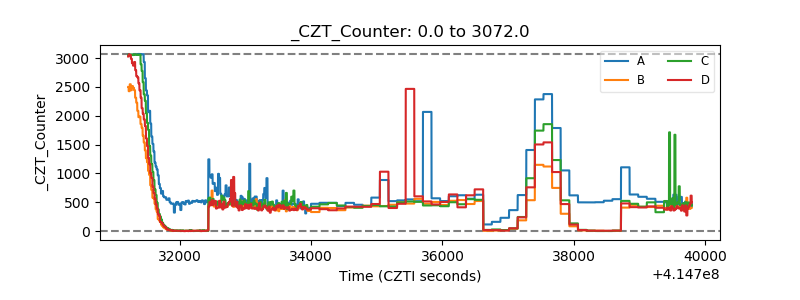 |
| +2.5 Volts monitor | 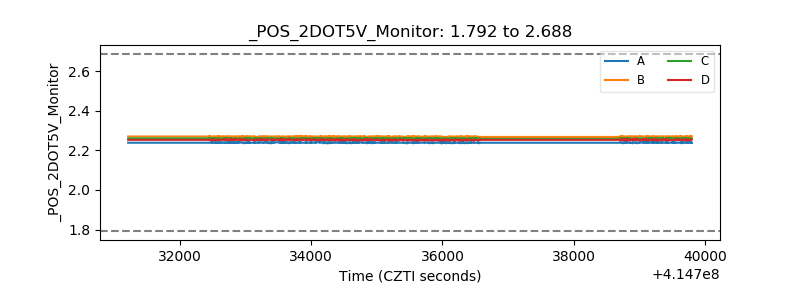 |
| +5 Volts monitor | 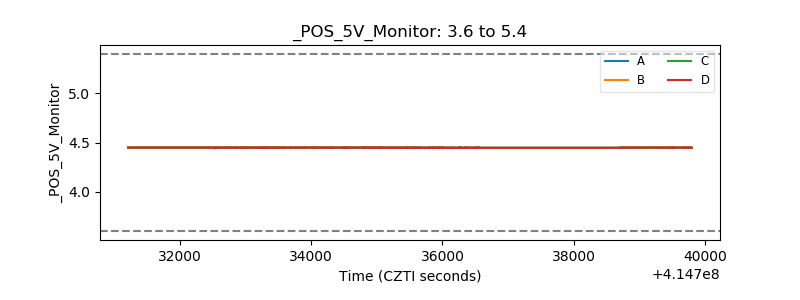 |
| _ROLL_ROT | 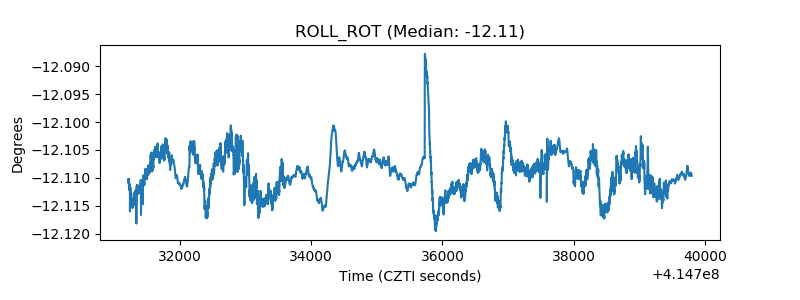 |
| _Roll_DEC | 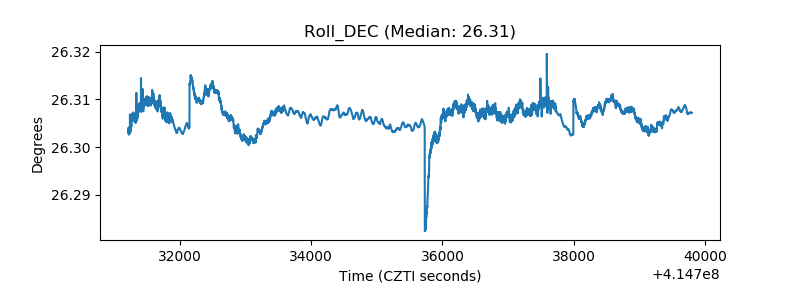 |
| _Roll_RA | 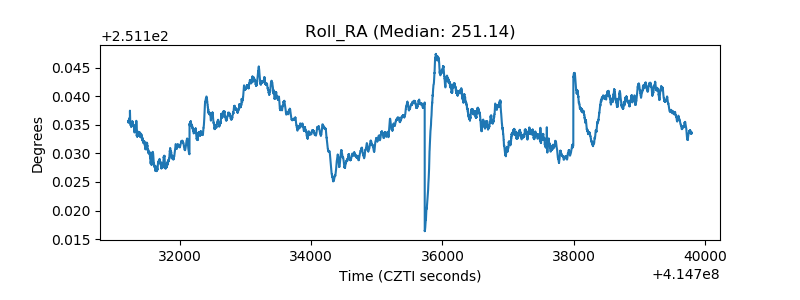 |
| Veto Counter | 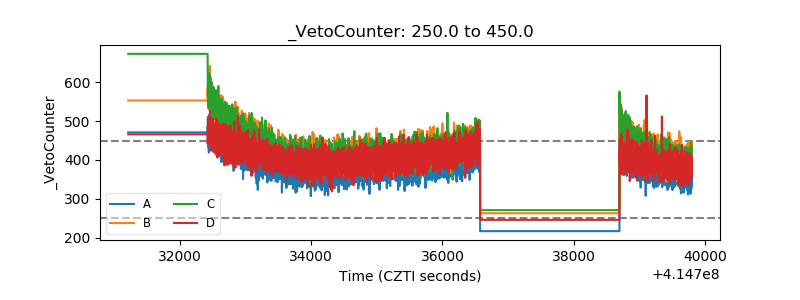 |