| Param | Original file | Final file |
|---|---|---|
| Filename | modeM0/AS1A12_054T03_9000005516_40028cztM0_level2.fits | modeM0/AS1A12_054T03_9000005516_40028cztM0_level2_quad_clean.evt |
| Size (bytes) | 310,150,080 | 88,133,760 |
| Size | 295.8 MB | 84.1 MB |
| Events in quadrant A | 2,951,125 | 590,565 |
| Events in quadrant B | 2,273,319 | 611,426 |
| Events in quadrant C | 2,887,910 | 579,607 |
| Events in quadrant D | 2,963,929 | 523,619 |
| Mode M9 | |||
|---|---|---|---|
| Quadrant | BADHDUFLAG | Total packets | Discarded packets |
| A | 0 | 33 | 0 |
| B | 0 | 33 | 0 |
| C | 0 | 33 | 0 |
| D | 0 | 34 | 0 |
| Mode SS | |||
|---|---|---|---|
| Quadrant | BADHDUFLAG | Total packets | Discarded packets |
| A | 0 | 106 | 0 |
| B | 0 | 106 | 0 |
| C | 0 | 106 | 0 |
| D | 0 | 106 | 0 |
| Mode M0 | |||
|---|---|---|---|
| Quadrant | BADHDUFLAG | Total packets | Discarded packets |
| A | 0 | 11992 | 3 |
| B | 0 | 10444 | 2 |
| C | 0 | 11886 | 2 |
| D | 0 | 12503 | 2 |
| Quadrant | Total seconds | Saturated seconds | Saturation percentage |
|---|---|---|---|
| A | 5189 | 13 | 0.250530% |
| B | 5189 | 7 | 0.134901% |
| C | 5189 | 55 | 1.059934% |
| D | 5189 | 95 | 1.830796% |
Noise dominated data is calculated using 1-second bins in cleaned event files. If a bin has >2000 counts, and if more than 50% of those come from <1% of pixels, then it is considered to be noise-dominated and hence unusable.
| Quadrant | # 1 sec bins | Bins with >0 counts | Bins with >2000 counts | High rate bins dominated by noise | Noise dominated (total time) | Noise dominated (detector-on time) | Marked lightcurve |
|---|---|---|---|---|---|---|---|
| A | 7252 | 5190 | 5 | 5 | 0.07% | 0.10% | 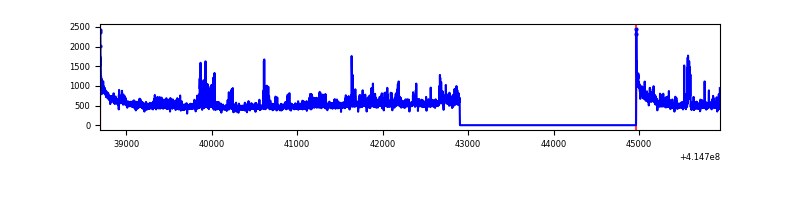 |
| B | 7252 | 5190 | 1 | 1 | 0.01% | 0.02% | 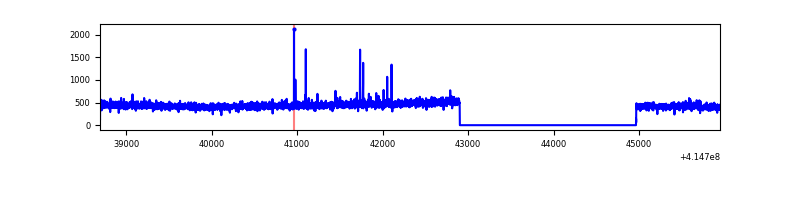 |
| C | 7252 | 5190 | 39 | 39 | 0.54% | 0.75% | 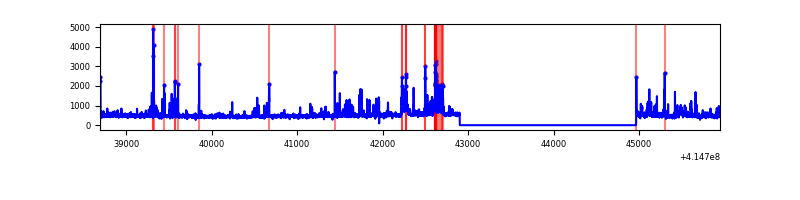 |
| D | 7252 | 5190 | 65 | 65 | 0.90% | 1.25% | 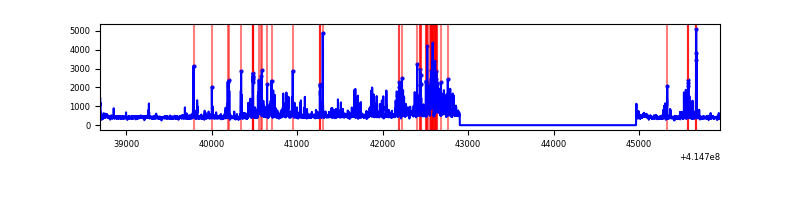 |
Top three noisy pixels from each quadrant. If the there are fewer than three noisy pixels in the level2.evt file, extra rows are filled as -1
| Pixel properties | Quadrant properties | ||||||
|---|---|---|---|---|---|---|---|
| Quadrant | DetID | PixID | Counts | Sigma | Mean | Median | Sigma |
| A | 10 | 83 | 459094 | 3925.11 | 570 | 558 | 116.8 |
| A | 6 | 10 | 187785 | 1602.68 | 570 | 558 | 116.8 |
| A | 12 | 189 | 52466 | 444.34 | 570 | 558 | 116.8 |
| B | 4 | 171 | 13531 | 117.66 | 568 | 553 | 110.3 |
| B | 12 | 111 | 13513 | 117.49 | 568 | 553 | 110.3 |
| B | 11 | 111 | 12514 | 108.44 | 568 | 553 | 110.3 |
| C | 9 | 187 | 258552 | 1990.99 | 553 | 556 | 129.6 |
| C | 15 | 214 | 232349 | 1788.78 | 553 | 556 | 129.6 |
| C | 14 | 254 | 184210 | 1417.28 | 553 | 556 | 129.6 |
| D | 1 | 47 | 593233 | 4438.56 | 551 | 537 | 133.5 |
| D | 2 | 31 | 111419 | 830.37 | 551 | 537 | 133.5 |
| D | 2 | 250 | 49766 | 368.66 | 551 | 537 | 133.5 |
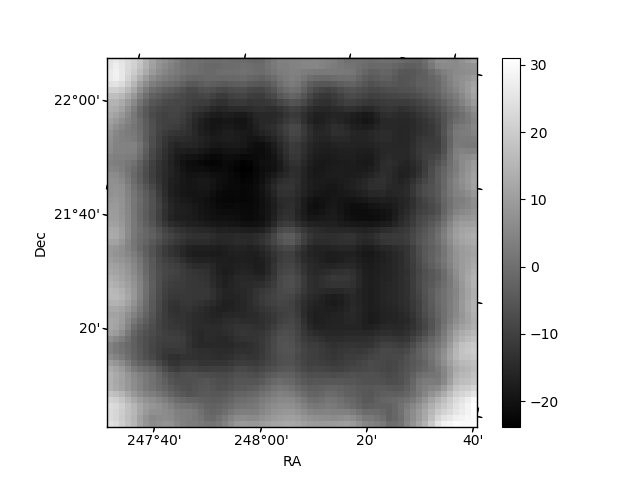
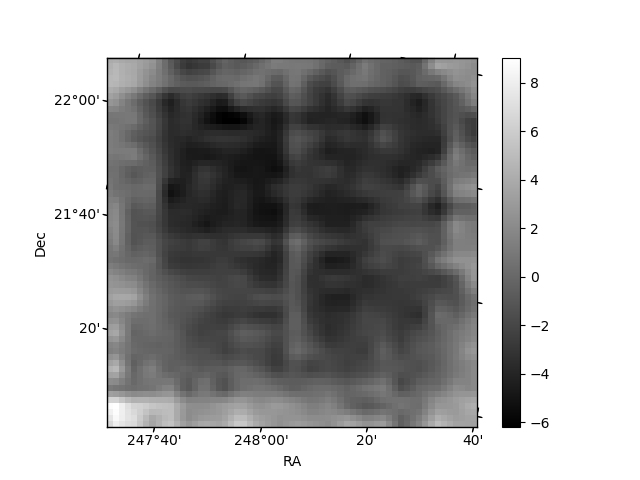
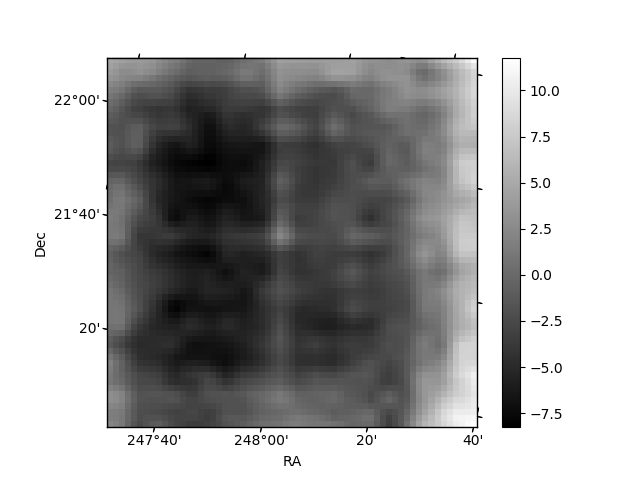
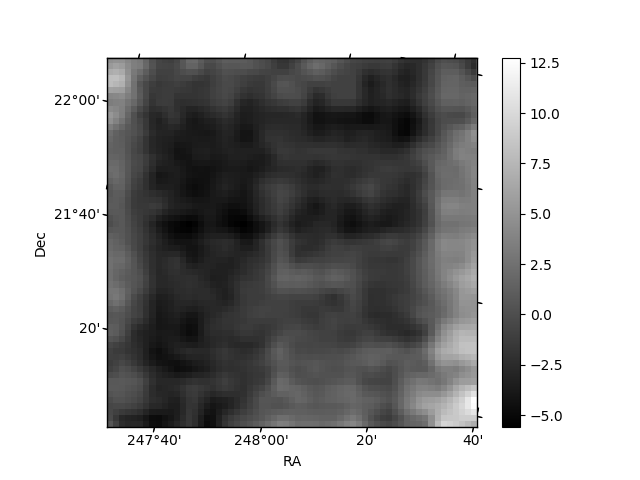
Histogram calculated using DETX and DETY for each event in the final _common_clean file
| Quadrant A | 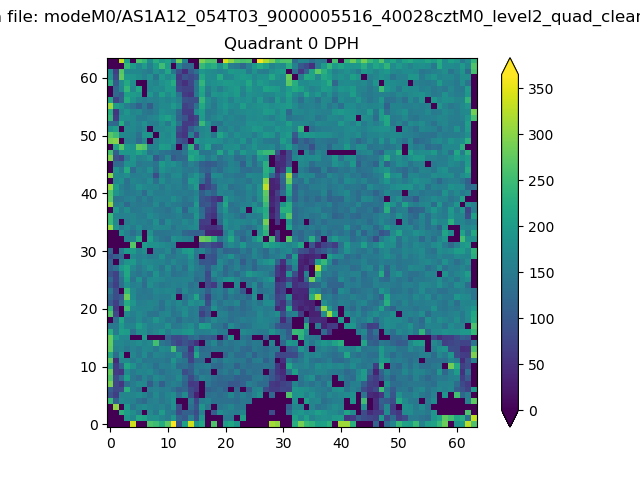 |
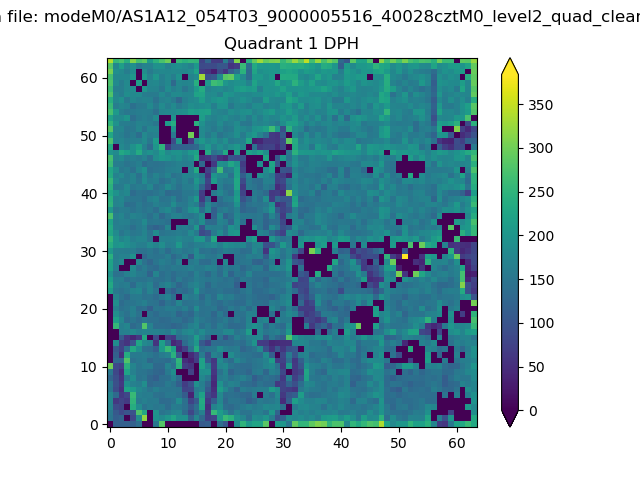 |
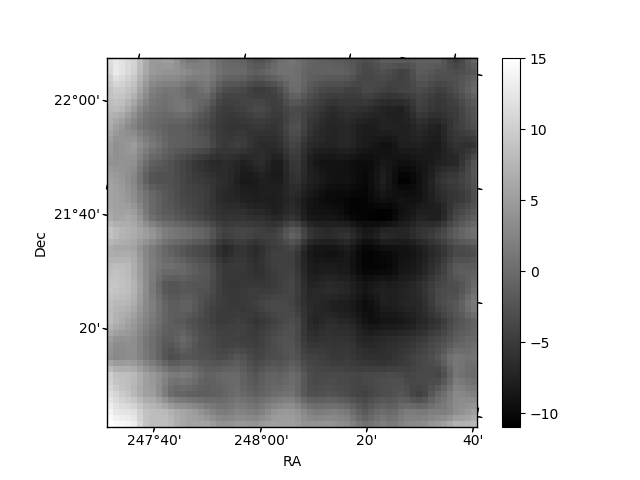
Quadrant B |
|---|---|---|---|
| Quadrant D | 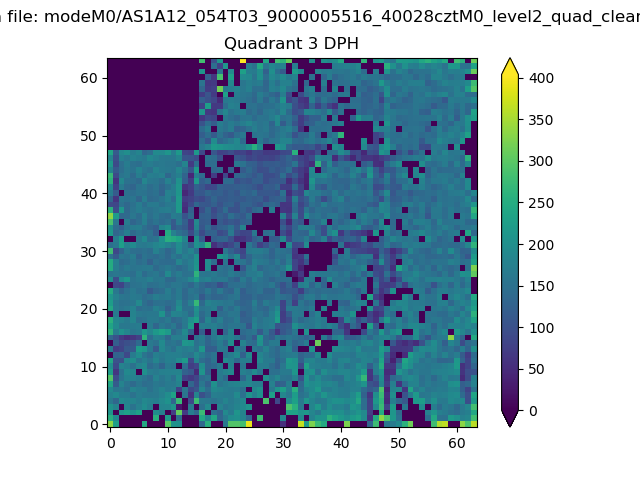 |
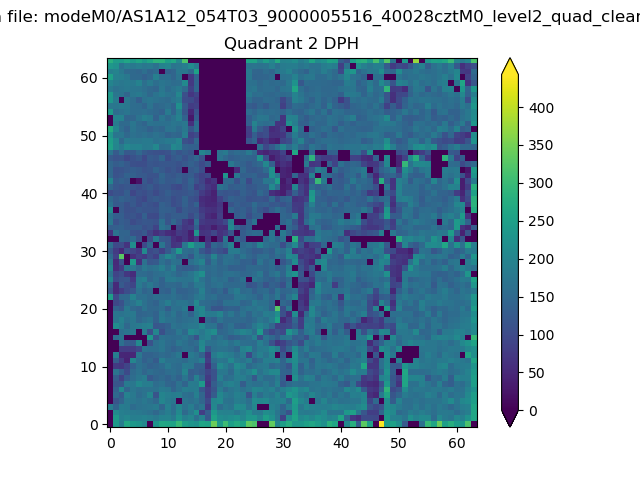 |
Quadrant C |
| Plot type | Count rate plots | Images |
|---|---|---|
| Comparison with Poisson distribution Blue bars denote a histogram of data divided into 1 sec bins. Red curve is a Poisson curve with rate = median count rate of data. |
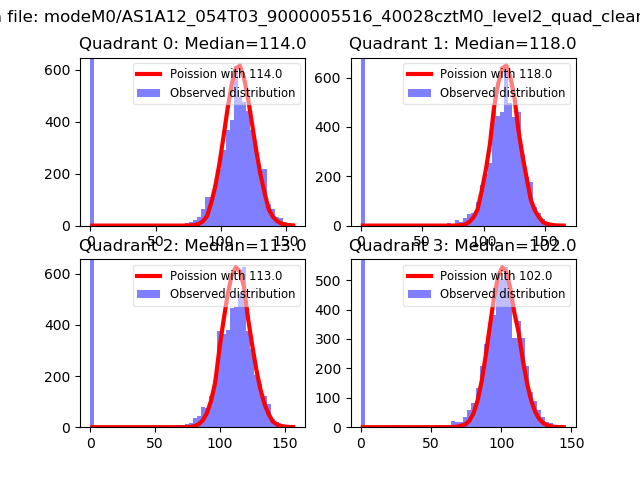 |
 |
| Quadrant-wise count rates Data is divided into 100 sec bins |
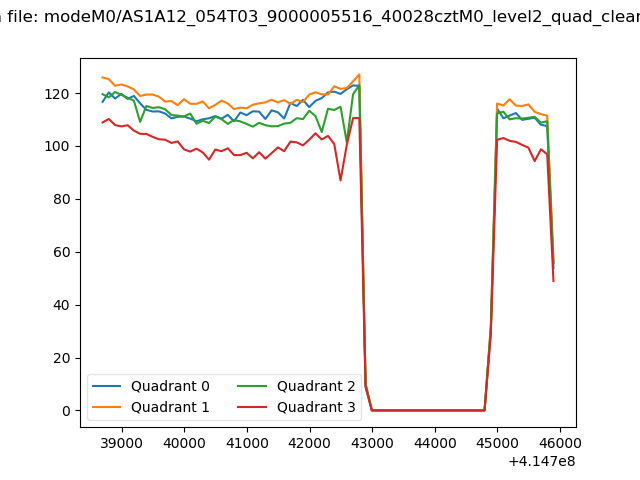 |
|
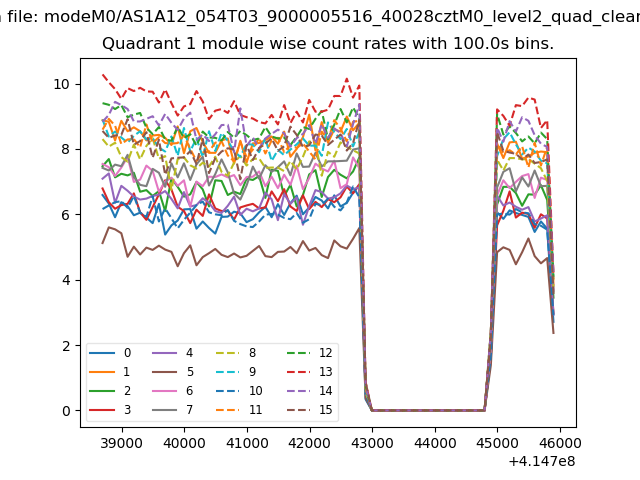
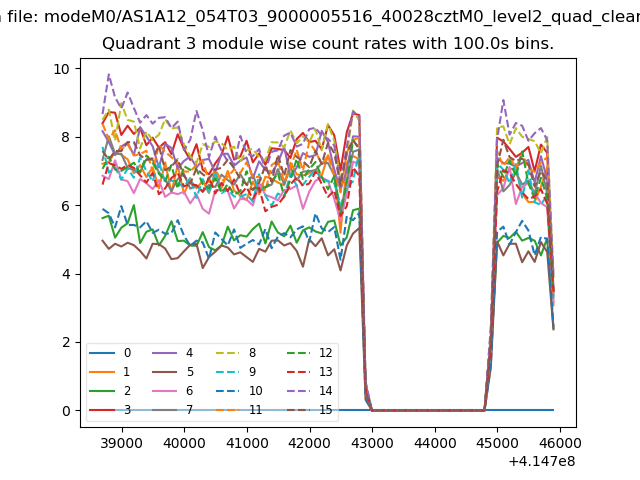
| Module-wise count rates for Quadrant A Data is divided into 100 sec bins |
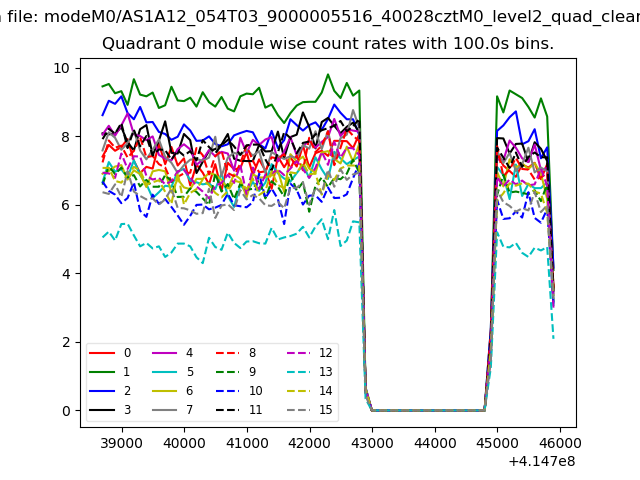 |
 |
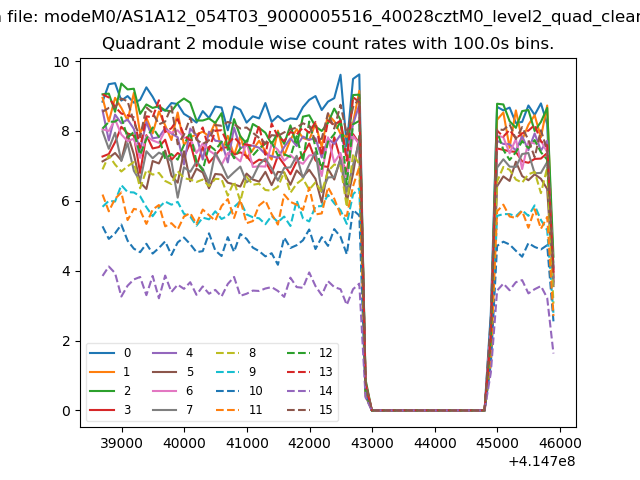
| Module-wise count rates for Quadrant B Data is divided into 100 sec bins |
 |
 |
| Module-wise count rates for Quadrant C Data is divided into 100 sec bins |
 |
 |
| Module-wise count rates for Quadrant D Data is divided into 100 sec bins |
 |
 |
| Parameter | Plot |
|---|---|
| CZT HV Monitor | 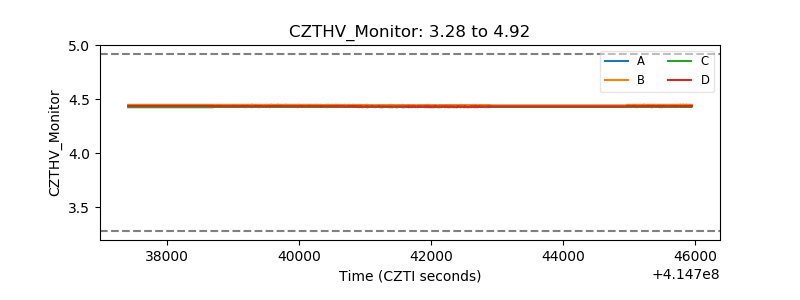 |
| D_VDD | 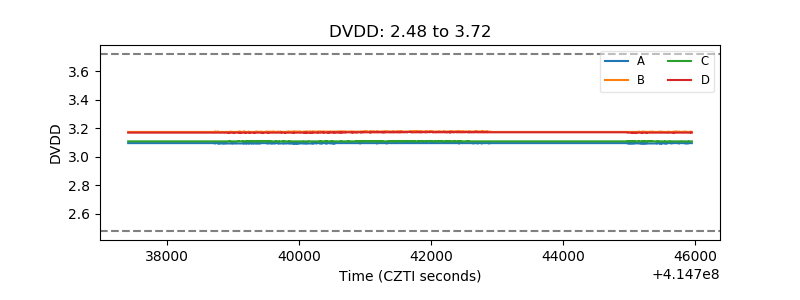 |
| Temperature 1 | 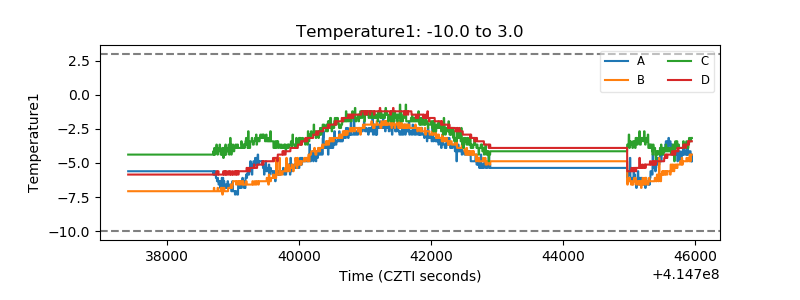 |
| Veto HV Monitor | 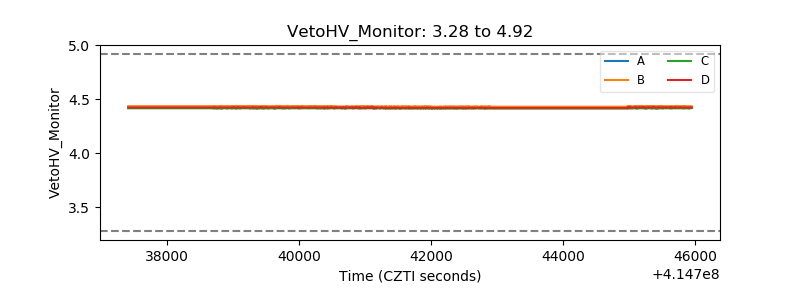 |
| Veto LLD |  |
| Alpha Counter | 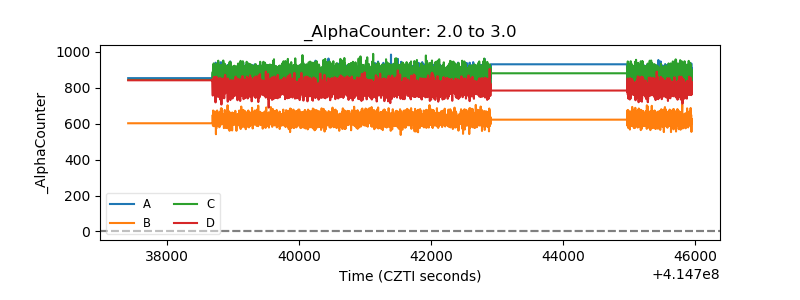 |
| _CPM_Rate |  |
| CZT Counter | 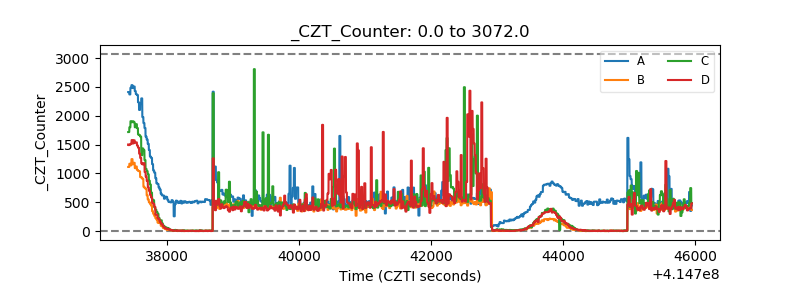 |
| +2.5 Volts monitor | 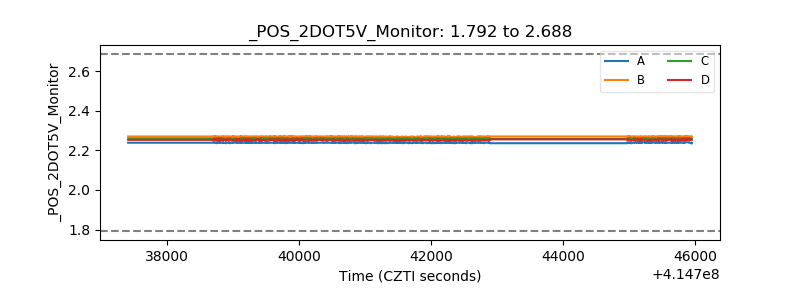 |
| +5 Volts monitor | 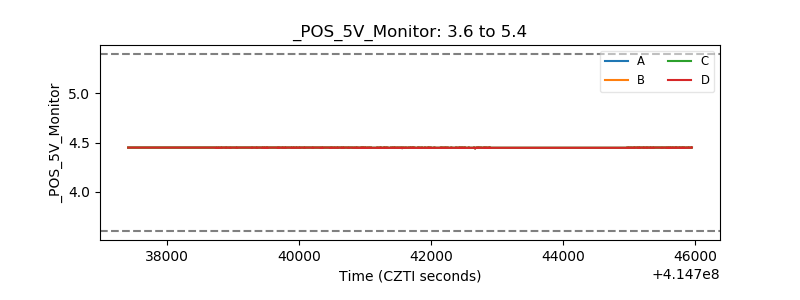 |
| _ROLL_ROT | 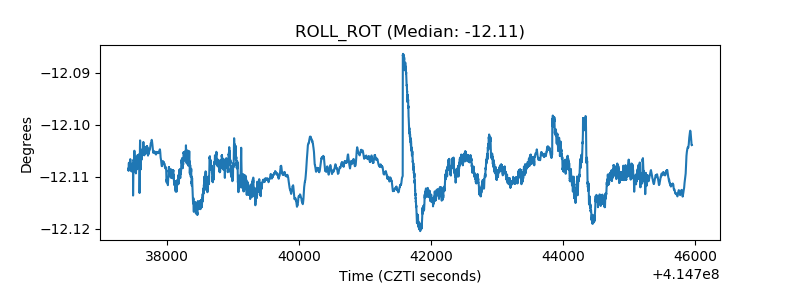 |
| _Roll_DEC | 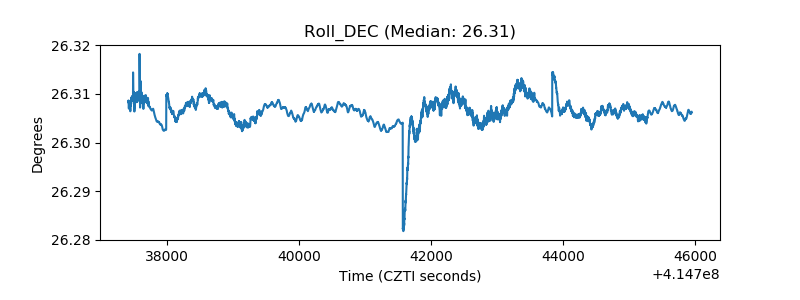 |
| _Roll_RA | 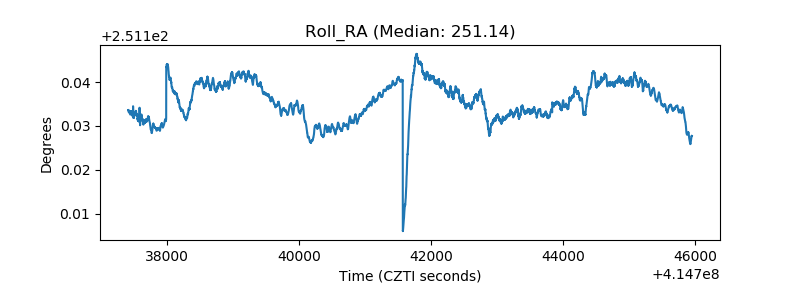 |
| Veto Counter | 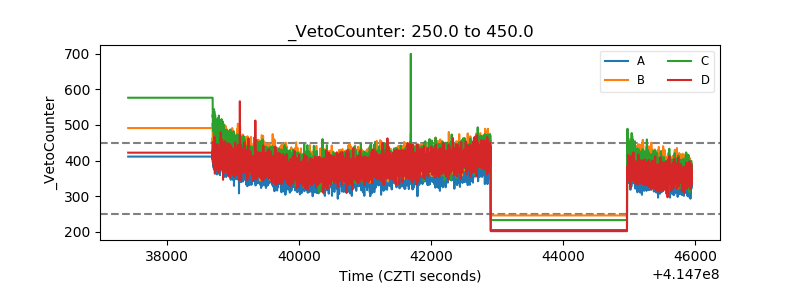 |