| Param | Original file | Final file |
|---|---|---|
| Filename | modeM0/AS1A12_054T03_9000005516_40029cztM0_level2.fits | modeM0/AS1A12_054T03_9000005516_40029cztM0_level2_quad_clean.evt |
| Size (bytes) | 314,449,920 | 88,231,680 |
| Size | 299.9 MB | 84.1 MB |
| Events in quadrant A | 2,961,915 | 587,669 |
| Events in quadrant B | 2,382,532 | 607,662 |
| Events in quadrant C | 2,977,403 | 576,838 |
| Events in quadrant D | 2,901,710 | 525,794 |
| Mode M9 | |||
|---|---|---|---|
| Quadrant | BADHDUFLAG | Total packets | Discarded packets |
| A | 0 | 32 | 0 |
| B | 0 | 32 | 0 |
| C | 0 | 32 | 0 |
| D | 0 | 33 | 0 |
| Mode SS | |||
|---|---|---|---|
| Quadrant | BADHDUFLAG | Total packets | Discarded packets |
| A | 0 | 108 | 0 |
| B | 0 | 108 | 0 |
| C | 0 | 108 | 0 |
| D | 0 | 108 | 0 |
| Mode M0 | |||
|---|---|---|---|
| Quadrant | BADHDUFLAG | Total packets | Discarded packets |
| A | 0 | 11922 | 3 |
| B | 0 | 10887 | 2 |
| C | 0 | 12170 | 2 |
| D | 0 | 12296 | 2 |
| Quadrant | Total seconds | Saturated seconds | Saturation percentage |
|---|---|---|---|
| A | 5341 | 12 | 0.224677% |
| B | 5341 | 8 | 0.149785% |
| C | 5341 | 46 | 0.861262% |
| D | 5341 | 73 | 1.366785% |
Noise dominated data is calculated using 1-second bins in cleaned event files. If a bin has >2000 counts, and if more than 50% of those come from <1% of pixels, then it is considered to be noise-dominated and hence unusable.
| Quadrant | # 1 sec bins | Bins with >0 counts | Bins with >2000 counts | High rate bins dominated by noise | Noise dominated (total time) | Noise dominated (detector-on time) | Marked lightcurve |
|---|---|---|---|---|---|---|---|
| A | 7164 | 5342 | 8 | 8 | 0.11% | 0.15% | 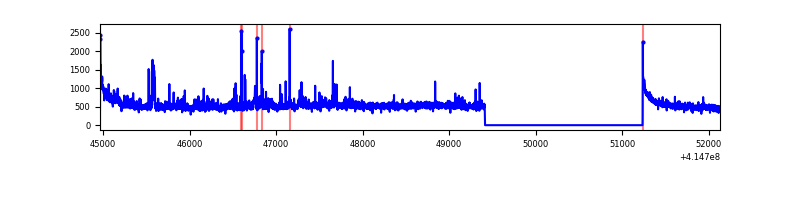 |
| B | 7164 | 5342 | 1 | 1 | 0.01% | 0.02% | 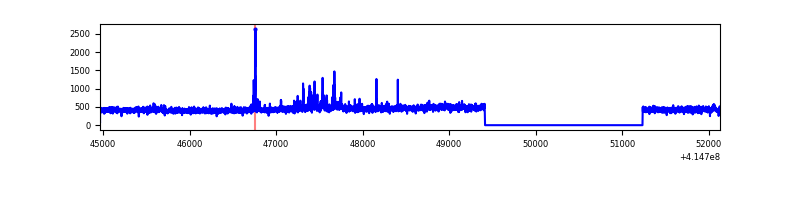 |
| C | 7164 | 5342 | 52 | 52 | 0.73% | 0.97% | 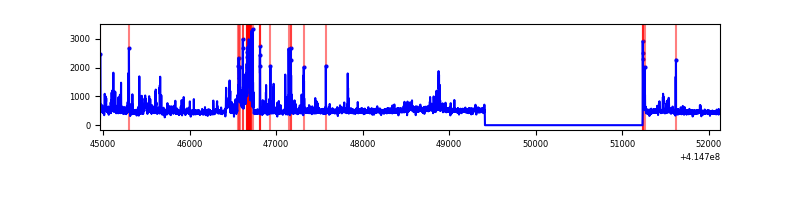 |
| D | 7164 | 5342 | 65 | 65 | 0.91% | 1.22% | 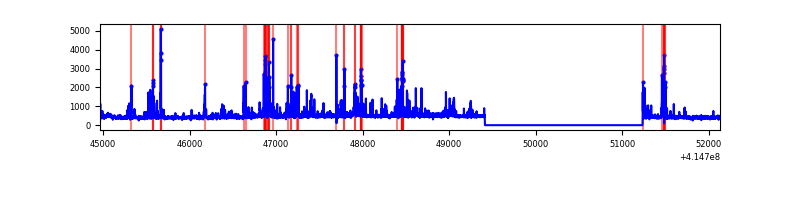 |
Top three noisy pixels from each quadrant. If the there are fewer than three noisy pixels in the level2.evt file, extra rows are filled as -1
| Pixel properties | Quadrant properties | ||||||
|---|---|---|---|---|---|---|---|
| Quadrant | DetID | PixID | Counts | Sigma | Mean | Median | Sigma |
| A | 10 | 83 | 476293 | 4023.16 | 581 | 570 | 118.2 |
| A | 12 | 189 | 96231 | 809.0 | 581 | 570 | 118.2 |
| A | 6 | 10 | 93749 | 788.01 | 581 | 570 | 118.2 |
| B | 4 | 170 | 57394 | 503.64 | 578 | 562 | 112.8 |
| B | 4 | 171 | 26515 | 229.99 | 578 | 562 | 112.8 |
| B | 15 | 85 | 14558 | 124.03 | 578 | 562 | 112.8 |
| C | 14 | 254 | 328568 | 2492.53 | 565 | 568 | 131.6 |
| C | 15 | 214 | 241361 | 1829.83 | 565 | 568 | 131.6 |
| C | 9 | 187 | 168117 | 1273.23 | 565 | 568 | 131.6 |
| D | 1 | 47 | 146969 | 1045.42 | 565 | 549 | 140.1 |
| D | 13 | 249 | 131753 | 936.78 | 565 | 549 | 140.1 |
| D | 2 | 31 | 127609 | 907.2 | 565 | 549 | 140.1 |
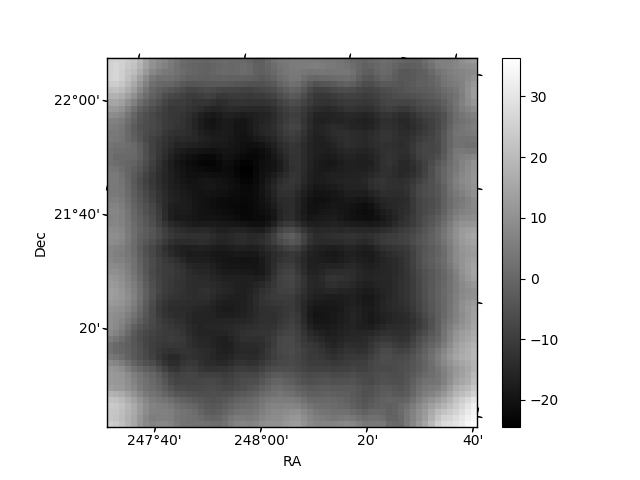
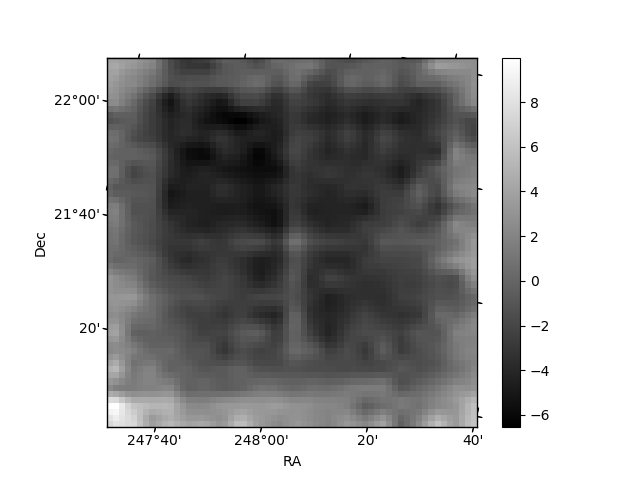
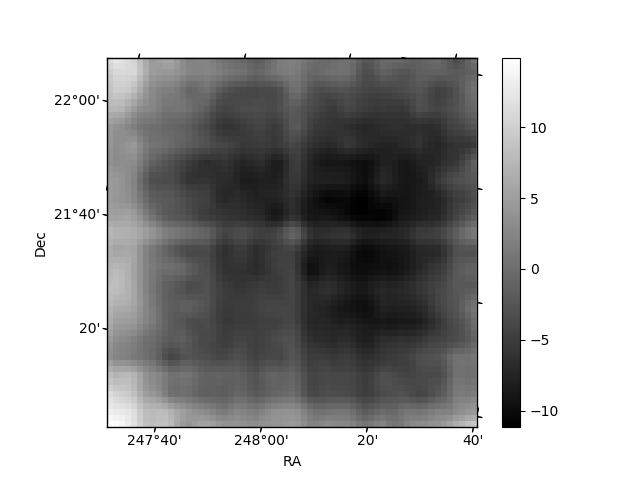
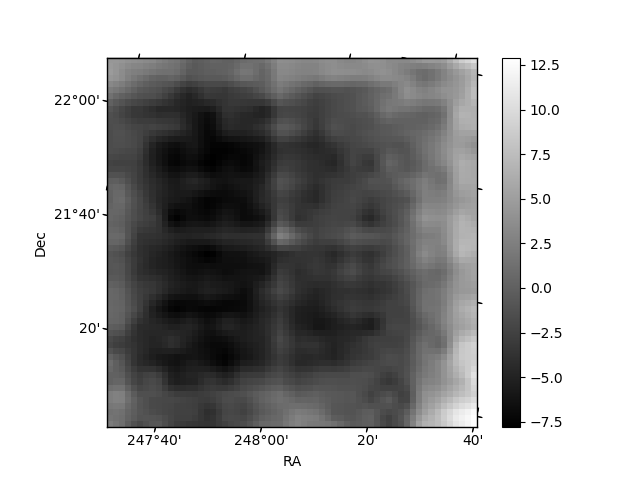
Histogram calculated using DETX and DETY for each event in the final _common_clean file
| Quadrant A | 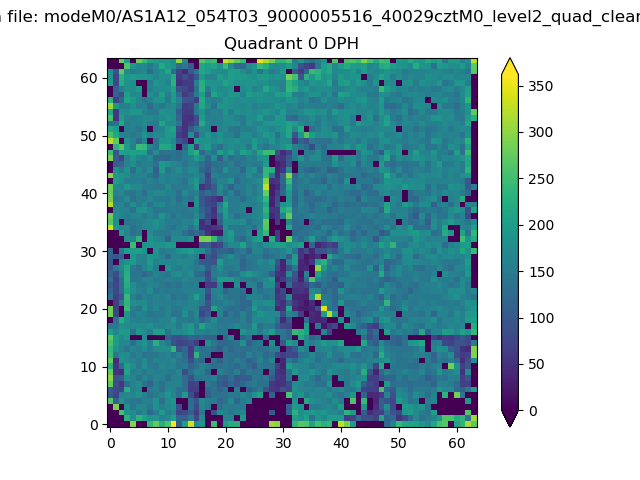 |
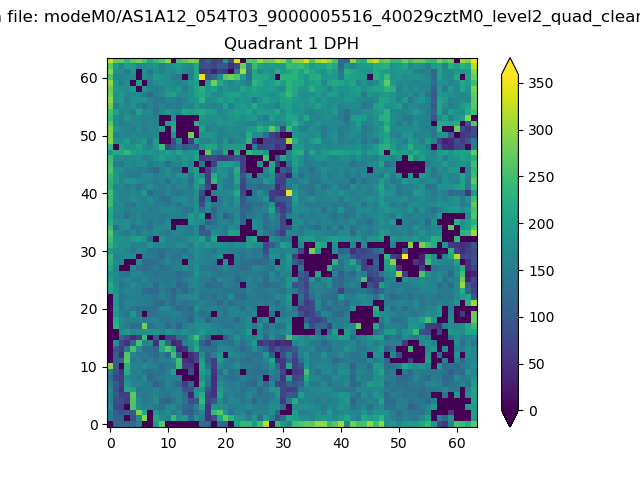 |
Quadrant B |
|---|---|---|---|
| Quadrant D | 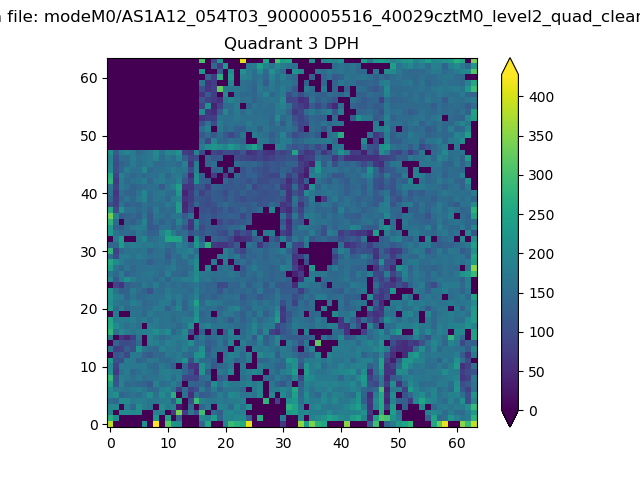 |
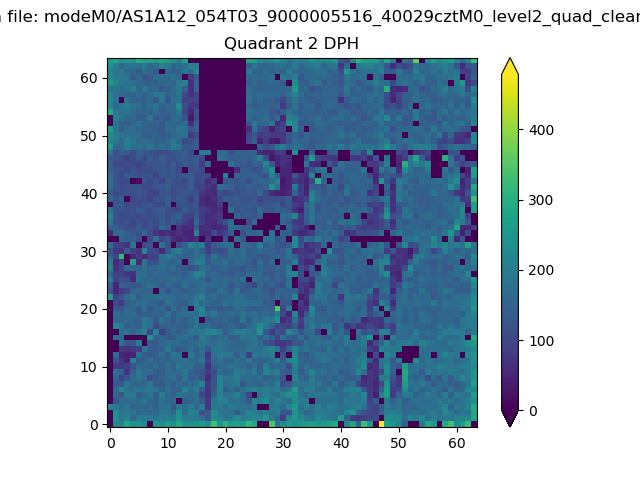 |
Quadrant C |
| Plot type | Count rate plots | Images |
|---|---|---|
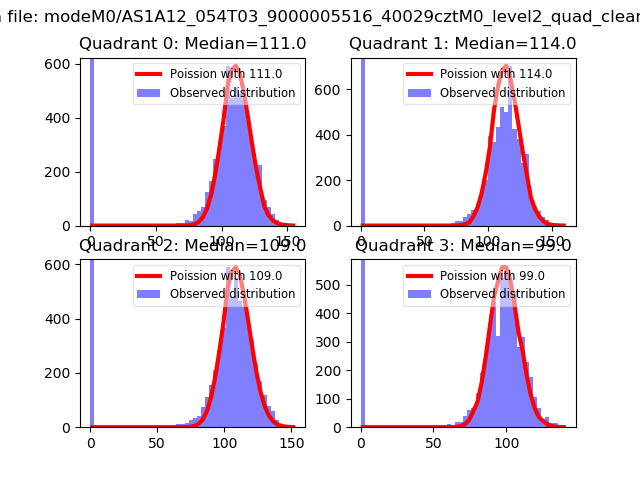
| Comparison with Poisson distribution Blue bars denote a histogram of data divided into 1 sec bins. Red curve is a Poisson curve with rate = median count rate of data. |
 |
 |
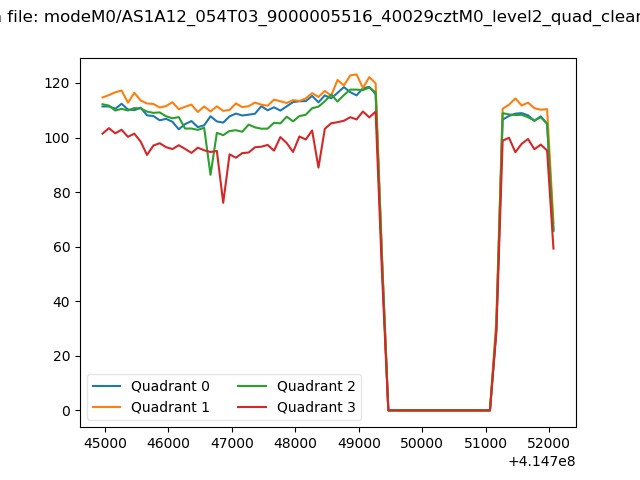
| Quadrant-wise count rates Data is divided into 100 sec bins |
 |
|
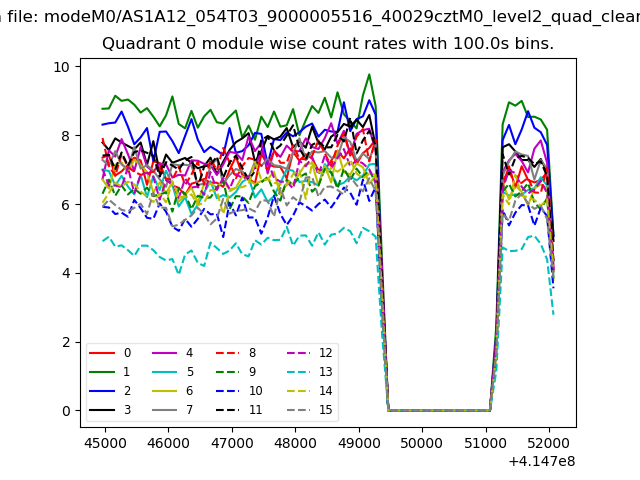
| Module-wise count rates for Quadrant A Data is divided into 100 sec bins |
 |
 |
| Module-wise count rates for Quadrant B Data is divided into 100 sec bins |
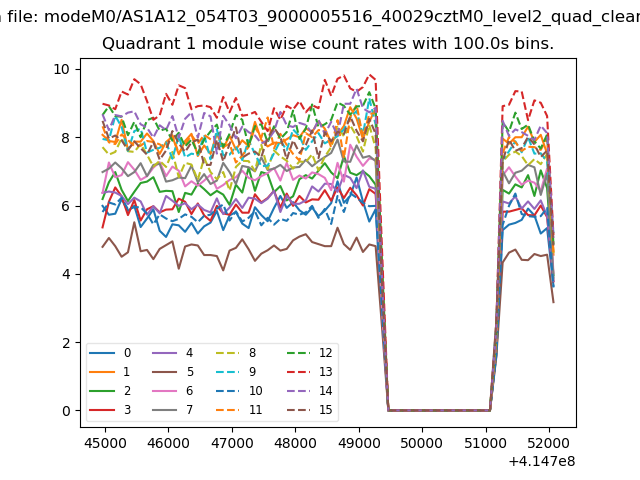 |
 |
| Module-wise count rates for Quadrant C Data is divided into 100 sec bins |
 |
 |
| Module-wise count rates for Quadrant D Data is divided into 100 sec bins |
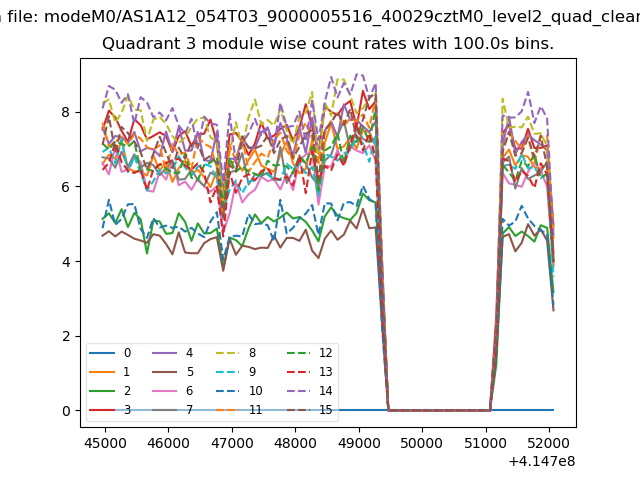 |
 |
| Parameter | Plot |
|---|---|
| CZT HV Monitor |  |
| D_VDD | 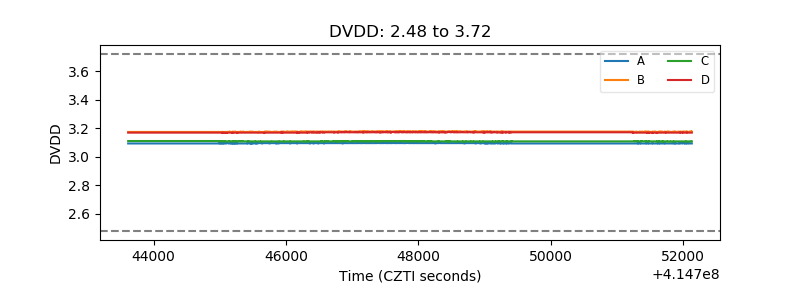 |
| Temperature 1 | 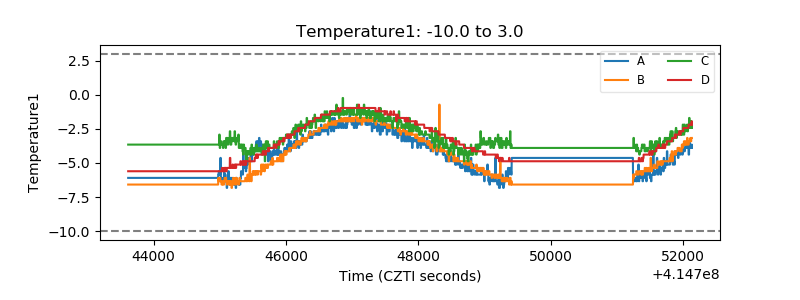 |
| Veto HV Monitor |  |
| Veto LLD | 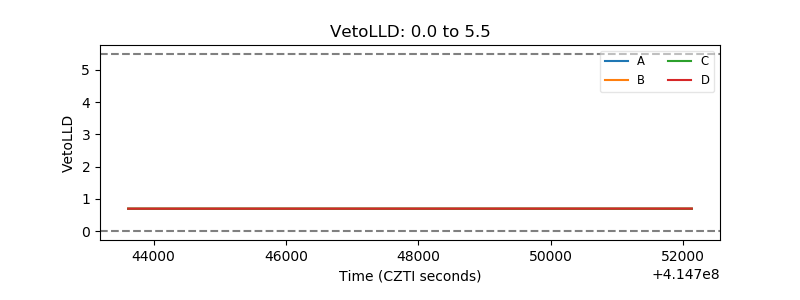 |
| Alpha Counter | 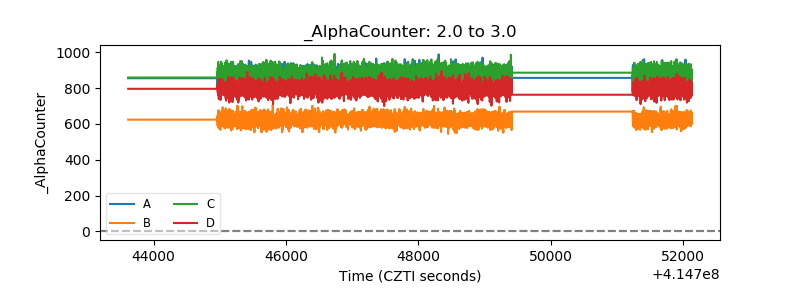 |
| _CPM_Rate | 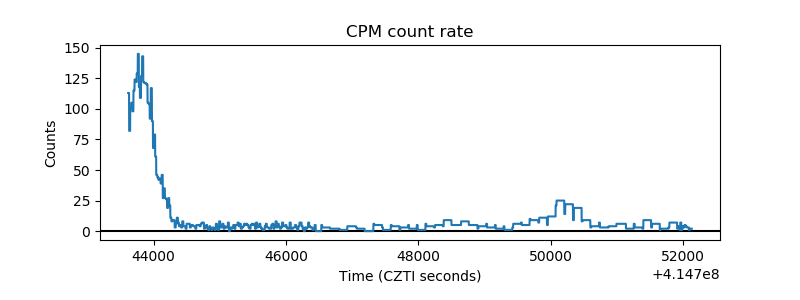 |
| CZT Counter | 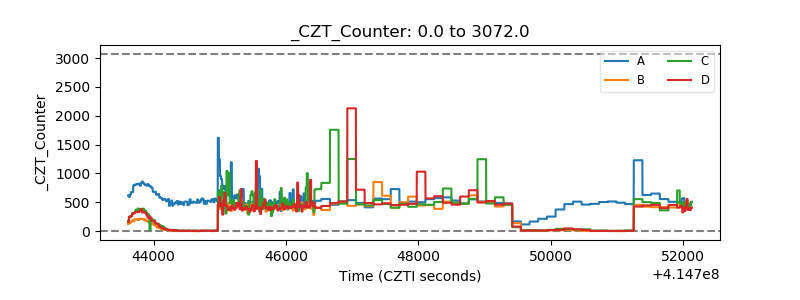 |
| +2.5 Volts monitor | 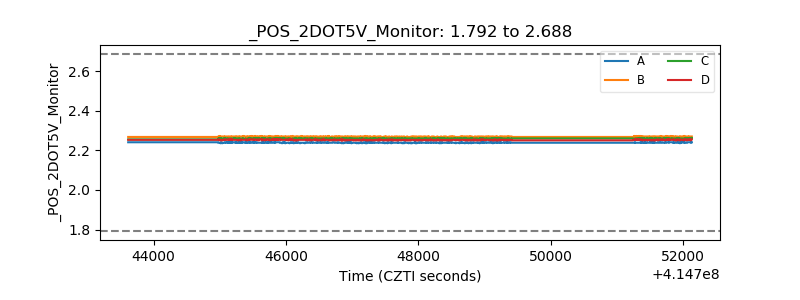 |
| +5 Volts monitor | 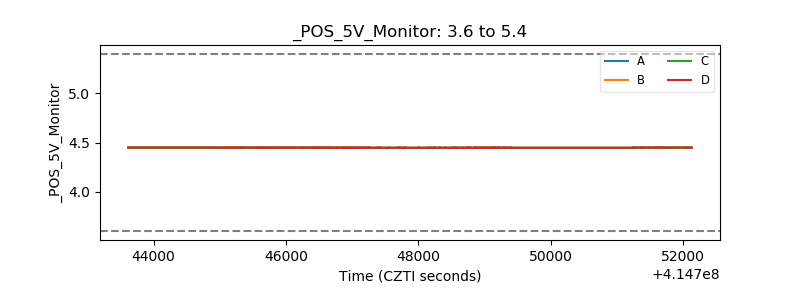 |
| _ROLL_ROT | 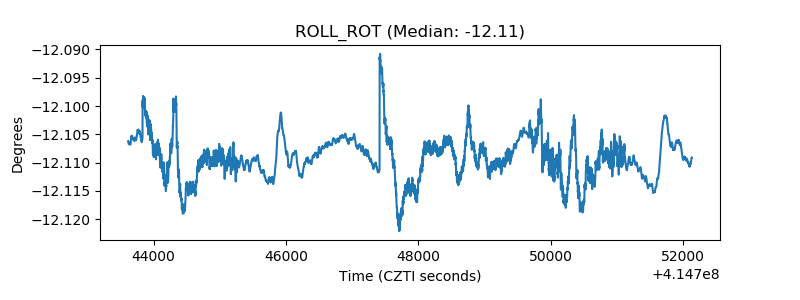 |
| _Roll_DEC | 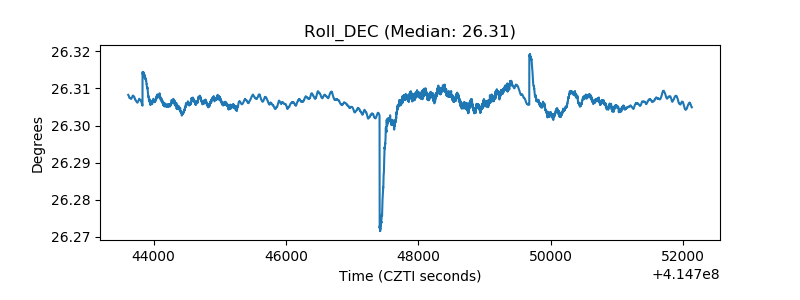 |
| _Roll_RA | 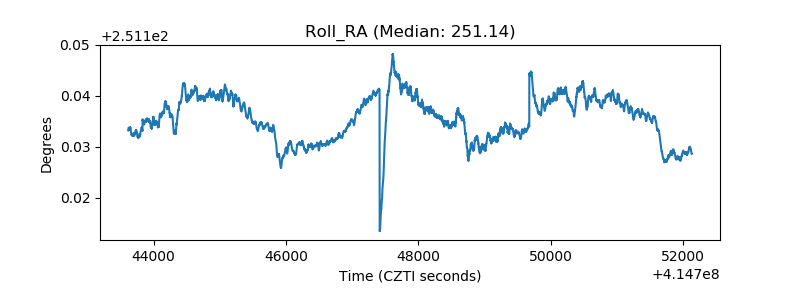 |
| Veto Counter | 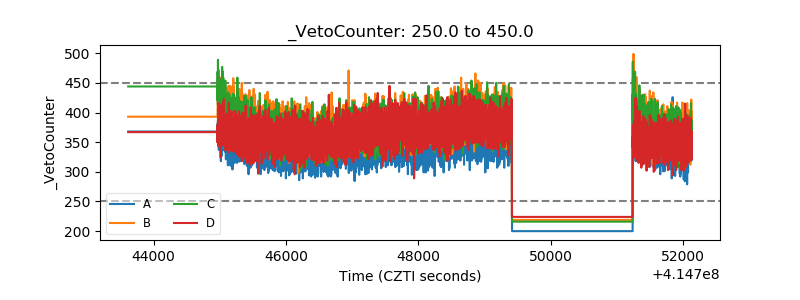 |