| Param | Original file | Final file |
|---|---|---|
| Filename | modeM0/AS1A12_054T03_9000005516_40030cztM0_level2.fits | modeM0/AS1A12_054T03_9000005516_40030cztM0_level2_quad_clean.evt |
| Size (bytes) | 328,141,440 | 86,112,000 |
| Size | 312.9 MB | 82.1 MB |
| Events in quadrant A | 2,821,276 | 576,311 |
| Events in quadrant B | 2,371,680 | 599,441 |
| Events in quadrant C | 3,009,823 | 568,191 |
| Events in quadrant D | 3,526,260 | 488,597 |
| Mode M9 | |||
|---|---|---|---|
| Quadrant | BADHDUFLAG | Total packets | Discarded packets |
| A | 0 | 22 | 0 |
| B | 0 | 22 | 0 |
| C | 0 | 21 | 0 |
| D | 0 | 23 | 0 |
| Mode SS | |||
|---|---|---|---|
| Quadrant | BADHDUFLAG | Total packets | Discarded packets |
| A | 0 | 112 | 0 |
| B | 0 | 108 | 1 |
| C | 0 | 111 | 1 |
| D | 0 | 111 | 2 |
| Mode M0 | |||
|---|---|---|---|
| Quadrant | BADHDUFLAG | Total packets | Discarded packets |
| A | 0 | 11857 | 348 |
| B | 0 | 11092 | 294 |
| C | 0 | 12650 | 329 |
| D | 0 | 14608 | 471 |
| Quadrant | Total seconds | Saturated seconds | Saturation percentage |
|---|---|---|---|
| A | 5343 | 10 | 0.187161% |
| B | 5370 | 4 | 0.074488% |
| C | 5357 | 46 | 0.858690% |
| D | 5329 | 351 | 6.586602% |
Noise dominated data is calculated using 1-second bins in cleaned event files. If a bin has >2000 counts, and if more than 50% of those come from <1% of pixels, then it is considered to be noise-dominated and hence unusable.
| Quadrant | # 1 sec bins | Bins with >0 counts | Bins with >2000 counts | High rate bins dominated by noise | Noise dominated (total time) | Noise dominated (detector-on time) | Marked lightcurve |
|---|---|---|---|---|---|---|---|
| A | 7057 | 5494 | 3 | 3 | 0.04% | 0.05% | 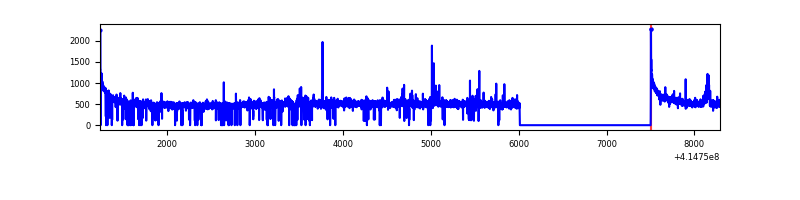 |
| B | 7057 | 5496 | 0 | 0 | 0.00% | 0.00% | 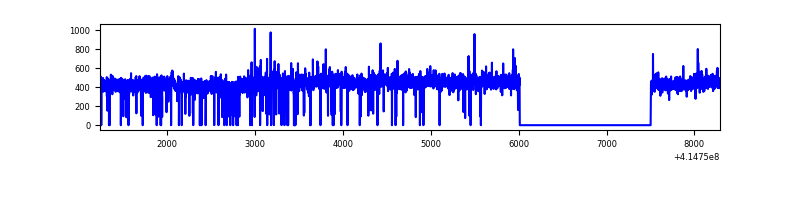 |
| C | 7057 | 5492 | 38 | 38 | 0.54% | 0.69% | 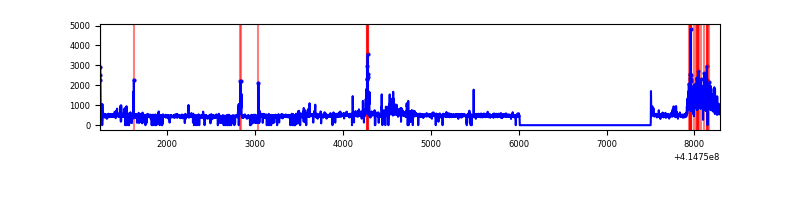 |
| D | 7057 | 5490 | 279 | 279 | 3.95% | 5.08% | 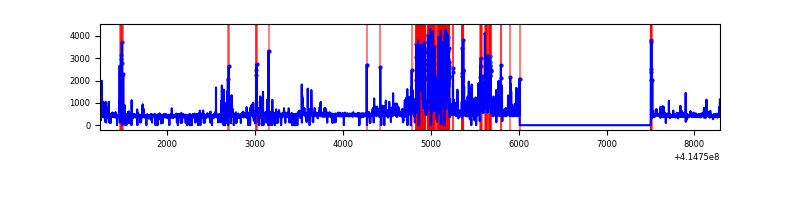 |
Top three noisy pixels from each quadrant. If the there are fewer than three noisy pixels in the level2.evt file, extra rows are filled as -1
| Pixel properties | Quadrant properties | ||||||
|---|---|---|---|---|---|---|---|
| Quadrant | DetID | PixID | Counts | Sigma | Mean | Median | Sigma |
| A | 10 | 83 | 457156 | 3855.07 | 582 | 571 | 118.4 |
| A | 12 | 189 | 46840 | 390.66 | 582 | 571 | 118.4 |
| A | 6 | 10 | 21867 | 179.81 | 582 | 571 | 118.4 |
| B | 0 | 230 | 22279 | 191.22 | 582 | 566 | 113.5 |
| B | 4 | 170 | 20842 | 178.57 | 582 | 566 | 113.5 |
| B | 12 | 111 | 14189 | 119.98 | 582 | 566 | 113.5 |
| C | 9 | 187 | 478452 | 3542.91 | 569 | 572 | 134.9 |
| C | 15 | 214 | 240422 | 1778.2 | 569 | 572 | 134.9 |
| C | 14 | 254 | 39428 | 288.07 | 569 | 572 | 134.9 |
| D | 1 | 47 | 983660 | 7299.7 | 545 | 529 | 134.7 |
| D | 2 | 31 | 133226 | 985.27 | 545 | 529 | 134.7 |
| D | 13 | 249 | 105288 | 777.83 | 545 | 529 | 134.7 |
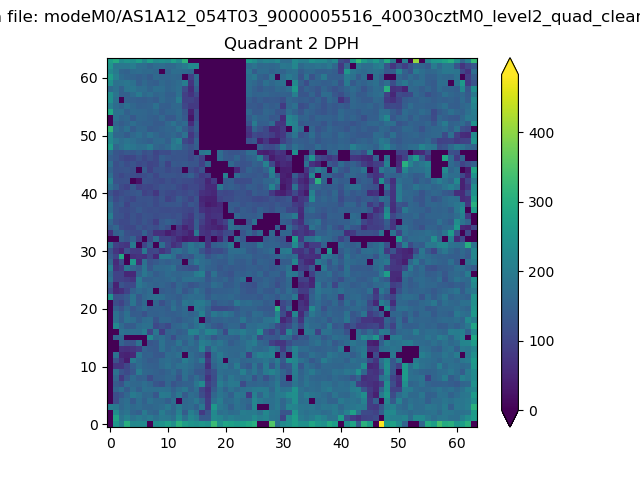
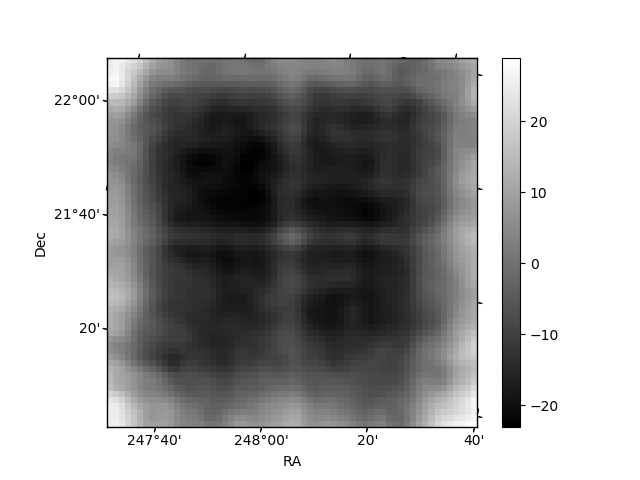
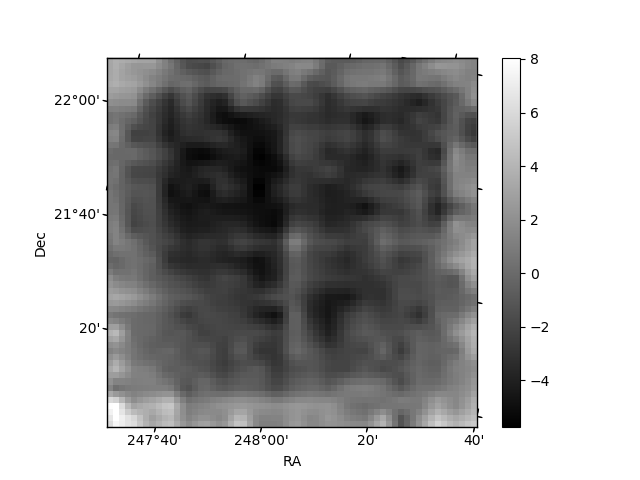
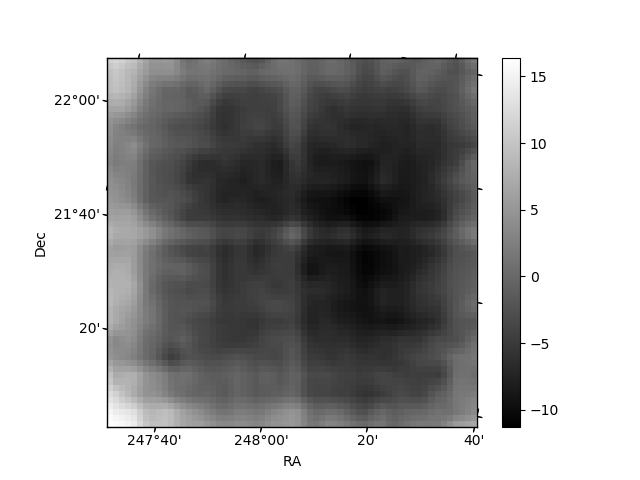
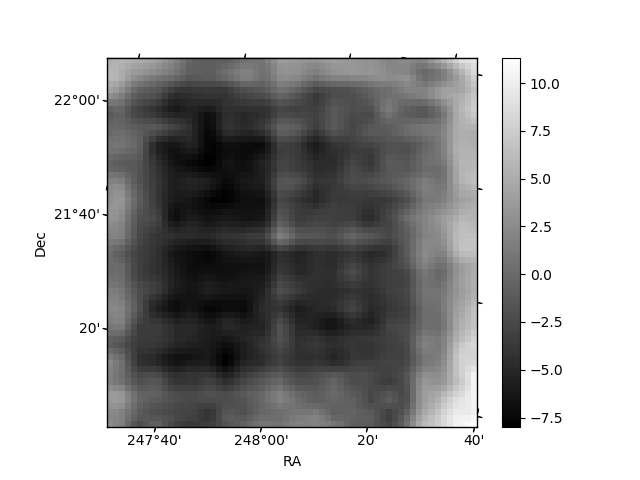
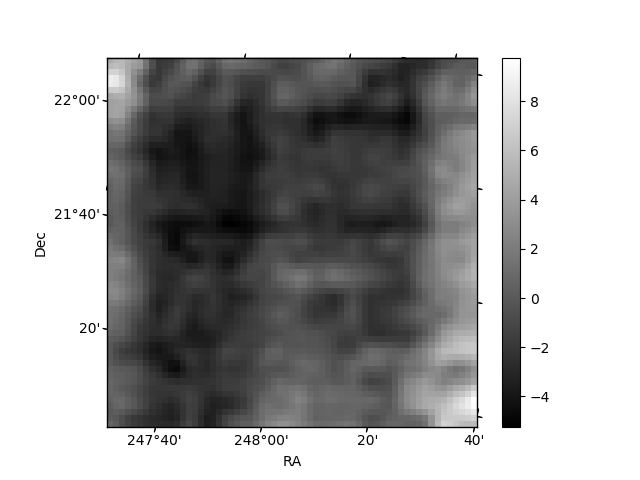
Histogram calculated using DETX and DETY for each event in the final _common_clean file
| Quadrant A | 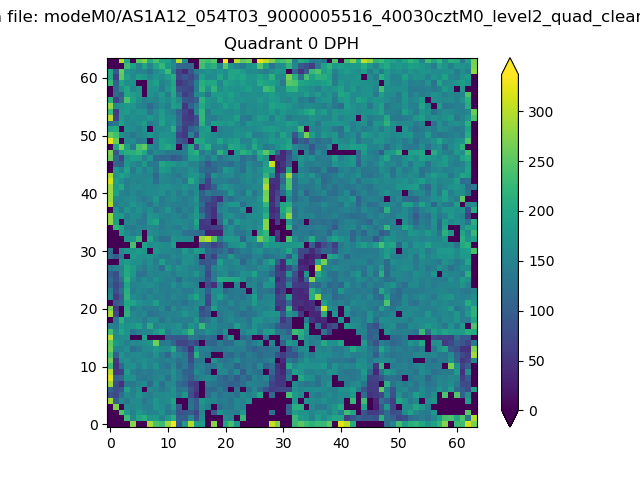 |
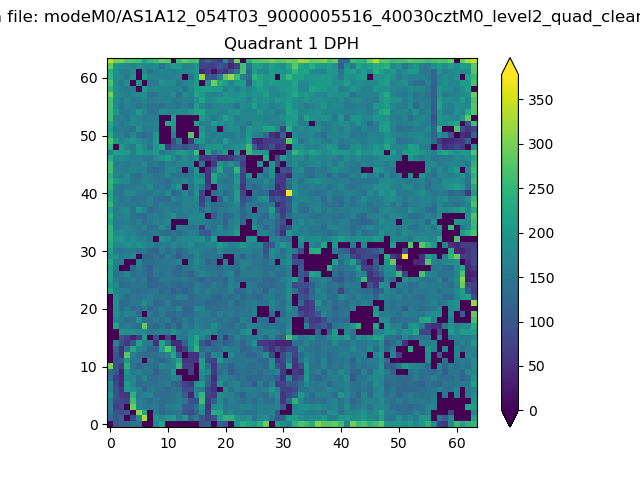 |
Quadrant B |
|---|---|---|---|
| Quadrant D | 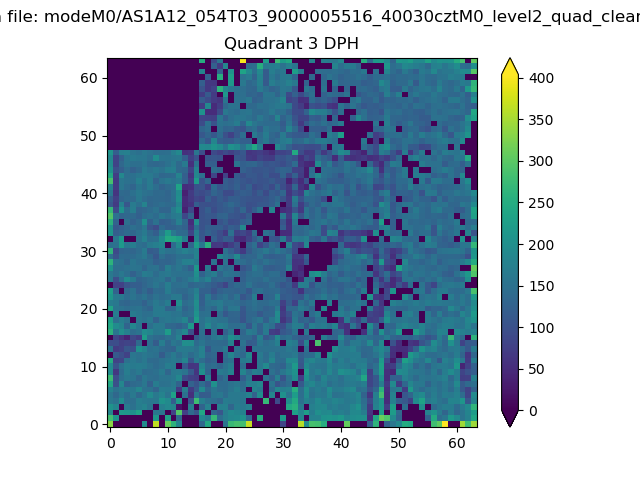 |
 |
Quadrant C |
| Plot type | Count rate plots | Images |
|---|---|---|
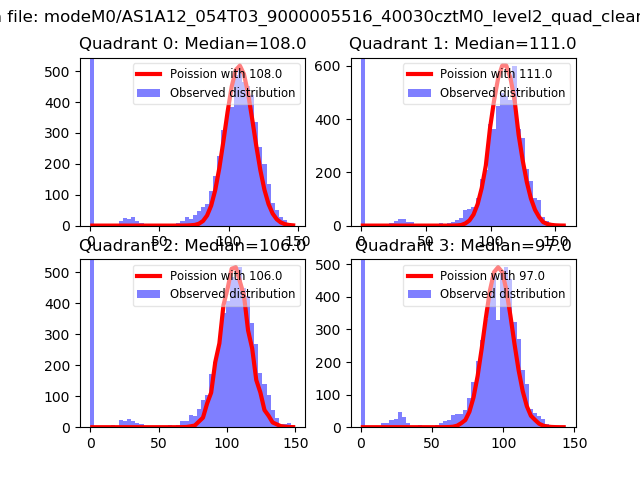
| Comparison with Poisson distribution Blue bars denote a histogram of data divided into 1 sec bins. Red curve is a Poisson curve with rate = median count rate of data. |
 |
 |
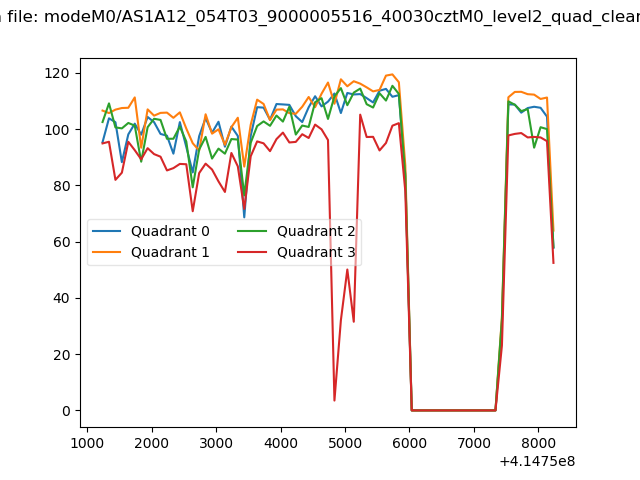
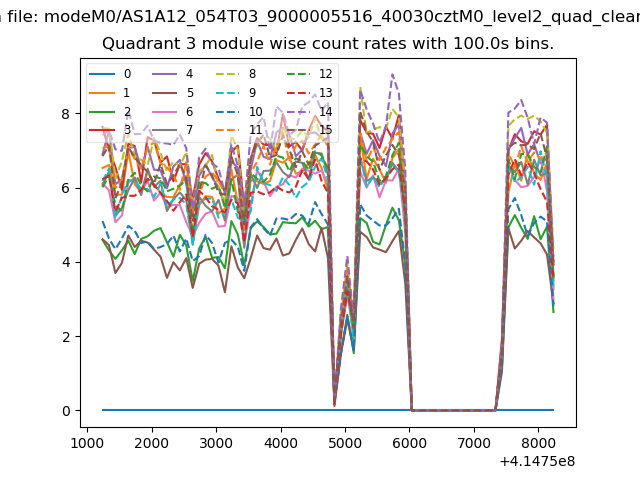
| Quadrant-wise count rates Data is divided into 100 sec bins |
 |
|
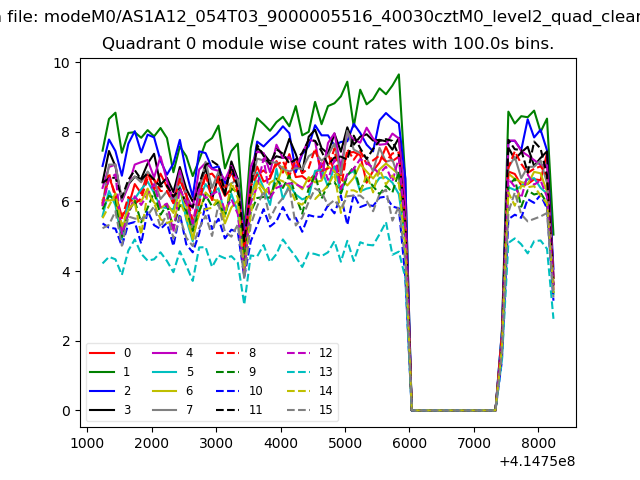
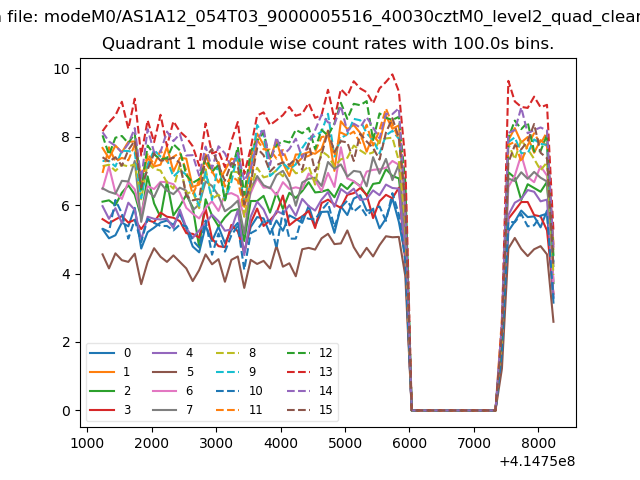
| Module-wise count rates for Quadrant A Data is divided into 100 sec bins |
 |
 |
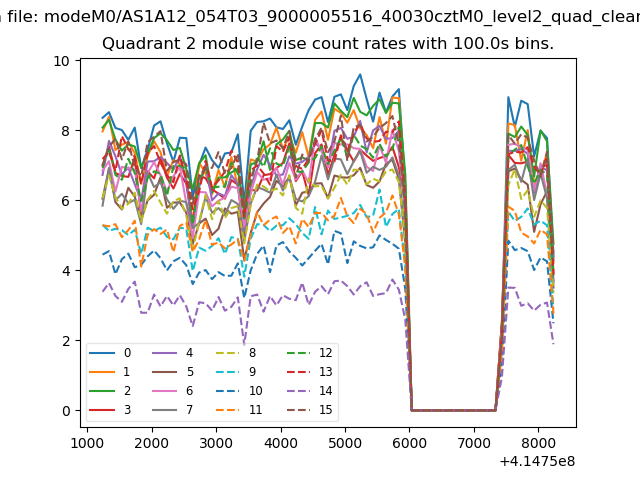
| Module-wise count rates for Quadrant B Data is divided into 100 sec bins |
 |
 |
| Module-wise count rates for Quadrant C Data is divided into 100 sec bins |
 |
 |
| Module-wise count rates for Quadrant D Data is divided into 100 sec bins |
 |
 |
| Parameter | Plot |
|---|---|
| CZT HV Monitor | 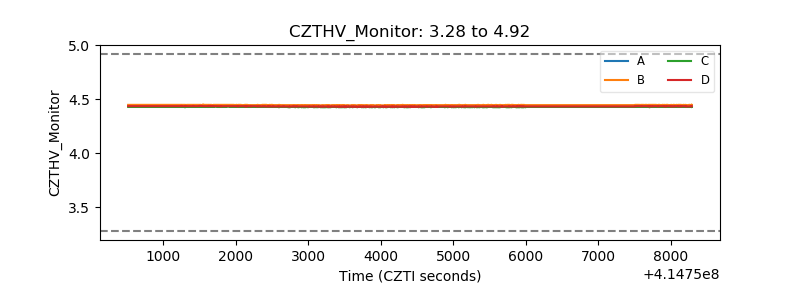 |
| D_VDD | 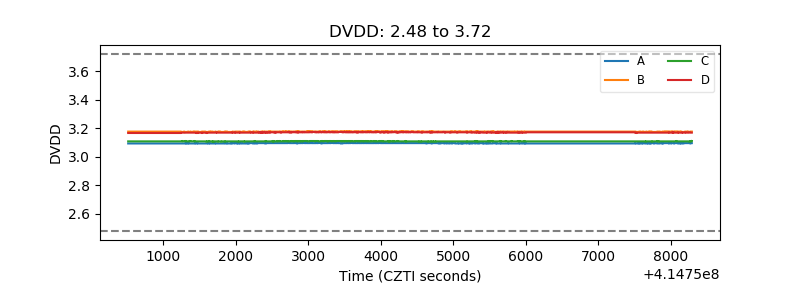 |
| Temperature 1 | 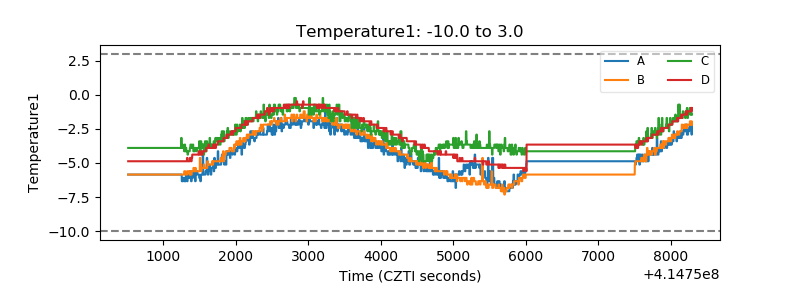 |
| Veto HV Monitor | 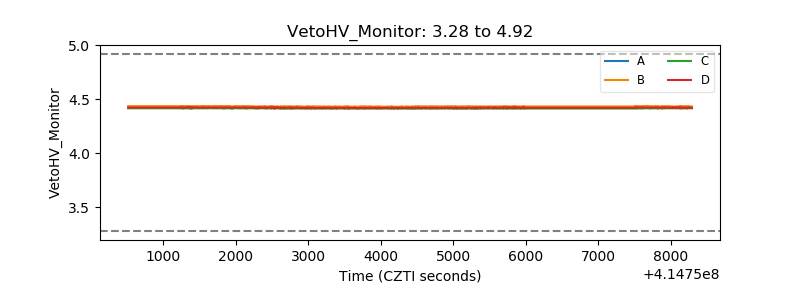 |
| Veto LLD | 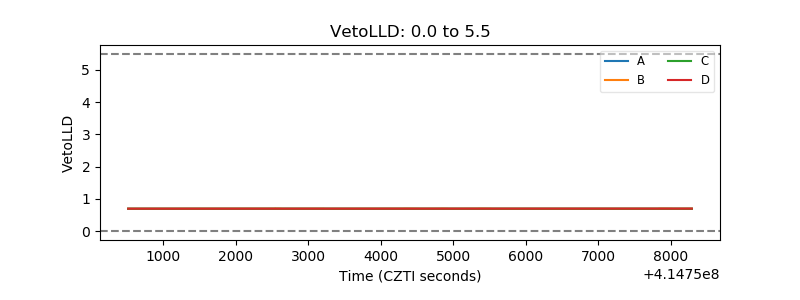 |
| Alpha Counter | 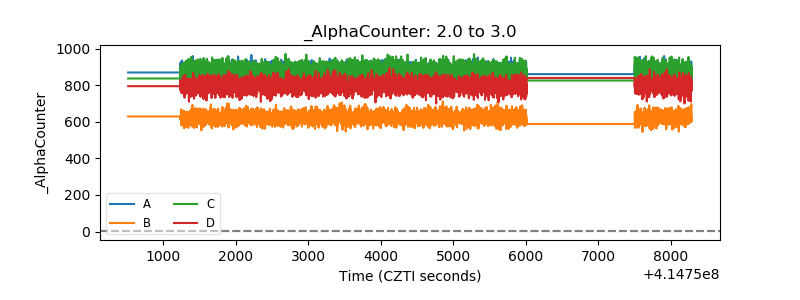 |
| _CPM_Rate | 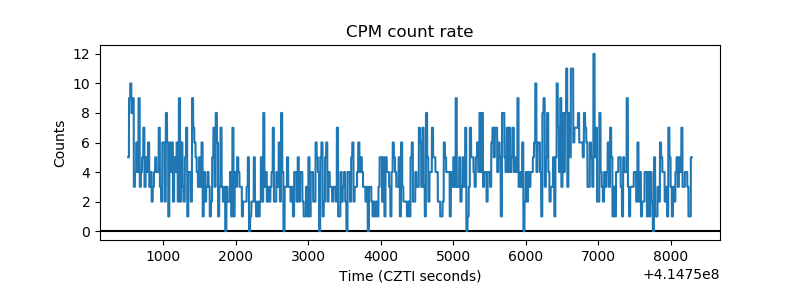 |
| CZT Counter | 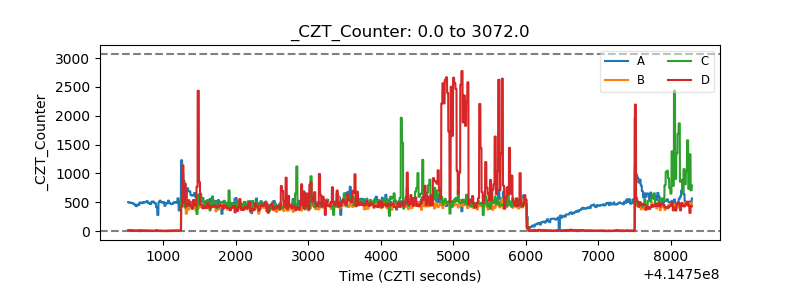 |
| +2.5 Volts monitor | 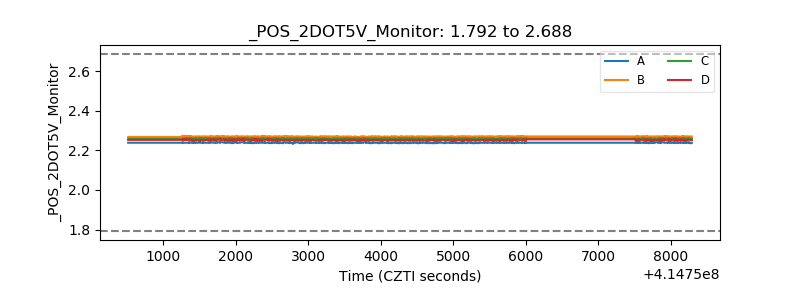 |
| +5 Volts monitor |  |
| _ROLL_ROT | 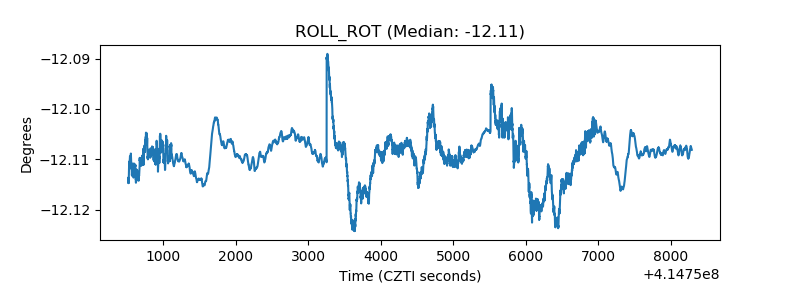 |
| _Roll_DEC | 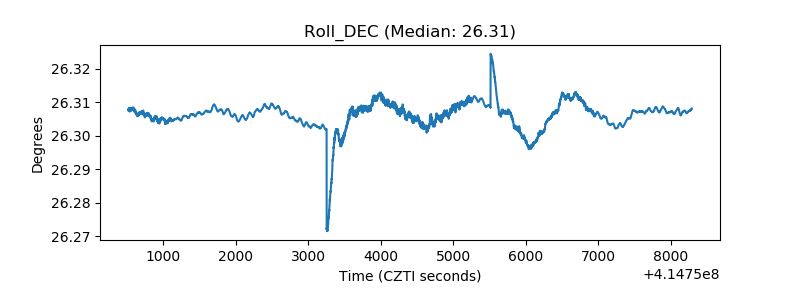 |
| _Roll_RA | 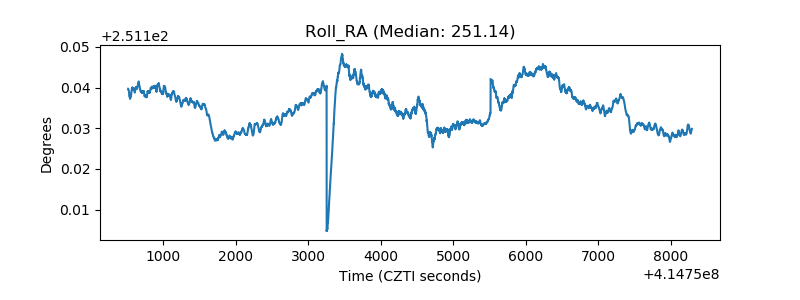 |
| Veto Counter | 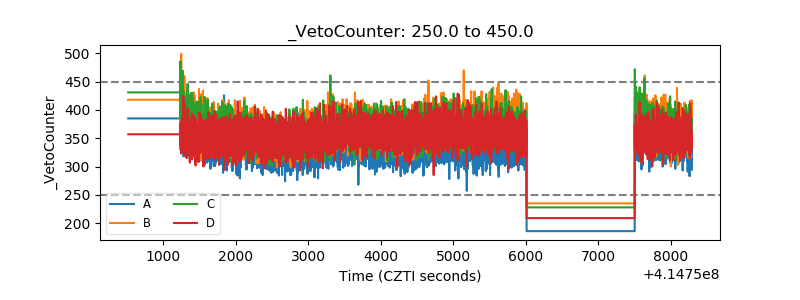 |