| Param | Original file | Final file |
|---|---|---|
| Filename | modeM0/AS1A12_054T03_9000005516_40032cztM0_level2.fits | modeM0/AS1A12_054T03_9000005516_40032cztM0_level2_quad_clean.evt |
| Size (bytes) | 372,150,720 | 97,444,800 |
| Size | 354.9 MB | 92.9 MB |
| Events in quadrant A | 3,221,787 | 650,670 |
| Events in quadrant B | 2,685,114 | 669,448 |
| Events in quadrant C | 3,607,686 | 632,234 |
| Events in quadrant D | 3,791,447 | 576,533 |
| Mode M9 | |||
|---|---|---|---|
| Quadrant | BADHDUFLAG | Total packets | Discarded packets |
| A | 0 | 20 | 0 |
| B | 0 | 20 | 0 |
| C | 0 | 20 | 0 |
| D | 0 | 21 | 0 |
| Mode SS | |||
|---|---|---|---|
| Quadrant | BADHDUFLAG | Total packets | Discarded packets |
| A | 0 | 122 | 0 |
| B | 0 | 122 | 0 |
| C | 0 | 122 | 0 |
| D | 0 | 122 | 0 |
| Mode M0 | |||
|---|---|---|---|
| Quadrant | BADHDUFLAG | Total packets | Discarded packets |
| A | 0 | 13238 | 2 |
| B | 0 | 12177 | 1 |
| C | 0 | 14569 | 1 |
| D | 0 | 15407 | 1 |
| Quadrant | Total seconds | Saturated seconds | Saturation percentage |
|---|---|---|---|
| A | 6037 | 15 | 0.248468% |
| B | 6037 | 12 | 0.198774% |
| C | 6037 | 72 | 1.192645% |
| D | 6037 | 153 | 2.534371% |
Noise dominated data is calculated using 1-second bins in cleaned event files. If a bin has >2000 counts, and if more than 50% of those come from <1% of pixels, then it is considered to be noise-dominated and hence unusable.
| Quadrant | # 1 sec bins | Bins with >0 counts | Bins with >2000 counts | High rate bins dominated by noise | Noise dominated (total time) | Noise dominated (detector-on time) | Marked lightcurve |
|---|---|---|---|---|---|---|---|
| A | 7320 | 6038 | 5 | 5 | 0.07% | 0.08% | 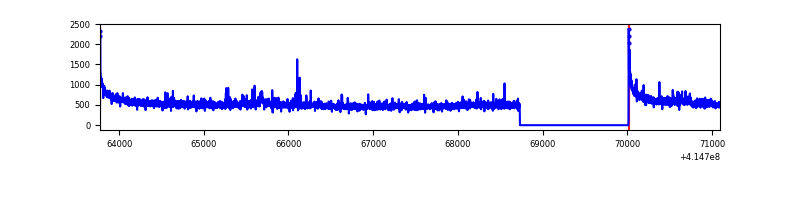 |
| B | 7320 | 6038 | 0 | 0 | 0.00% | 0.00% | 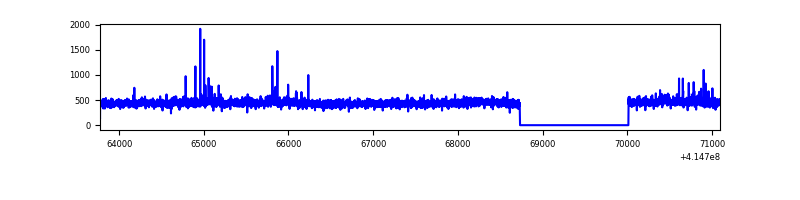 |
| C | 7320 | 6038 | 55 | 55 | 0.75% | 0.91% | 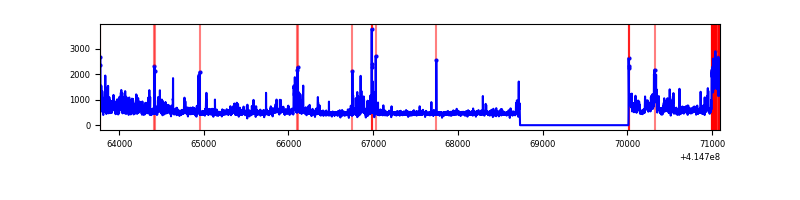 |
| D | 7320 | 6038 | 128 | 128 | 1.75% | 2.12% | 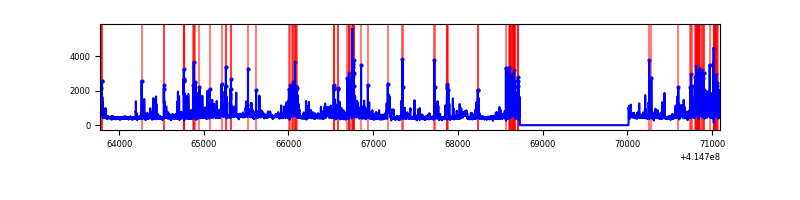 |
Top three noisy pixels from each quadrant. If the there are fewer than three noisy pixels in the level2.evt file, extra rows are filled as -1
| Pixel properties | Quadrant properties | ||||||
|---|---|---|---|---|---|---|---|
| Quadrant | DetID | PixID | Counts | Sigma | Mean | Median | Sigma |
| A | 10 | 83 | 515544 | 3840.67 | 659 | 646 | 134.1 |
| A | 15 | 191 | 51510 | 379.4 | 659 | 646 | 134.1 |
| A | 6 | 10 | 49800 | 366.64 | 659 | 646 | 134.1 |
| B | 4 | 171 | 30172 | 230.3 | 655 | 637 | 128.2 |
| B | 0 | 230 | 22197 | 168.12 | 655 | 637 | 128.2 |
| B | 0 | 245 | 18383 | 138.38 | 655 | 637 | 128.2 |
| C | 9 | 187 | 754477 | 4978.83 | 643 | 646 | 151.4 |
| C | 15 | 214 | 269053 | 1772.75 | 643 | 646 | 151.4 |
| C | 14 | 254 | 41940 | 272.73 | 643 | 646 | 151.4 |
| D | 1 | 47 | 538527 | 3385.02 | 639 | 619 | 158.9 |
| D | 12 | 227 | 441811 | 2776.39 | 639 | 619 | 158.9 |
| D | 2 | 250 | 137818 | 863.38 | 639 | 619 | 158.9 |
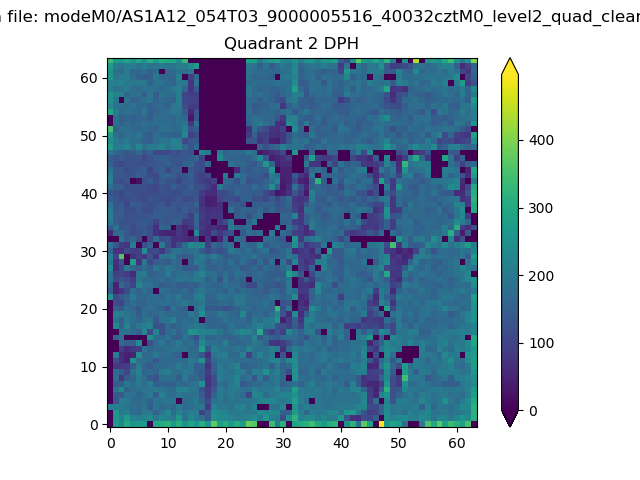
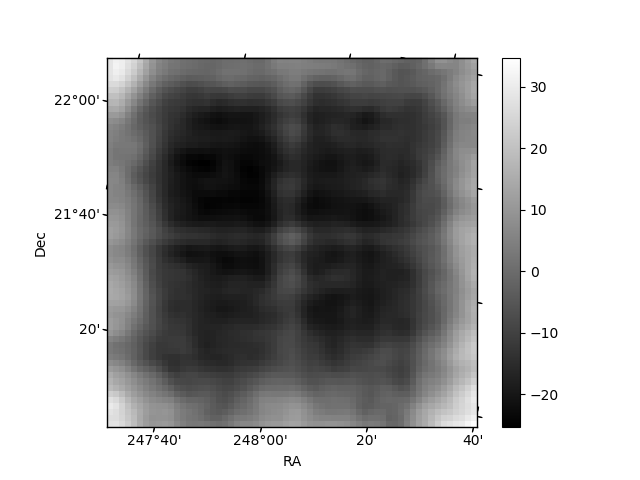
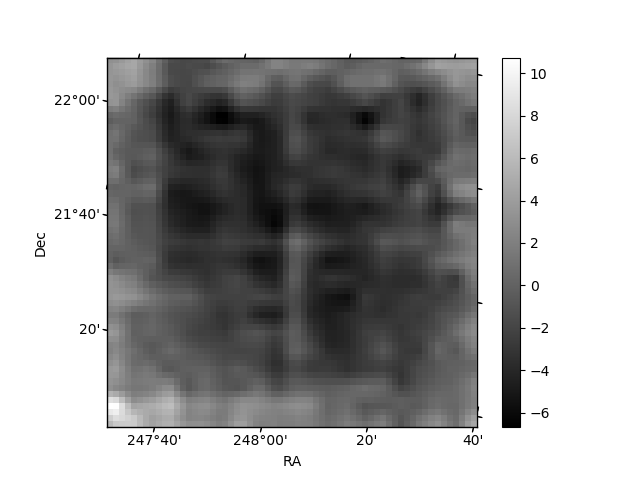
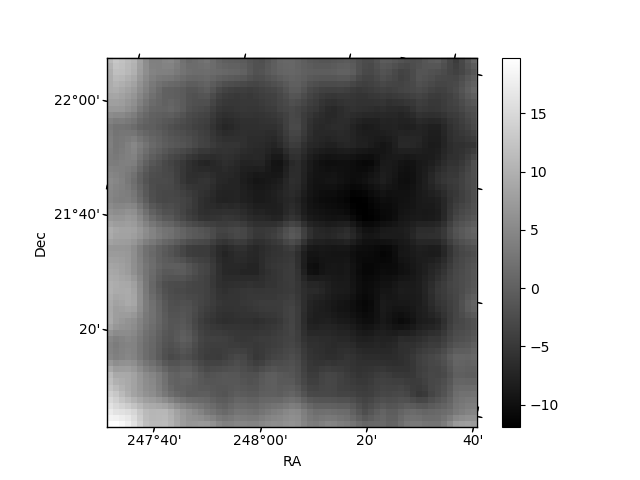
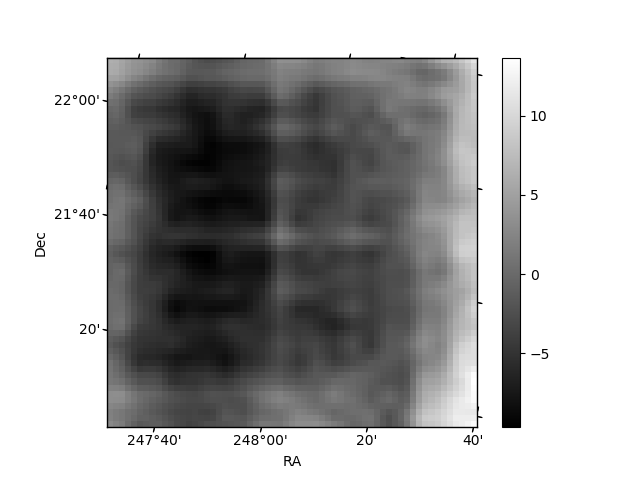
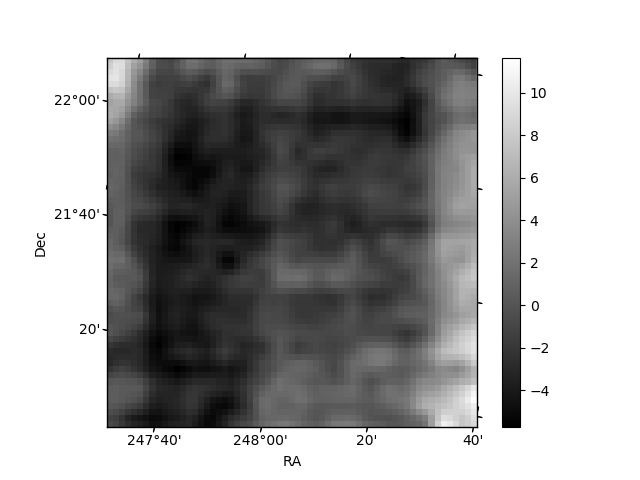
Histogram calculated using DETX and DETY for each event in the final _common_clean file
| Quadrant A | 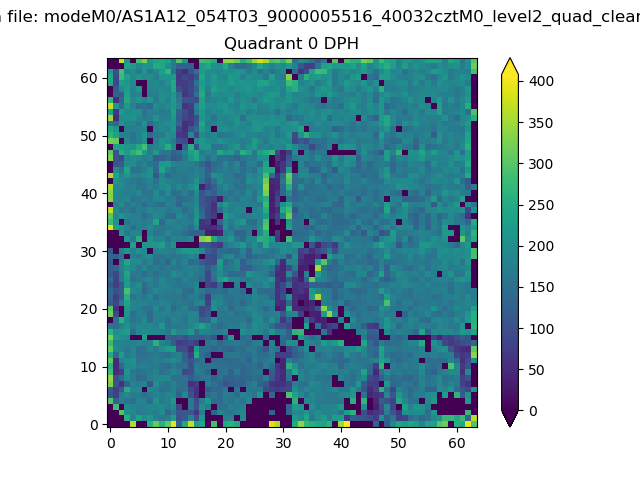 |
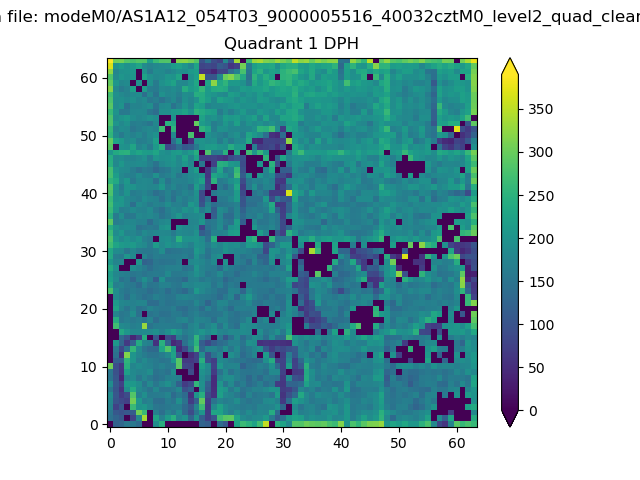 |
Quadrant B |
|---|---|---|---|
| Quadrant D | 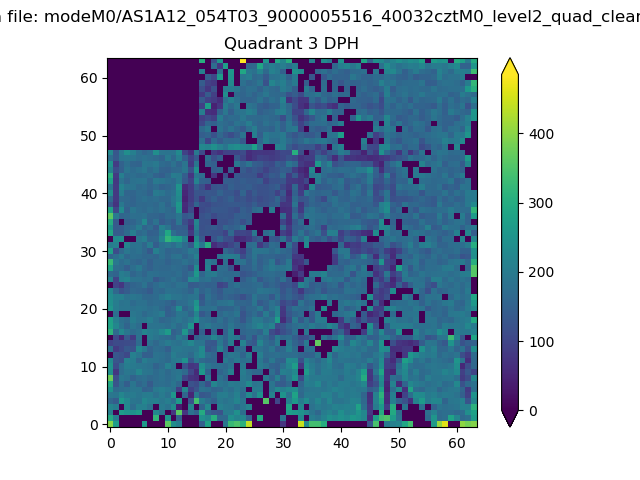 |
 |
Quadrant C |
| Plot type | Count rate plots | Images |
|---|---|---|
| Comparison with Poisson distribution Blue bars denote a histogram of data divided into 1 sec bins. Red curve is a Poisson curve with rate = median count rate of data. |
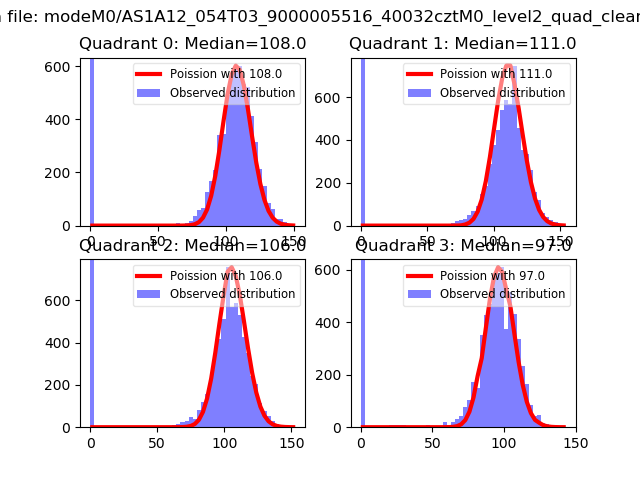 |
 |
| Quadrant-wise count rates Data is divided into 100 sec bins |
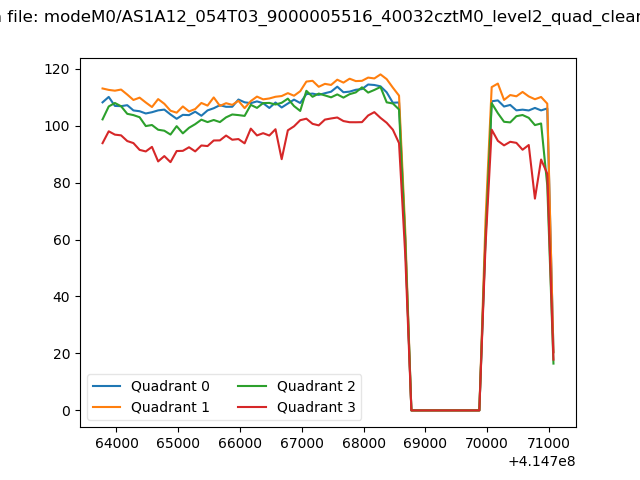 |
|
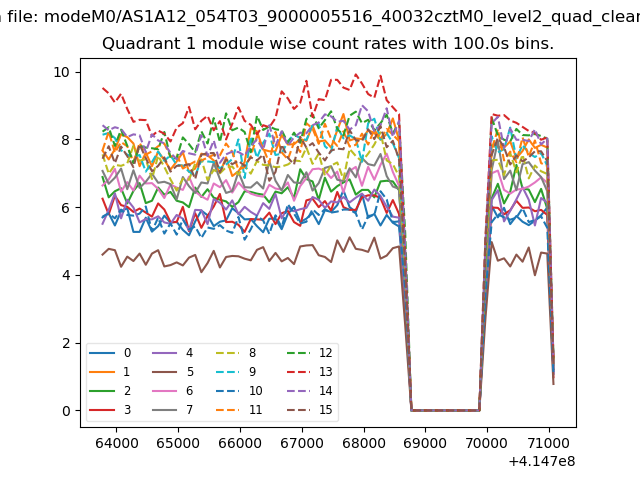
| Module-wise count rates for Quadrant A Data is divided into 100 sec bins |
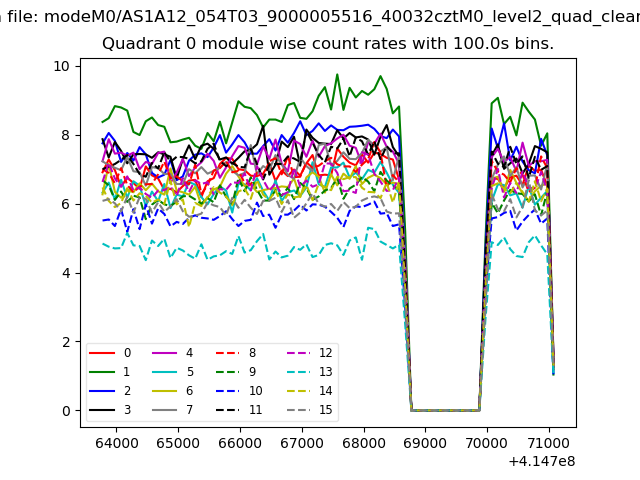 |
 |
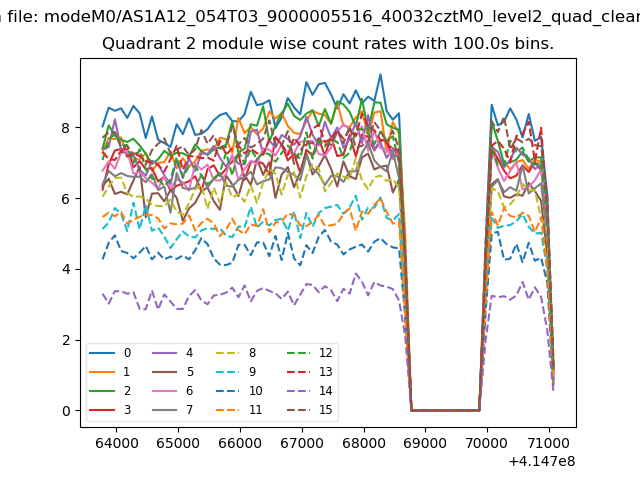
| Module-wise count rates for Quadrant B Data is divided into 100 sec bins |
 |
 |
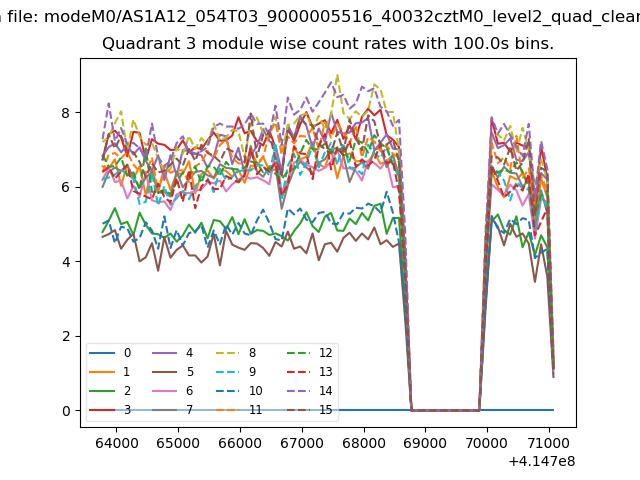
| Module-wise count rates for Quadrant C Data is divided into 100 sec bins |
 |
 |
| Module-wise count rates for Quadrant D Data is divided into 100 sec bins |
 |
 |
| Parameter | Plot |
|---|---|
| CZT HV Monitor | 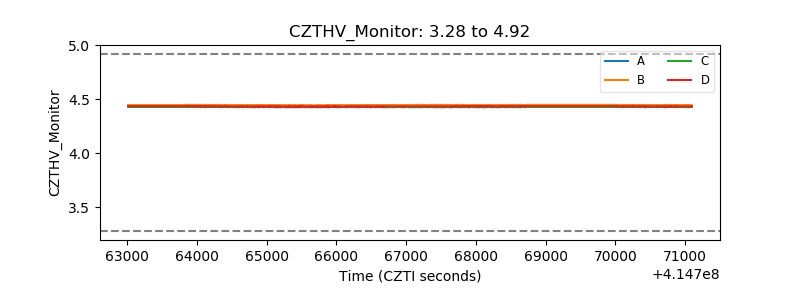 |
| D_VDD | 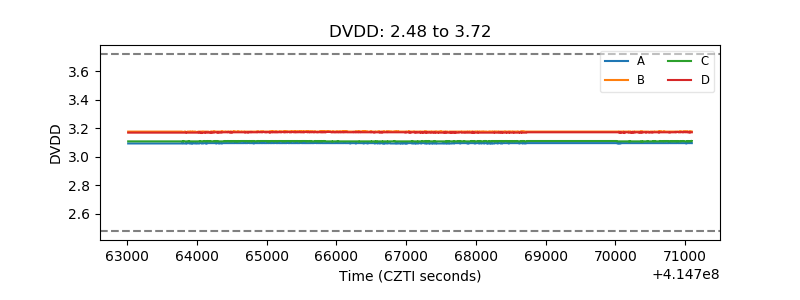 |
| Temperature 1 | 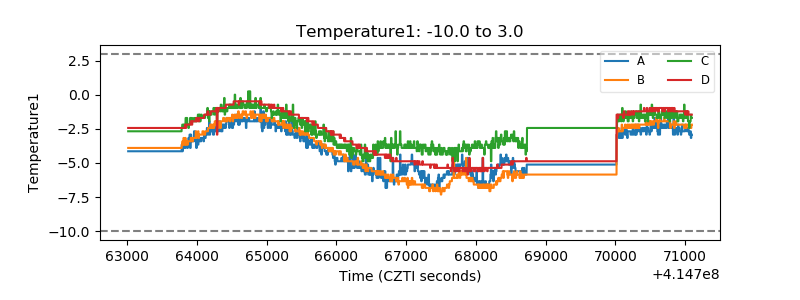 |
| Veto HV Monitor | 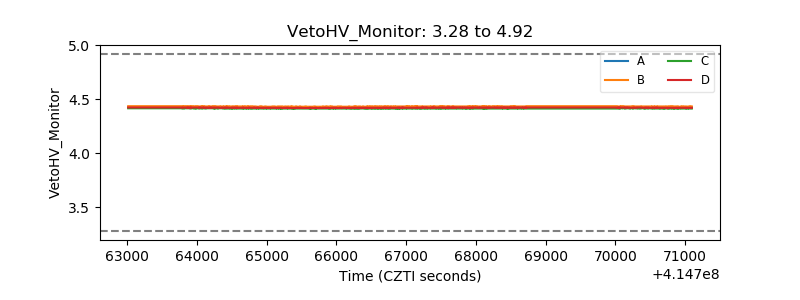 |
| Veto LLD | 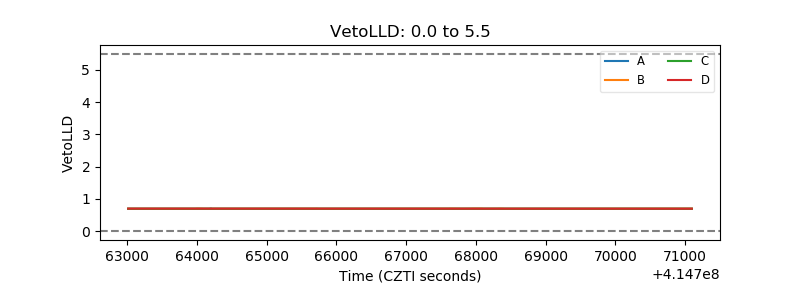 |
| Alpha Counter | 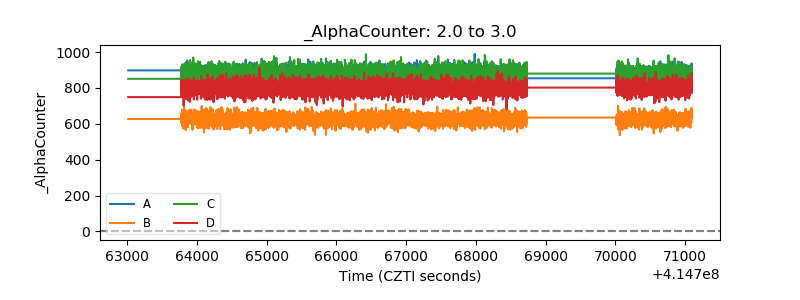 |
| _CPM_Rate | 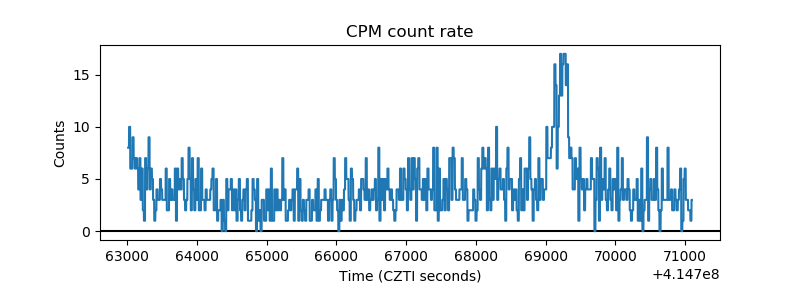 |
| CZT Counter | 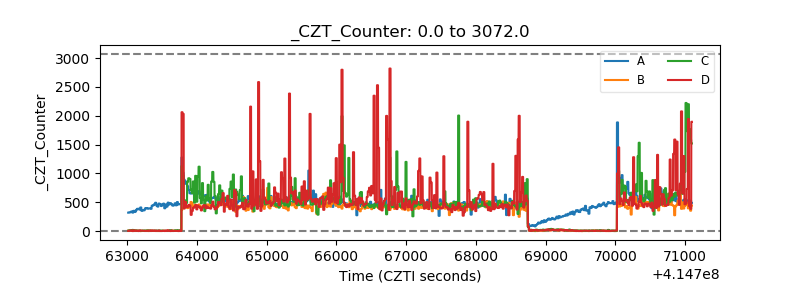 |
| +2.5 Volts monitor | 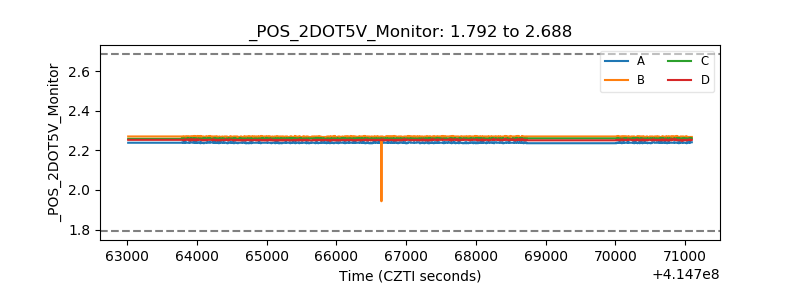 |
| +5 Volts monitor | 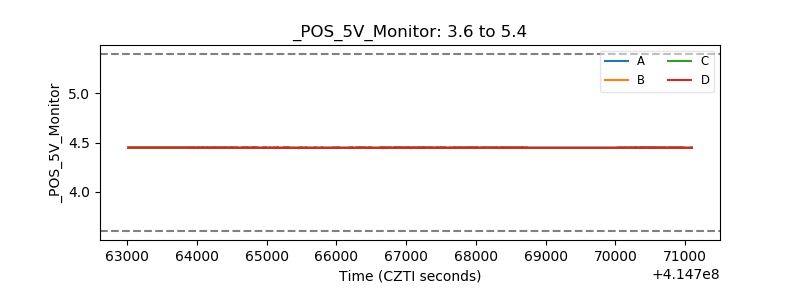 |
| _ROLL_ROT | 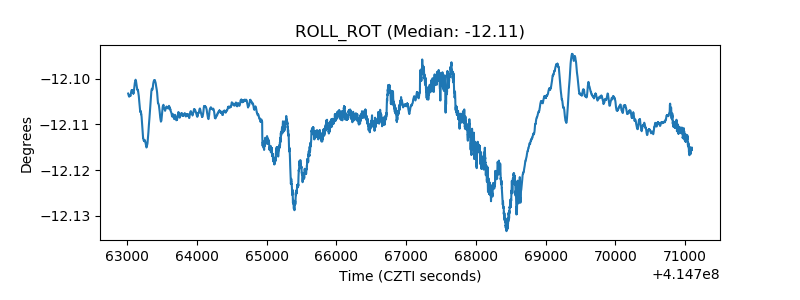 |
| _Roll_DEC | 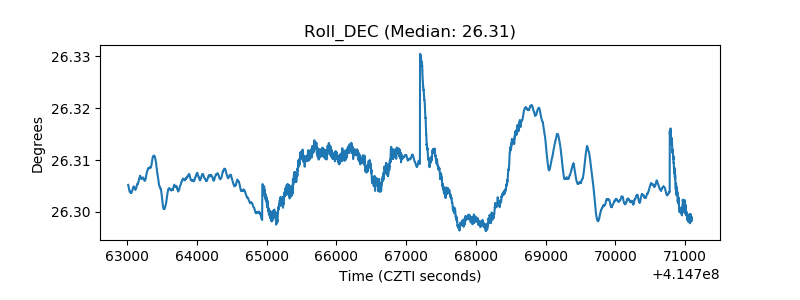 |
| _Roll_RA | 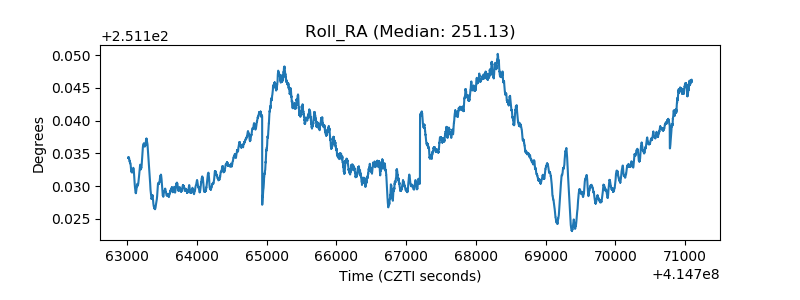 |
| Veto Counter | 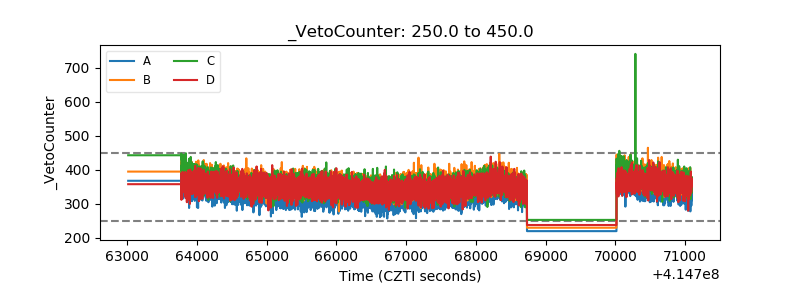 |