| Param | Original file | Final file |
|---|---|---|
| Filename | modeM0/AS1A12_054T03_9000005516_40034cztM0_level2.fits | modeM0/AS1A12_054T03_9000005516_40034cztM0_level2_quad_clean.evt |
| Size (bytes) | 1,000,365,120 | 249,926,400 |
| Size | 954.0 MB | 238.3 MB |
| Events in quadrant A | 8,395,649 | 1,669,579 |
| Events in quadrant B | 6,935,858 | 1,720,068 |
| Events in quadrant C | 10,386,386 | 1,617,488 |
| Events in quadrant D | 10,107,457 | 1,486,103 |
| Mode M9 | |||
|---|---|---|---|
| Quadrant | BADHDUFLAG | Total packets | Discarded packets |
| A | 0 | 41 | 0 |
| B | 0 | 41 | 0 |
| C | 0 | 41 | 0 |
| D | 0 | 41 | 0 |
| Mode SS | |||
|---|---|---|---|
| Quadrant | BADHDUFLAG | Total packets | Discarded packets |
| A | 0 | 316 | 0 |
| B | 0 | 316 | 0 |
| C | 0 | 316 | 0 |
| D | 0 | 316 | 0 |
| Mode M0 | |||
|---|---|---|---|
| Quadrant | BADHDUFLAG | Total packets | Discarded packets |
| A | 0 | 34501 | 3 |
| B | 0 | 31560 | 2 |
| C | 0 | 40993 | 2 |
| D | 0 | 41166 | 2 |
| Quadrant | Total seconds | Saturated seconds | Saturation percentage |
|---|---|---|---|
| A | 15565 | 76 | 0.488275% |
| B | 15565 | 24 | 0.154192% |
| C | 15565 | 380 | 2.441375% |
| D | 15565 | 533 | 3.424350% |
Noise dominated data is calculated using 1-second bins in cleaned event files. If a bin has >2000 counts, and if more than 50% of those come from <1% of pixels, then it is considered to be noise-dominated and hence unusable.
| Quadrant | # 1 sec bins | Bins with >0 counts | Bins with >2000 counts | High rate bins dominated by noise | Noise dominated (total time) | Noise dominated (detector-on time) | Marked lightcurve |
|---|---|---|---|---|---|---|---|
| A | 19653 | 15568 | 60 | 60 | 0.31% | 0.39% | 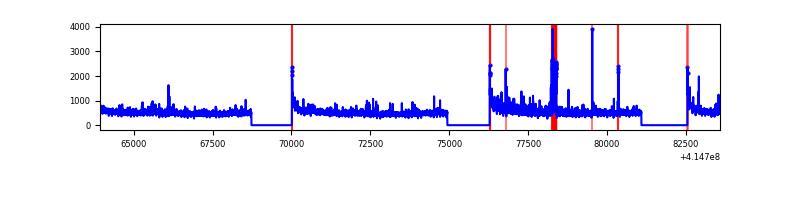 |
| B | 19653 | 15568 | 4 | 4 | 0.02% | 0.03% | 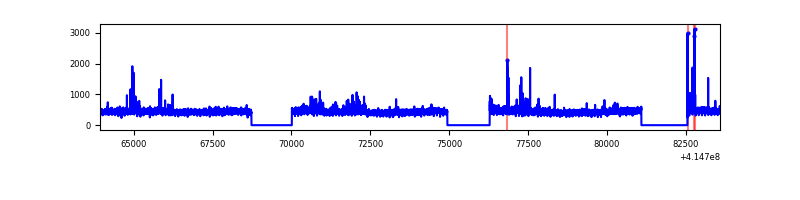 |
| C | 19653 | 15568 | 377 | 377 | 1.92% | 2.42% | 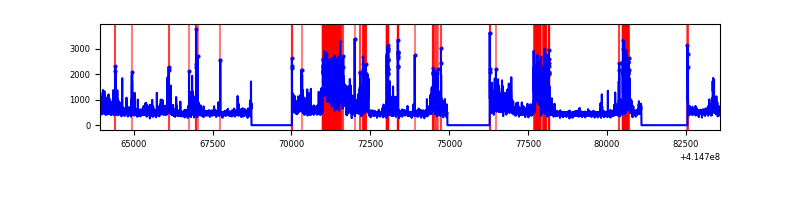 |
| D | 19653 | 15568 | 459 | 459 | 2.34% | 2.95% | 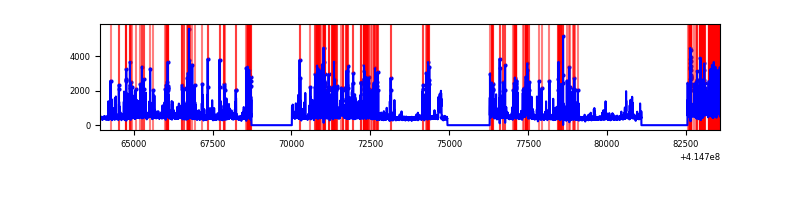 |
Top three noisy pixels from each quadrant. If the there are fewer than three noisy pixels in the level2.evt file, extra rows are filled as -1
| Pixel properties | Quadrant properties | ||||||
|---|---|---|---|---|---|---|---|
| Quadrant | DetID | PixID | Counts | Sigma | Mean | Median | Sigma |
| A | 10 | 83 | 1162308 | 3389.13 | 1687 | 1653 | 342.5 |
| A | 6 | 10 | 419417 | 1219.88 | 1687 | 1653 | 342.5 |
| A | 7 | 3 | 98344 | 282.34 | 1687 | 1653 | 342.5 |
| B | 4 | 171 | 76532 | 231.14 | 1687 | 1642 | 324.0 |
| B | 0 | 189 | 51179 | 152.89 | 1687 | 1642 | 324.0 |
| B | 12 | 111 | 41556 | 123.19 | 1687 | 1642 | 324.0 |
| C | 9 | 187 | 2931355 | 7680.67 | 1646 | 1656 | 381.4 |
| C | 15 | 214 | 676834 | 1770.09 | 1646 | 1656 | 381.4 |
| C | 14 | 254 | 173424 | 450.32 | 1646 | 1656 | 381.4 |
| D | 1 | 47 | 1635185 | 4060.49 | 1635 | 1592 | 402.3 |
| D | 12 | 227 | 1452298 | 3605.9 | 1635 | 1592 | 402.3 |
| D | 2 | 250 | 316544 | 782.85 | 1635 | 1592 | 402.3 |
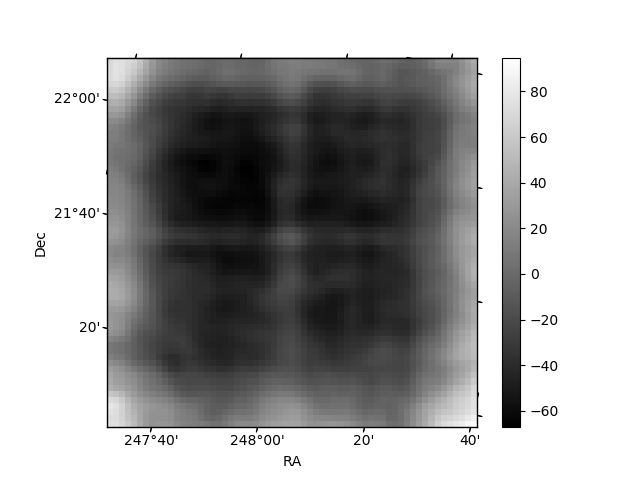
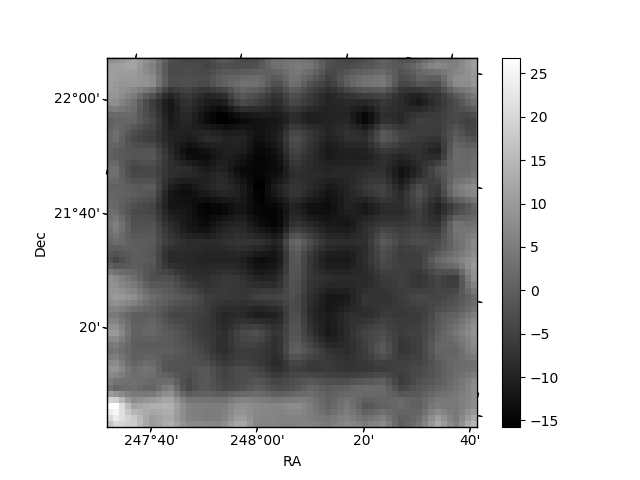
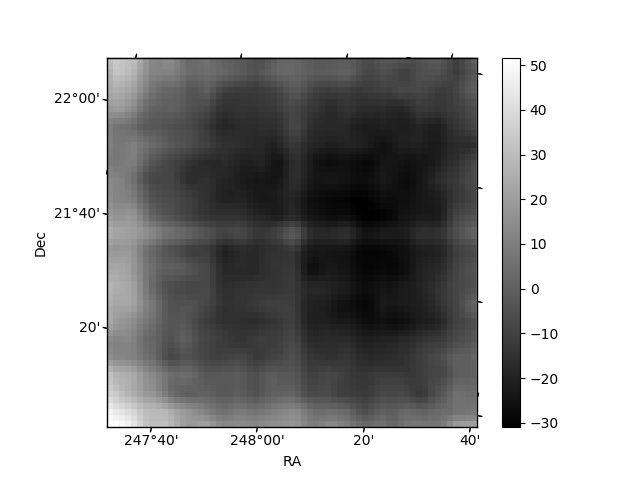
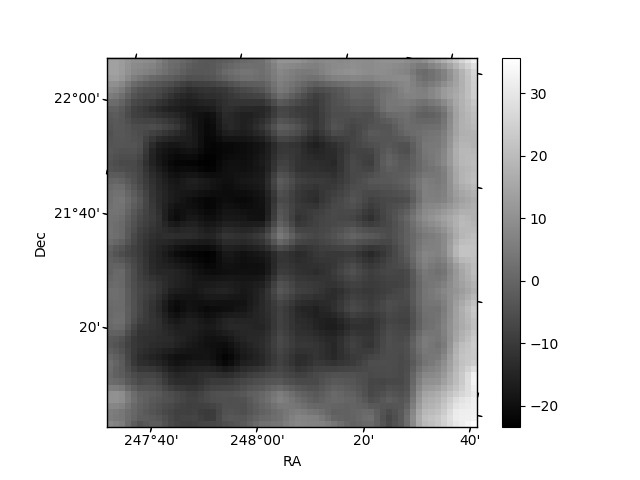
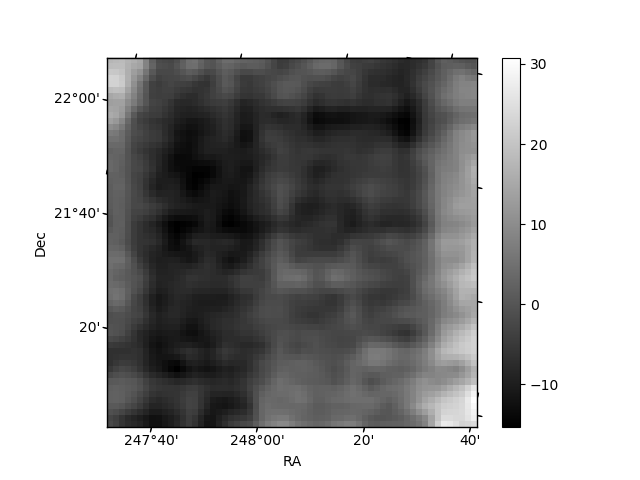
Histogram calculated using DETX and DETY for each event in the final _common_clean file
| Quadrant A | 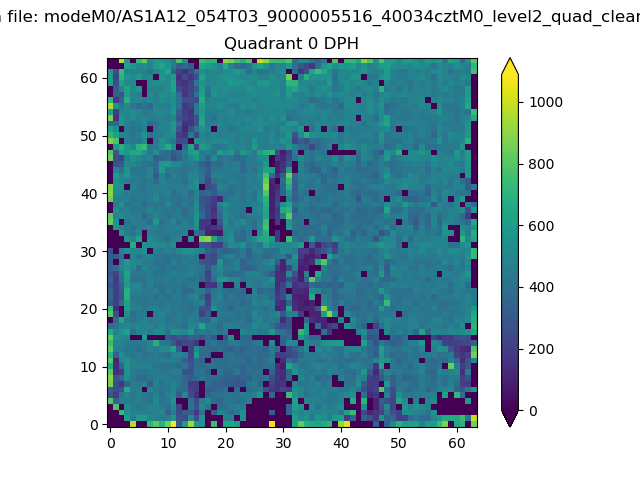 |
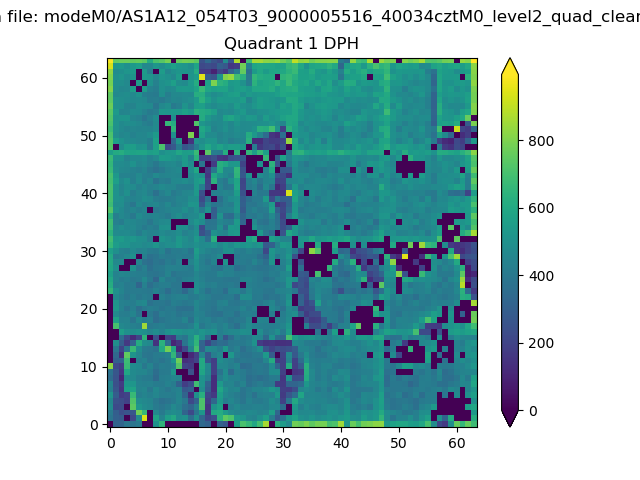 |
Quadrant B |
|---|---|---|---|
| Quadrant D | 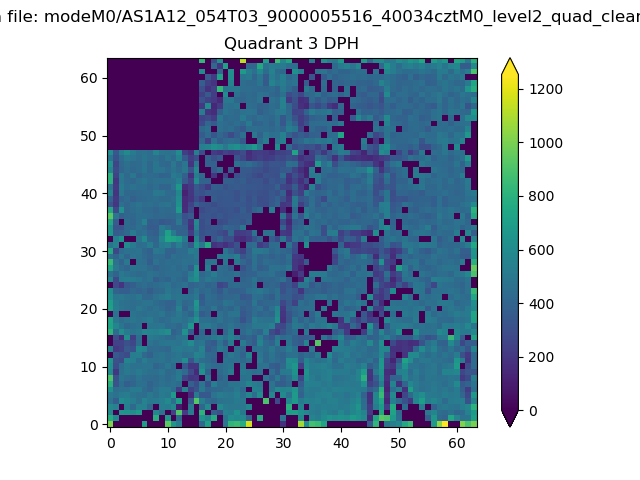 |
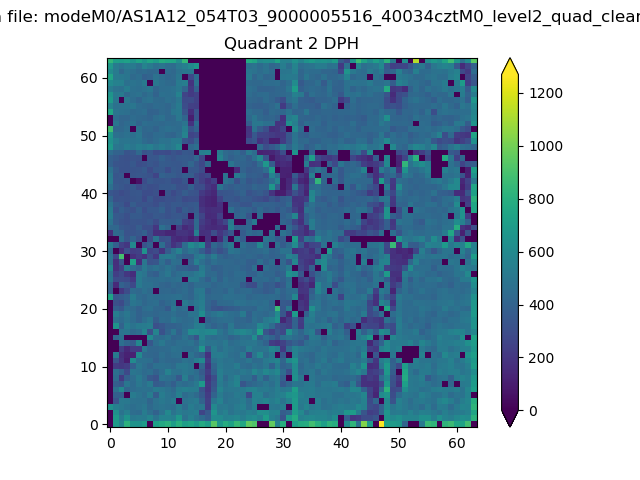 |
Quadrant C |
| Plot type | Count rate plots | Images |
|---|---|---|
| Comparison with Poisson distribution Blue bars denote a histogram of data divided into 1 sec bins. Red curve is a Poisson curve with rate = median count rate of data. |
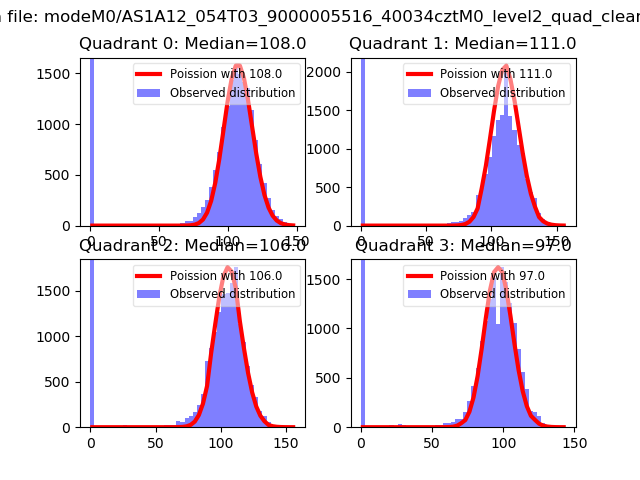 |
 |
| Quadrant-wise count rates Data is divided into 100 sec bins |
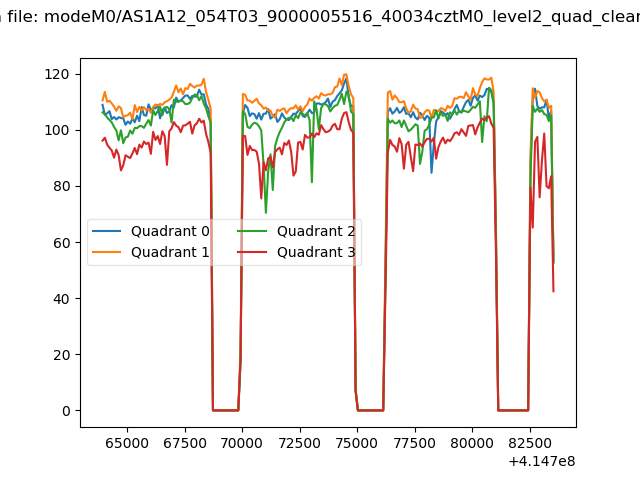 |
|
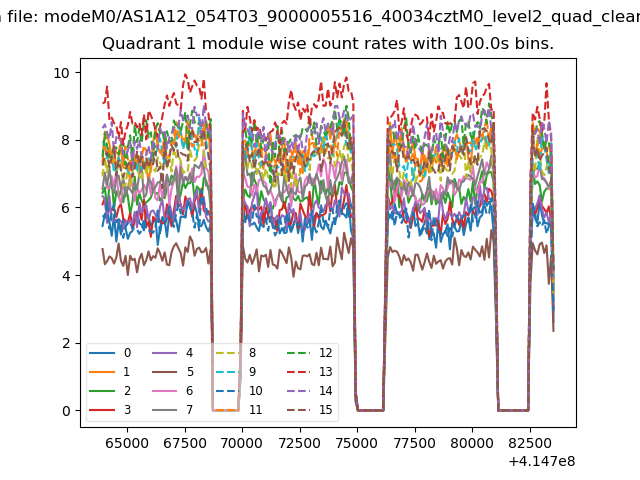
| Module-wise count rates for Quadrant A Data is divided into 100 sec bins |
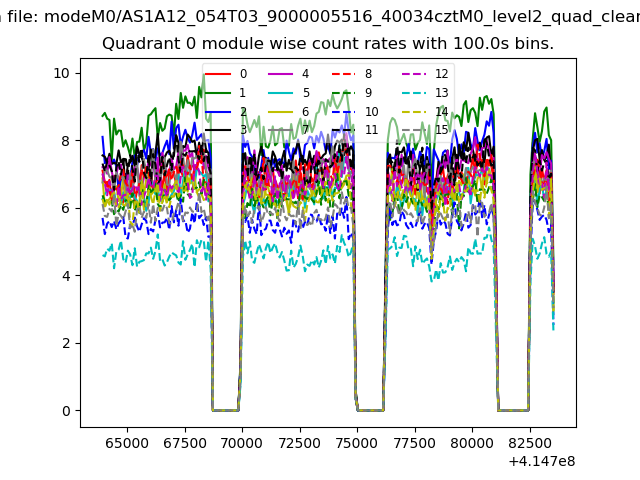 |
 |
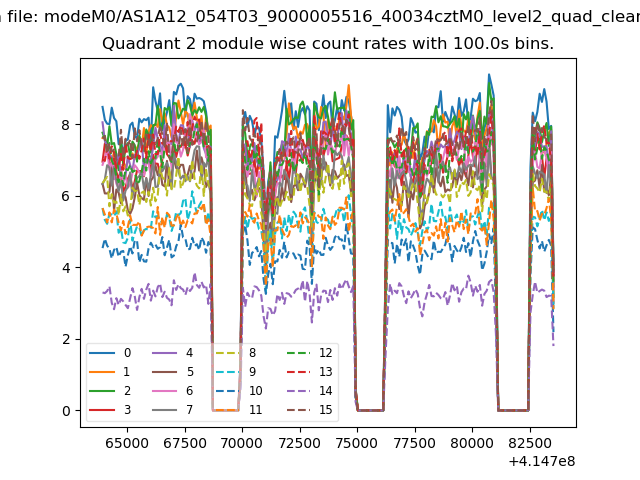
| Module-wise count rates for Quadrant B Data is divided into 100 sec bins |
 |
 |
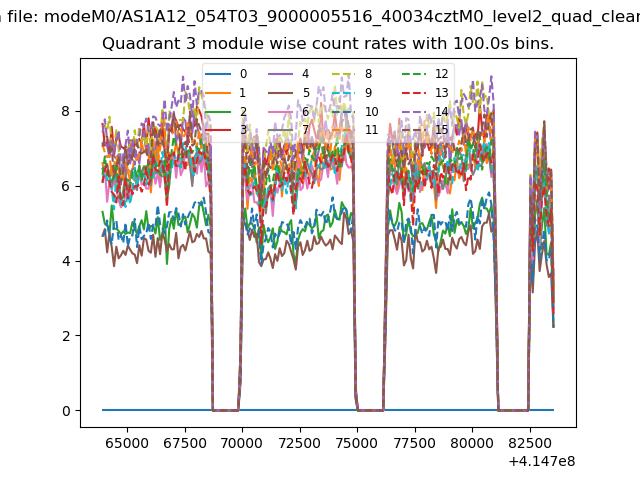
| Module-wise count rates for Quadrant C Data is divided into 100 sec bins |
 |
 |
| Module-wise count rates for Quadrant D Data is divided into 100 sec bins |
 |
 |
| Parameter | Plot |
|---|---|
| CZT HV Monitor | 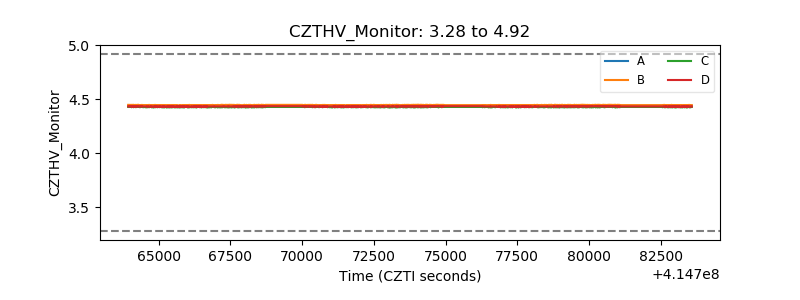 |
| D_VDD | 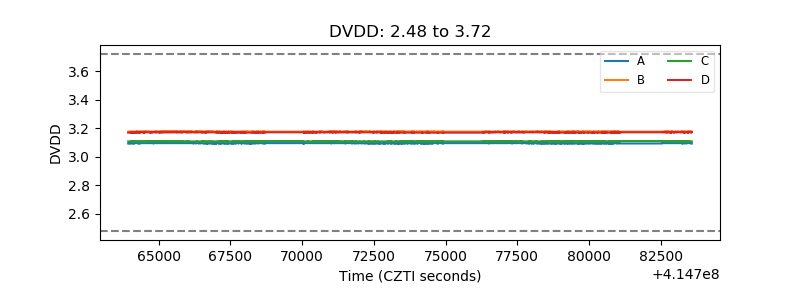 |
| Temperature 1 | 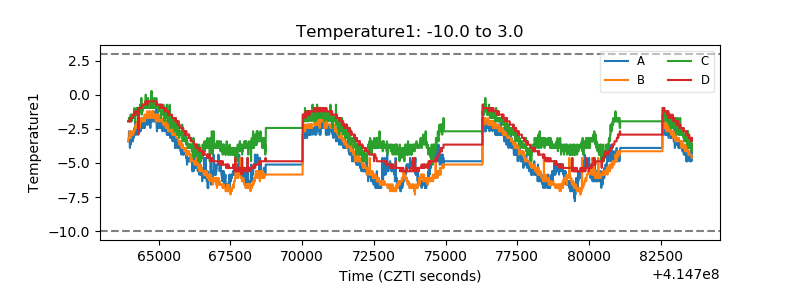 |
| Veto HV Monitor | 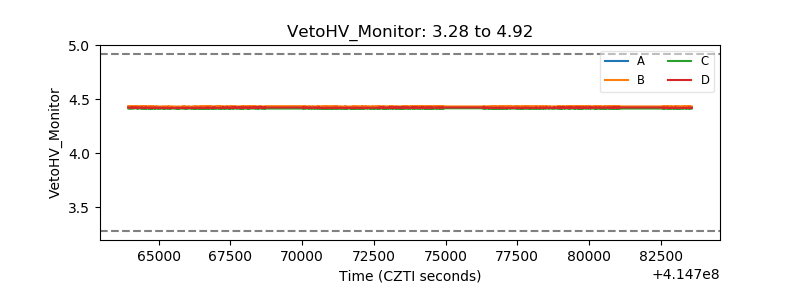 |
| Veto LLD | 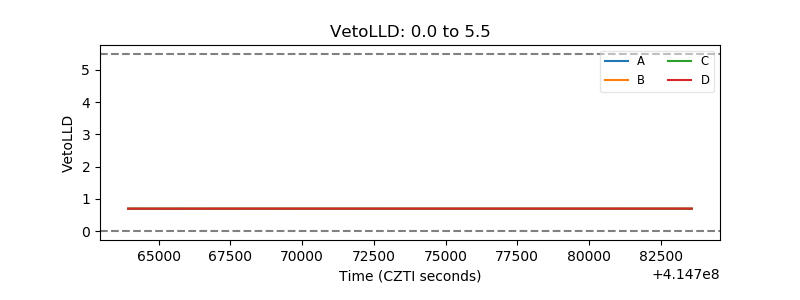 |
| Alpha Counter |  |
| _CPM_Rate | 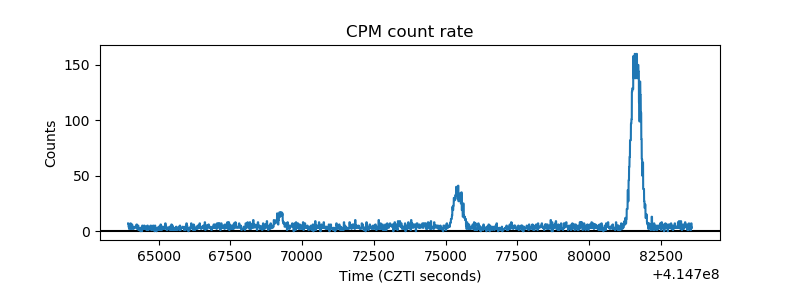 |
| CZT Counter | 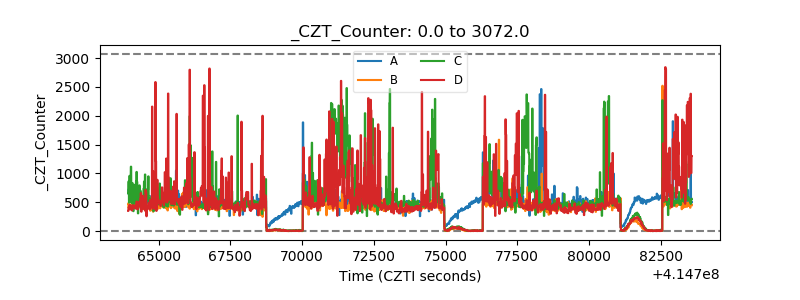 |
| +2.5 Volts monitor | 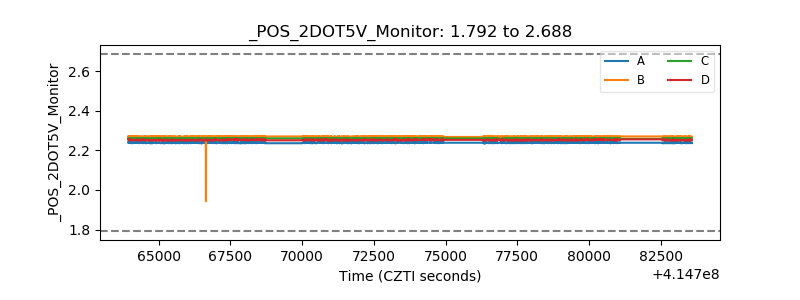 |
| +5 Volts monitor | 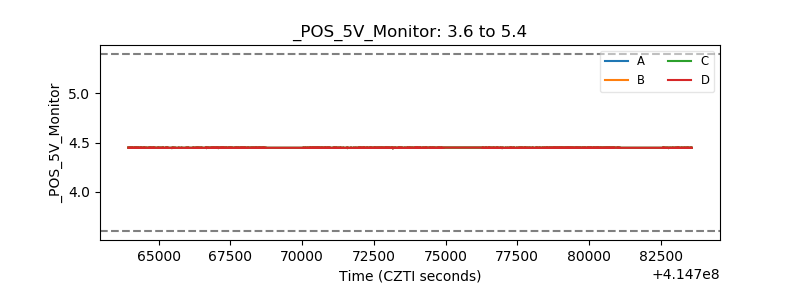 |
| _ROLL_ROT | 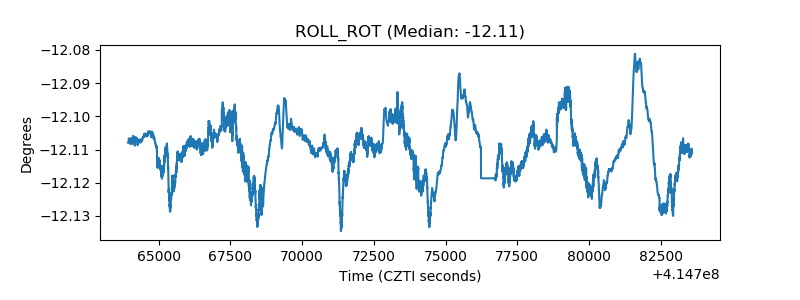 |
| _Roll_DEC | 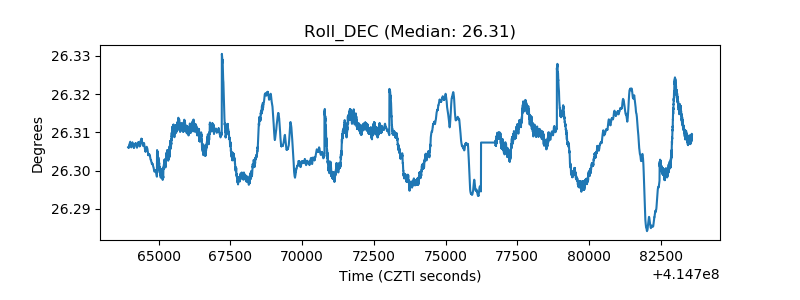 |
| _Roll_RA | 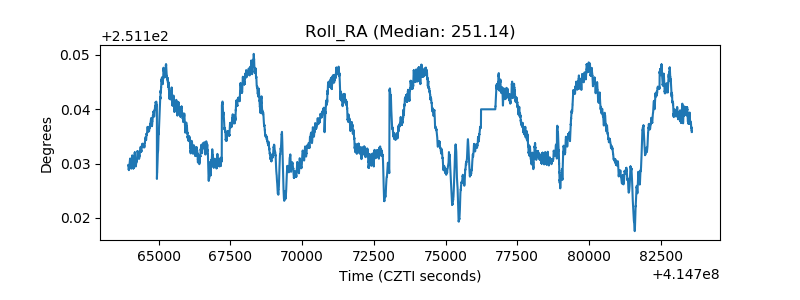 |
| Veto Counter | 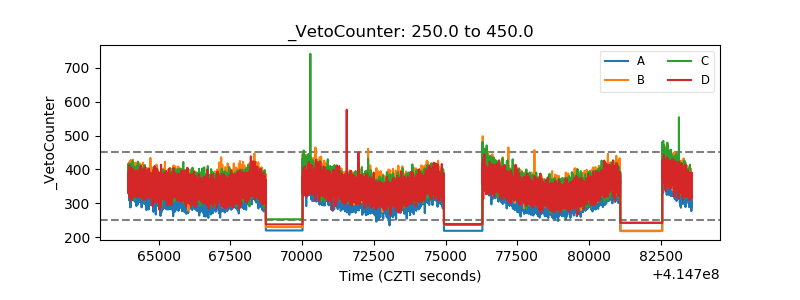 |