| Param | Original file | Final file |
|---|---|---|
| Filename | modeM0/AS1A12_054T03_9000005516_40035cztM0_level2.fits | modeM0/AS1A12_054T03_9000005516_40035cztM0_level2_quad_clean.evt |
| Size (bytes) | 431,346,240 | 87,197,760 |
| Size | 411.4 MB | 83.2 MB |
| Events in quadrant A | 2,956,271 | 604,865 |
| Events in quadrant B | 2,499,741 | 619,446 |
| Events in quadrant C | 3,261,774 | 592,095 |
| Events in quadrant D | 6,817,369 | 435,638 |
| Mode M9 | |||
|---|---|---|---|
| Quadrant | BADHDUFLAG | Total packets | Discarded packets |
| A | 0 | 31 | 0 |
| B | 0 | 31 | 0 |
| C | 0 | 31 | 0 |
| D | 0 | 31 | 0 |
| Mode SS | |||
|---|---|---|---|
| Quadrant | BADHDUFLAG | Total packets | Discarded packets |
| A | 0 | 114 | 0 |
| B | 0 | 114 | 0 |
| C | 0 | 114 | 0 |
| D | 0 | 114 | 0 |
| Mode M0 | |||
|---|---|---|---|
| Quadrant | BADHDUFLAG | Total packets | Discarded packets |
| A | 0 | 12327 | 3 |
| B | 0 | 11361 | 2 |
| C | 0 | 13265 | 2 |
| D | 0 | 24199 | 2 |
| Quadrant | Total seconds | Saturated seconds | Saturation percentage |
|---|---|---|---|
| A | 5550 | 17 | 0.306306% |
| B | 5550 | 18 | 0.324324% |
| C | 5550 | 104 | 1.873874% |
| D | 5550 | 1380 | 24.864865% |
Noise dominated data is calculated using 1-second bins in cleaned event files. If a bin has >2000 counts, and if more than 50% of those come from <1% of pixels, then it is considered to be noise-dominated and hence unusable.
| Quadrant | # 1 sec bins | Bins with >0 counts | Bins with >2000 counts | High rate bins dominated by noise | Noise dominated (total time) | Noise dominated (detector-on time) | Marked lightcurve |
|---|---|---|---|---|---|---|---|
| A | 8595 | 5552 | 3 | 3 | 0.03% | 0.05% | 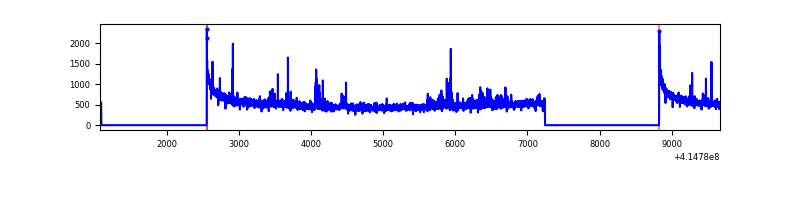 |
| B | 8595 | 5552 | 4 | 4 | 0.05% | 0.07% | 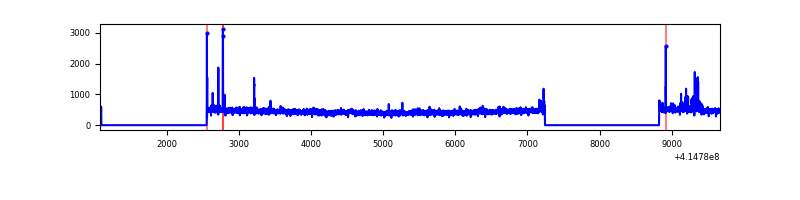 |
| C | 8595 | 5552 | 84 | 84 | 0.98% | 1.51% | 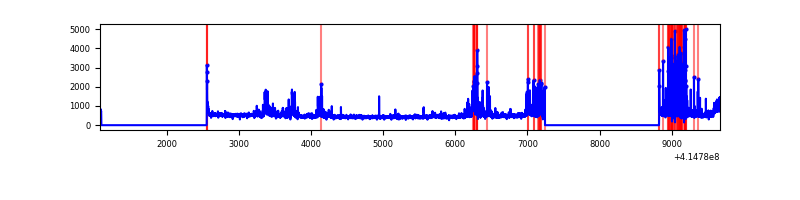 |
| D | 8595 | 5552 | 1267 | 1267 | 14.74% | 22.82% | 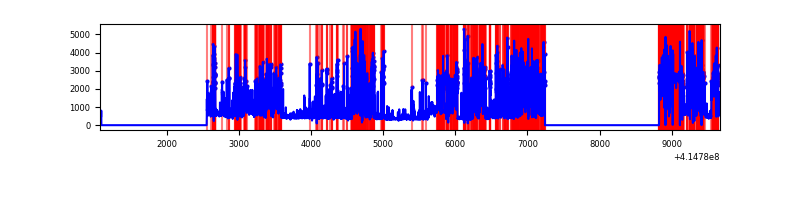 |
Top three noisy pixels from each quadrant. If the there are fewer than three noisy pixels in the level2.evt file, extra rows are filled as -1
| Pixel properties | Quadrant properties | ||||||
|---|---|---|---|---|---|---|---|
| Quadrant | DetID | PixID | Counts | Sigma | Mean | Median | Sigma |
| A | 10 | 83 | 477564 | 3856.63 | 605 | 594 | 123.7 |
| A | 6 | 10 | 98385 | 790.71 | 605 | 594 | 123.7 |
| A | 7 | 3 | 15047 | 116.86 | 605 | 594 | 123.7 |
| B | 5 | 32 | 48070 | 398.23 | 606 | 587 | 119.2 |
| B | 0 | 230 | 22214 | 181.38 | 606 | 587 | 119.2 |
| B | 0 | 221 | 19471 | 158.37 | 606 | 587 | 119.2 |
| C | 9 | 187 | 658852 | 4746.2 | 591 | 594 | 138.7 |
| C | 15 | 214 | 242302 | 1742.77 | 591 | 594 | 138.7 |
| C | 0 | 10 | 29201 | 206.26 | 591 | 594 | 138.7 |
| D | 12 | 227 | 4218581 | 32886.19 | 516 | 501 | 128.3 |
| D | 1 | 47 | 478807 | 3729.1 | 516 | 501 | 128.3 |
| D | 2 | 250 | 53860 | 416.01 | 516 | 501 | 128.3 |
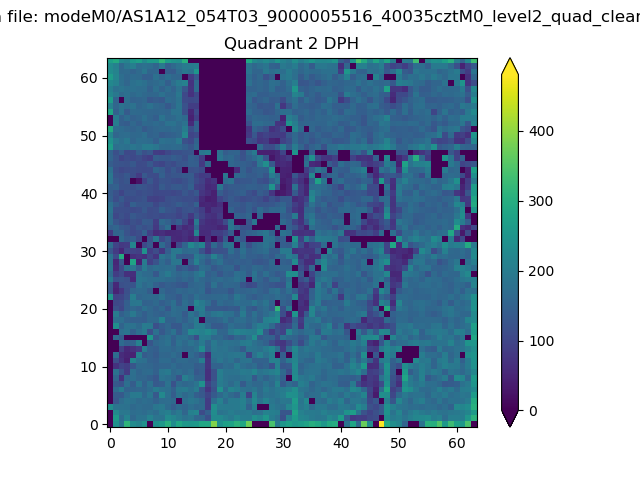
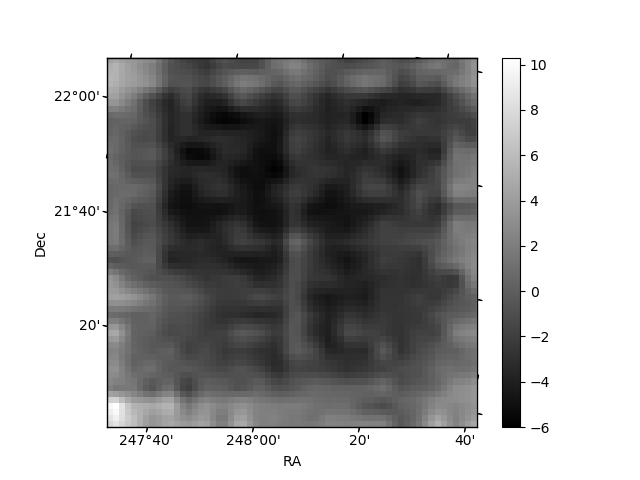
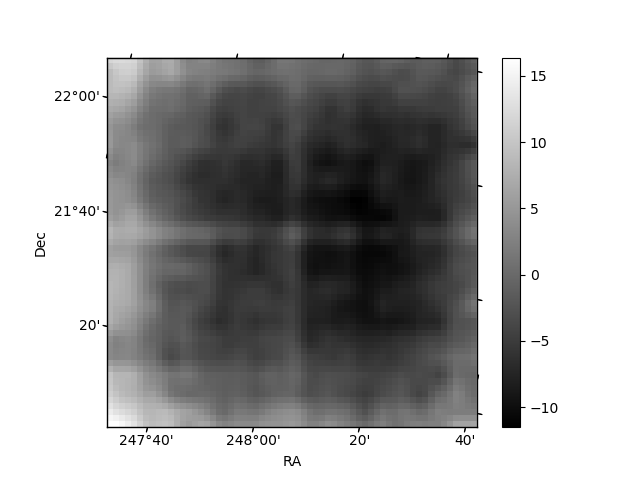
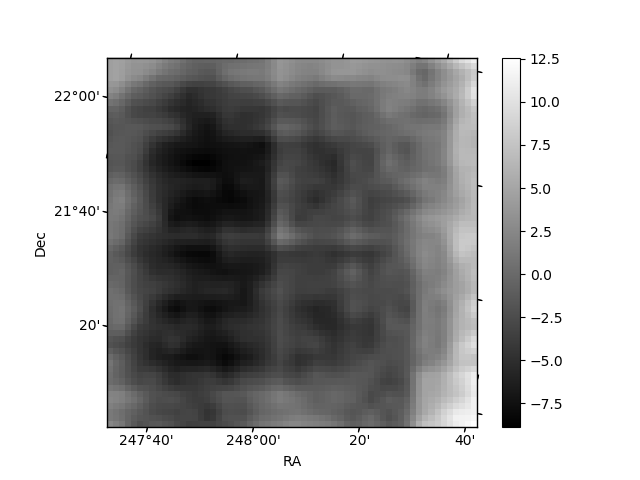
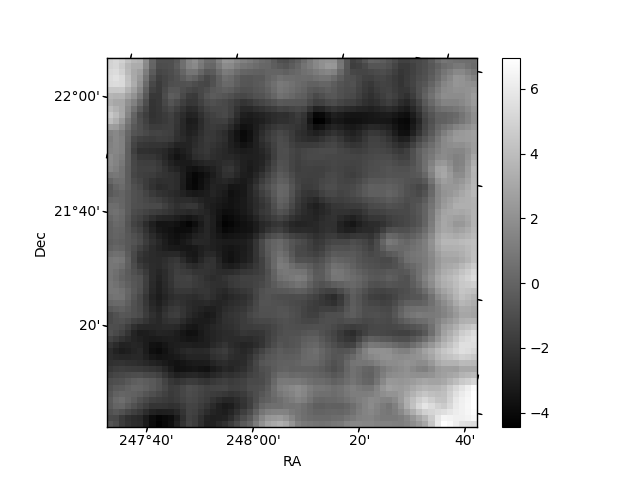
Histogram calculated using DETX and DETY for each event in the final _common_clean file
| Quadrant A | 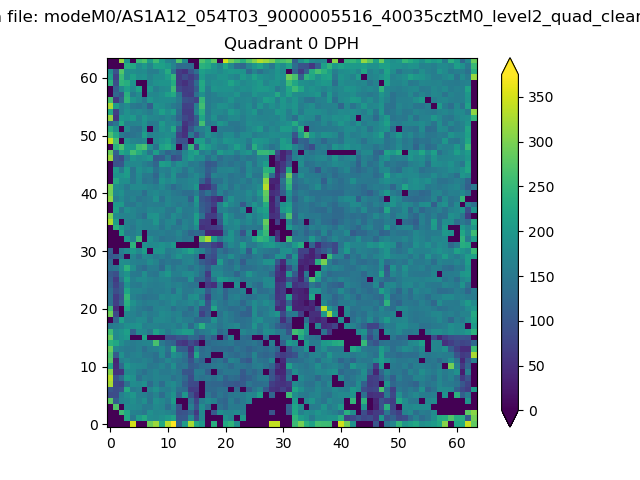 |
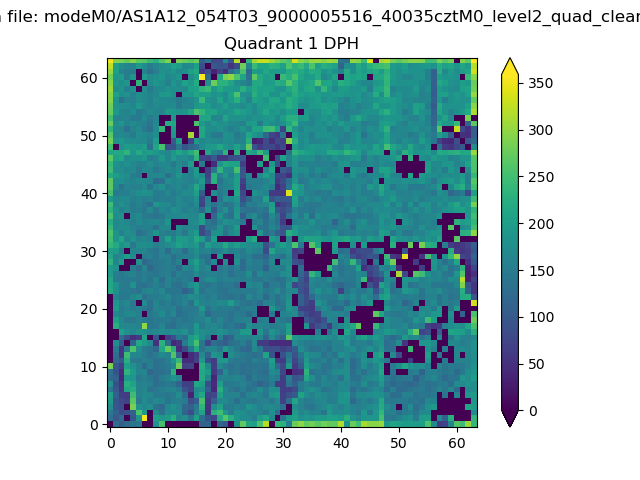 |
Quadrant B |
|---|---|---|---|
| Quadrant D | 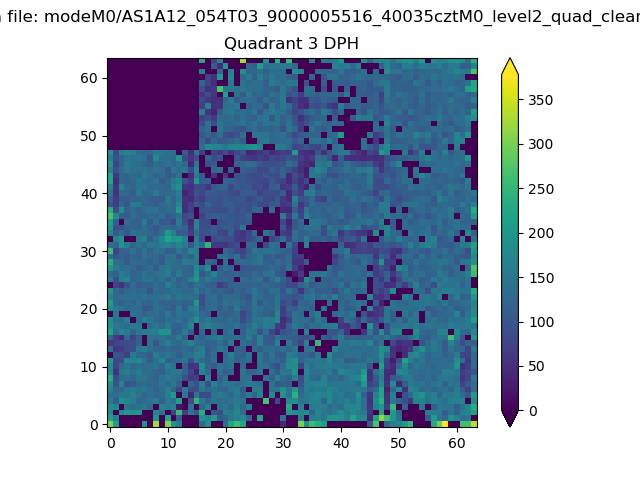 |
 |
Quadrant C |
| Plot type | Count rate plots | Images |
|---|---|---|
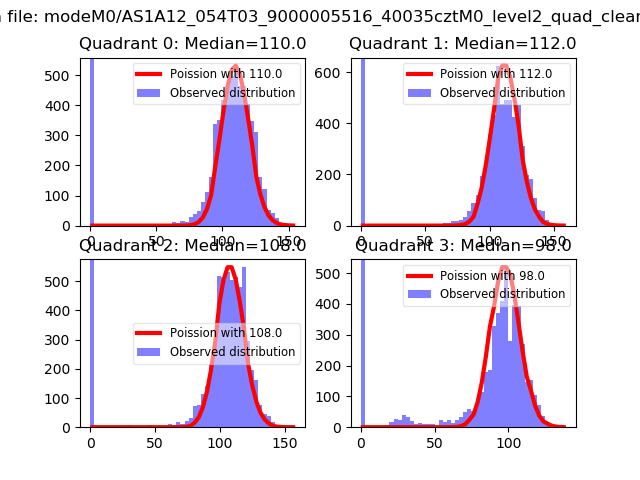
| Comparison with Poisson distribution Blue bars denote a histogram of data divided into 1 sec bins. Red curve is a Poisson curve with rate = median count rate of data. |
 |
 |
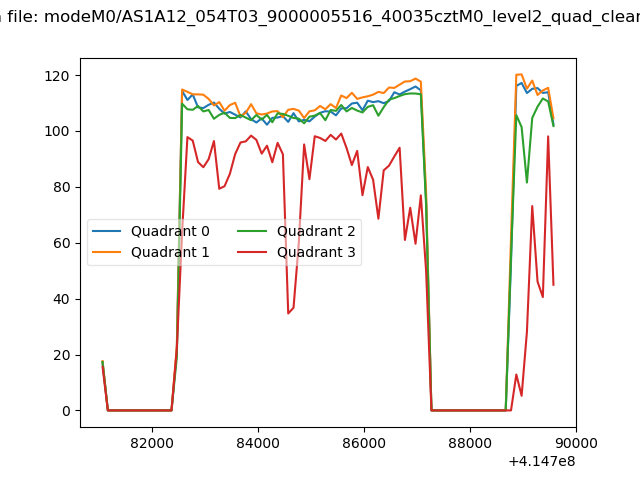
| Quadrant-wise count rates Data is divided into 100 sec bins |
 |
|
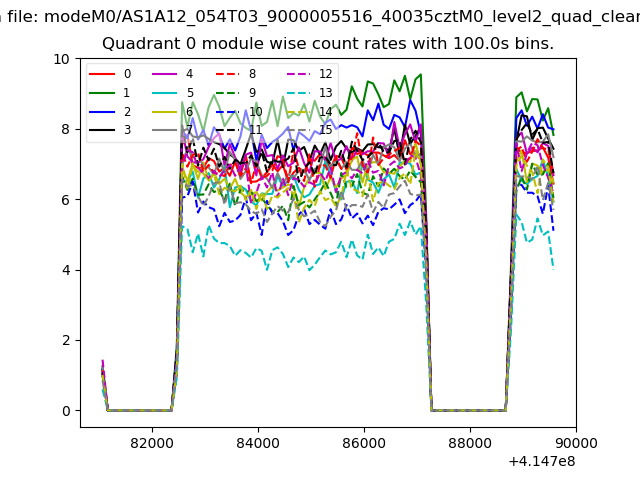
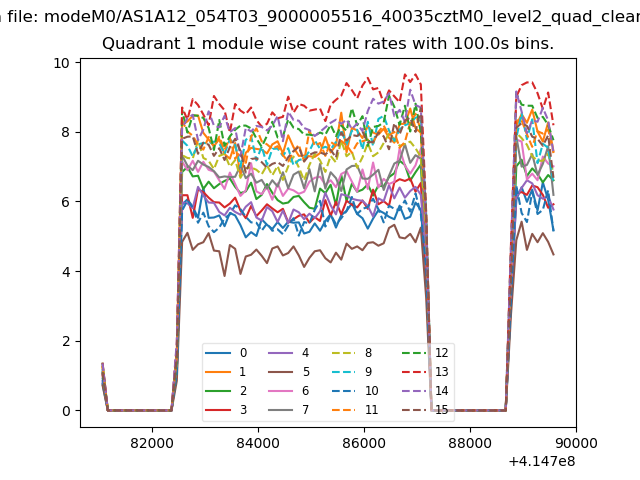
| Module-wise count rates for Quadrant A Data is divided into 100 sec bins |
 |
 |
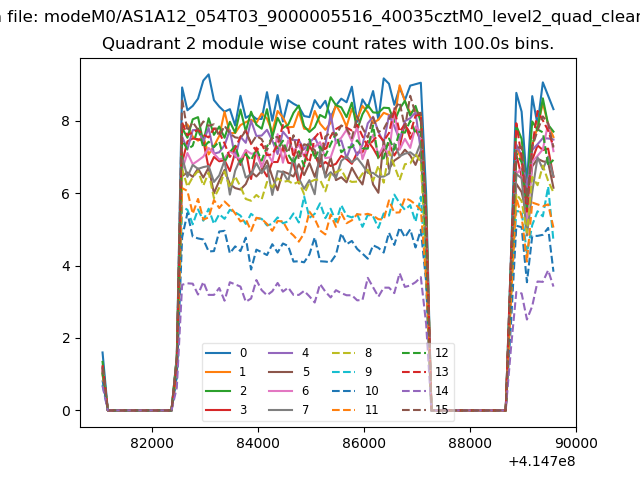
| Module-wise count rates for Quadrant B Data is divided into 100 sec bins |
 |
 |
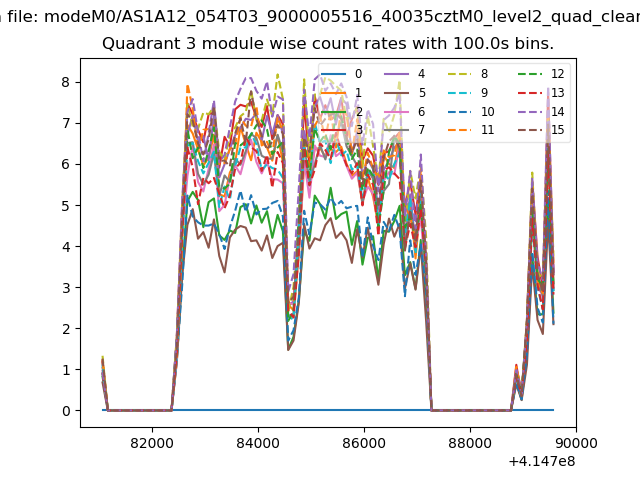
| Module-wise count rates for Quadrant C Data is divided into 100 sec bins |
 |
 |
| Module-wise count rates for Quadrant D Data is divided into 100 sec bins |
 |
 |
| Parameter | Plot |
|---|---|
| CZT HV Monitor | 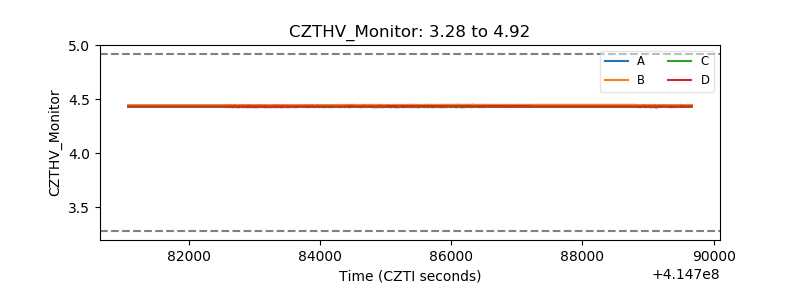 |
| D_VDD | 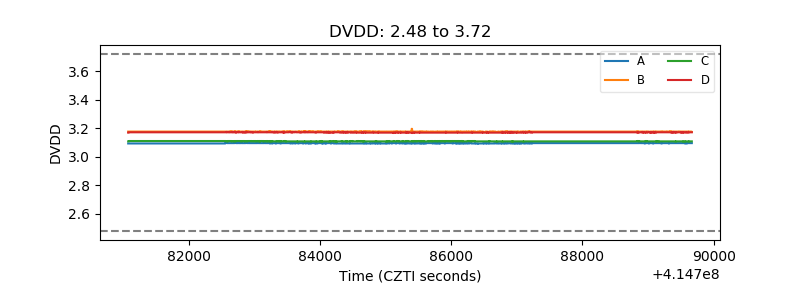 |
| Temperature 1 | 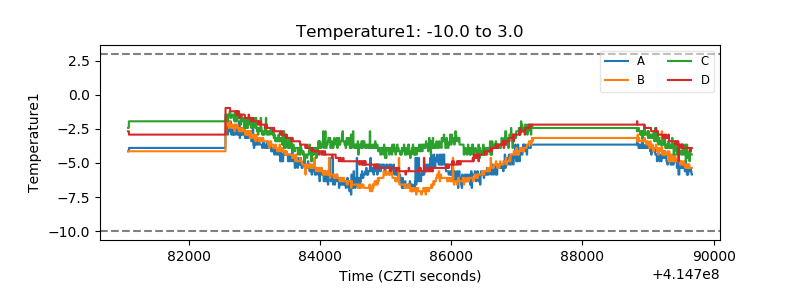 |
| Veto HV Monitor | 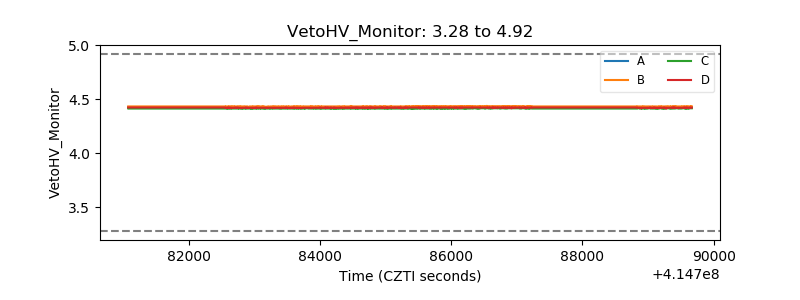 |
| Veto LLD | 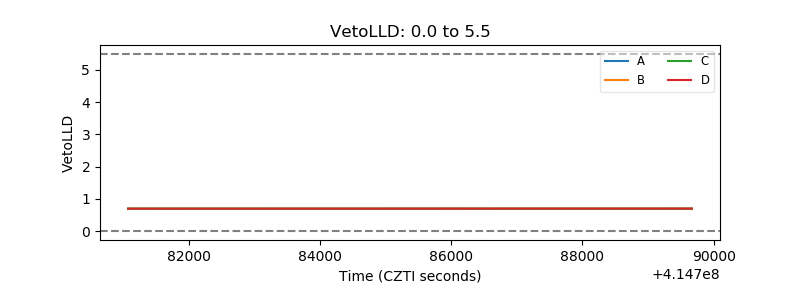 |
| Alpha Counter | 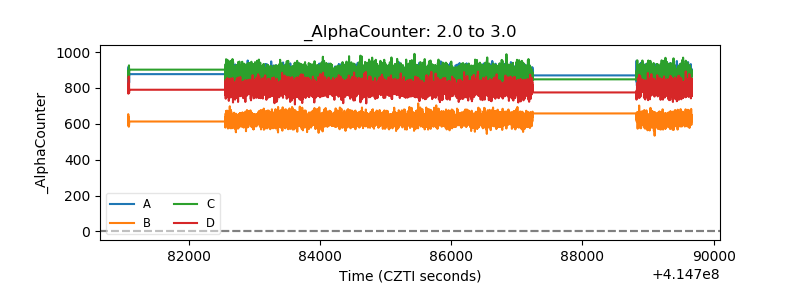 |
| _CPM_Rate | 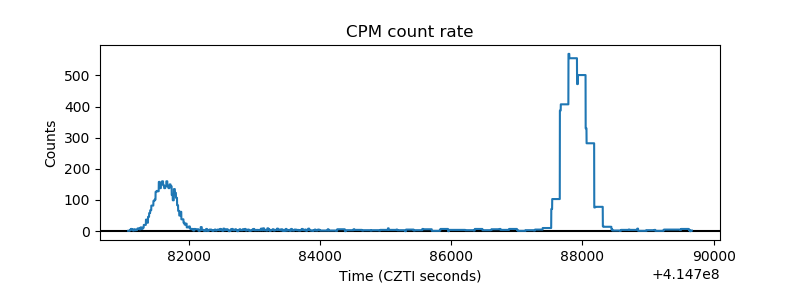 |
| CZT Counter | 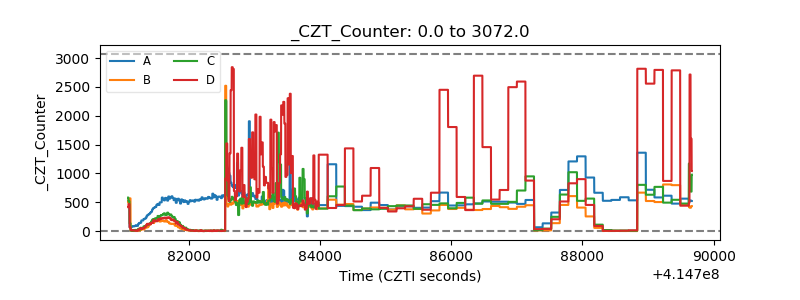 |
| +2.5 Volts monitor |  |
| +5 Volts monitor | 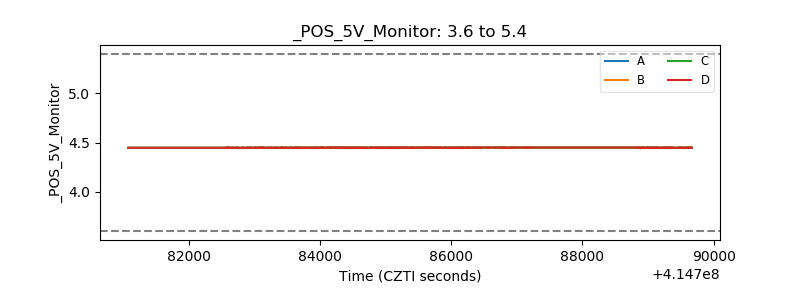 |
| _ROLL_ROT | 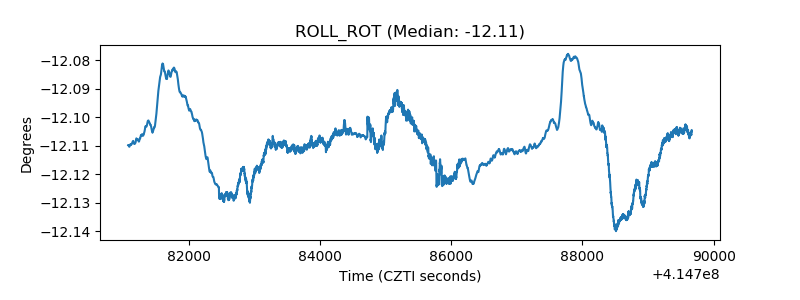 |
| _Roll_DEC | 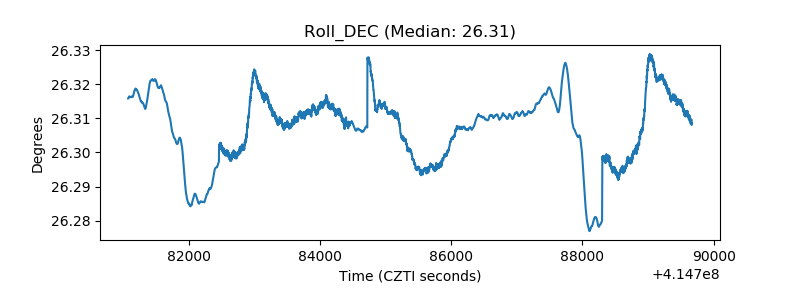 |
| _Roll_RA | 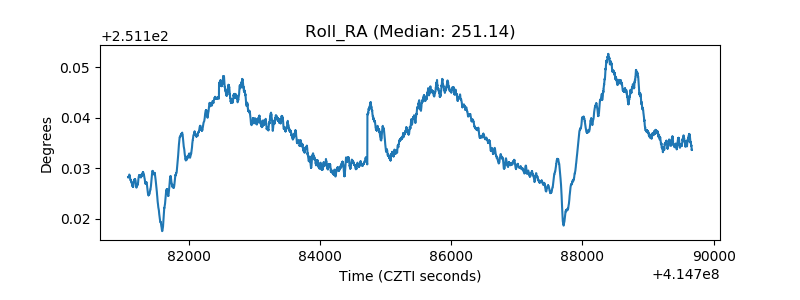 |
| Veto Counter | 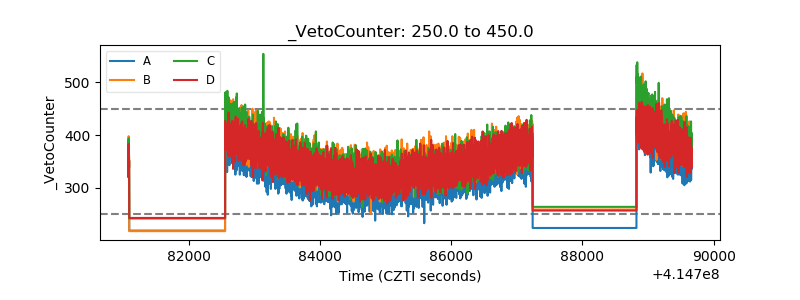 |