| Param | Original file | Final file |
|---|---|---|
| Filename | modeM0/AS1A12_054T03_9000005516_40036cztM0_level2.fits | modeM0/AS1A12_054T03_9000005516_40036cztM0_level2_quad_clean.evt |
| Size (bytes) | 411,039,360 | 88,364,160 |
| Size | 392.0 MB | 84.3 MB |
| Events in quadrant A | 2,884,141 | 610,617 |
| Events in quadrant B | 3,144,095 | 605,072 |
| Events in quadrant C | 3,321,460 | 602,640 |
| Events in quadrant D | 5,439,913 | 474,572 |
| Mode M9 | |||
|---|---|---|---|
| Quadrant | BADHDUFLAG | Total packets | Discarded packets |
| A | 0 | 33 | 0 |
| B | 0 | 33 | 0 |
| C | 0 | 33 | 0 |
| D | 0 | 33 | 0 |
| Mode SS | |||
|---|---|---|---|
| Quadrant | BADHDUFLAG | Total packets | Discarded packets |
| A | 0 | 112 | 0 |
| B | 0 | 112 | 0 |
| C | 0 | 112 | 0 |
| D | 0 | 112 | 0 |
| Mode M0 | |||
|---|---|---|---|
| Quadrant | BADHDUFLAG | Total packets | Discarded packets |
| A | 0 | 12122 | 3 |
| B | 0 | 13293 | 2 |
| C | 0 | 13435 | 2 |
| D | 0 | 20037 | 2 |
| Quadrant | Total seconds | Saturated seconds | Saturation percentage |
|---|---|---|---|
| A | 5471 | 19 | 0.347286% |
| B | 5471 | 262 | 4.788887% |
| C | 5471 | 92 | 1.681594% |
| D | 5471 | 956 | 17.473954% |
Noise dominated data is calculated using 1-second bins in cleaned event files. If a bin has >2000 counts, and if more than 50% of those come from <1% of pixels, then it is considered to be noise-dominated and hence unusable.
| Quadrant | # 1 sec bins | Bins with >0 counts | Bins with >2000 counts | High rate bins dominated by noise | Noise dominated (total time) | Noise dominated (detector-on time) | Marked lightcurve |
|---|---|---|---|---|---|---|---|
| A | 8757 | 5473 | 5 | 5 | 0.06% | 0.09% | 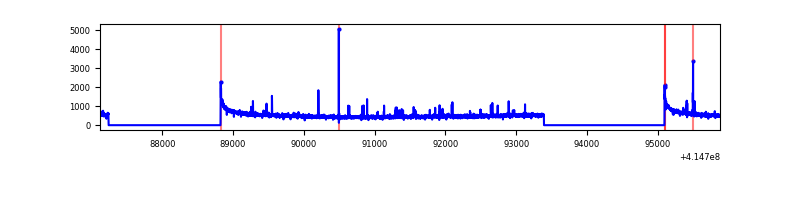 |
| B | 8757 | 5473 | 134 | 134 | 1.53% | 2.45% | 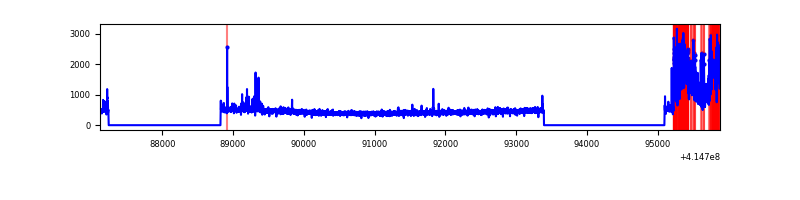 |
| C | 8757 | 5473 | 71 | 71 | 0.81% | 1.30% | 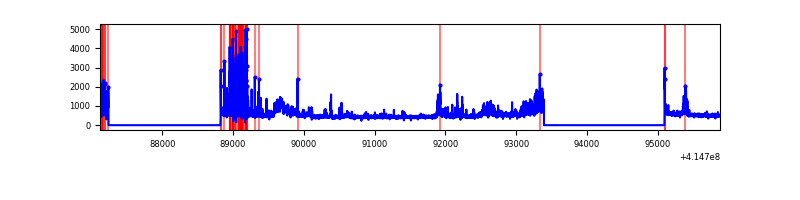 |
| D | 8757 | 5473 | 859 | 859 | 9.81% | 15.70% | 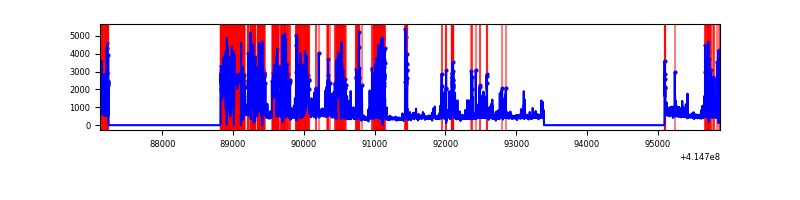 |
Top three noisy pixels from each quadrant. If the there are fewer than three noisy pixels in the level2.evt file, extra rows are filled as -1
| Pixel properties | Quadrant properties | ||||||
|---|---|---|---|---|---|---|---|
| Quadrant | DetID | PixID | Counts | Sigma | Mean | Median | Sigma |
| A | 10 | 83 | 460244 | 3720.62 | 601 | 589 | 123.5 |
| A | 6 | 10 | 56255 | 450.58 | 601 | 589 | 123.5 |
| A | 9 | 143 | 18262 | 143.05 | 601 | 589 | 123.5 |
| B | 4 | 171 | 744227 | 6365.42 | 594 | 577 | 116.8 |
| B | 5 | 32 | 42263 | 356.82 | 594 | 577 | 116.8 |
| B | 0 | 221 | 18349 | 152.12 | 594 | 577 | 116.8 |
| C | 9 | 187 | 738300 | 5385.28 | 587 | 591 | 137.0 |
| C | 15 | 214 | 239417 | 1743.43 | 587 | 591 | 137.0 |
| C | 0 | 10 | 23816 | 169.54 | 587 | 591 | 137.0 |
| D | 12 | 227 | 2940671 | 22632.31 | 528 | 514 | 129.9 |
| D | 1 | 47 | 182580 | 1401.48 | 528 | 514 | 129.9 |
| D | 2 | 250 | 143385 | 1099.77 | 528 | 514 | 129.9 |
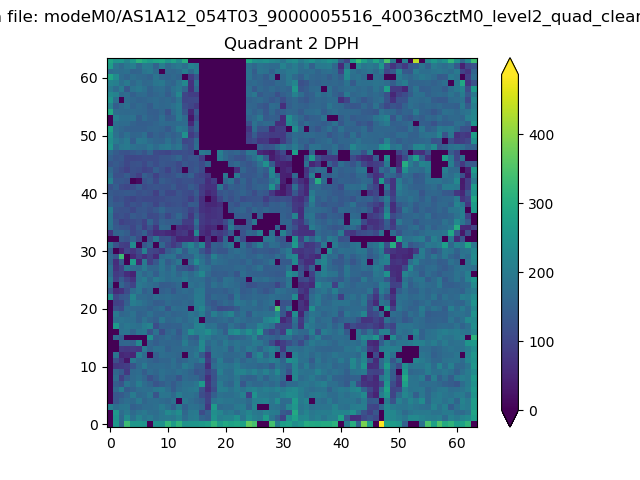
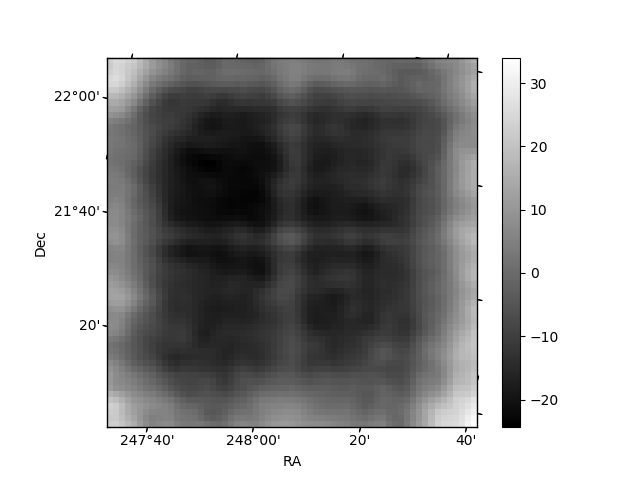
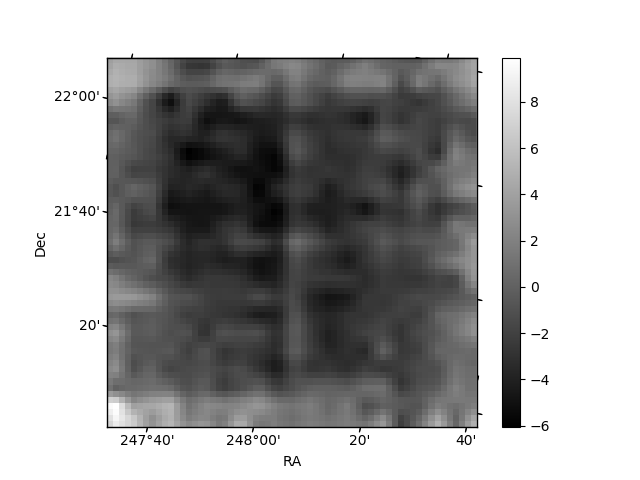
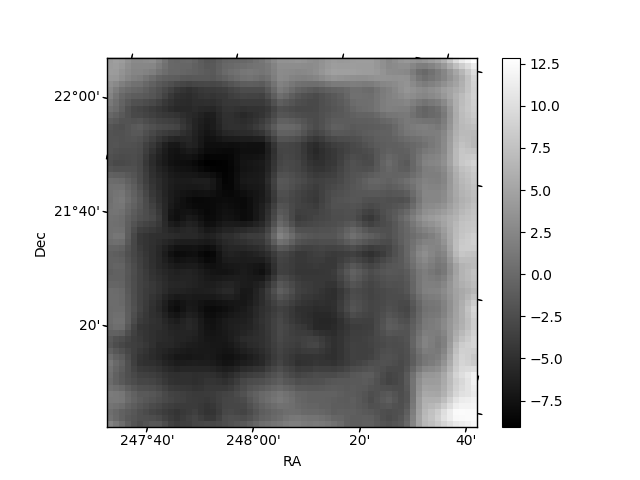
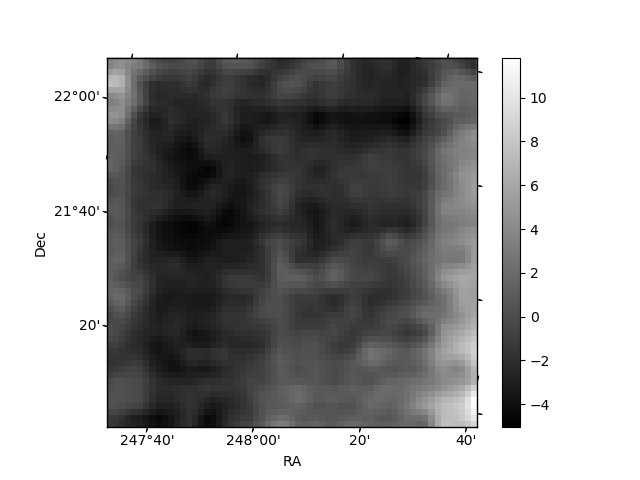
Histogram calculated using DETX and DETY for each event in the final _common_clean file
| Quadrant A | 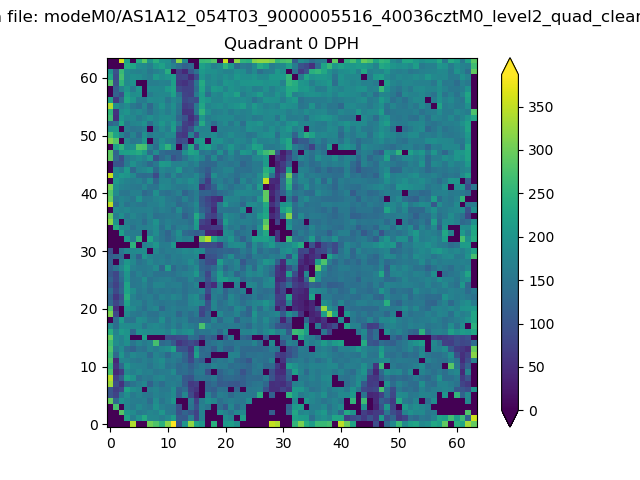 |
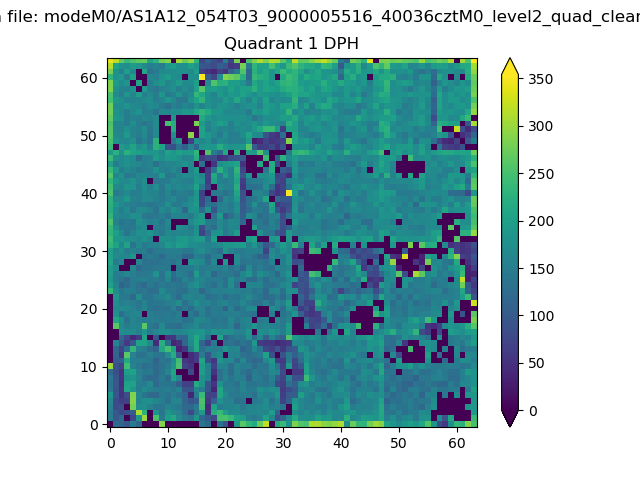 |
Quadrant B |
|---|---|---|---|
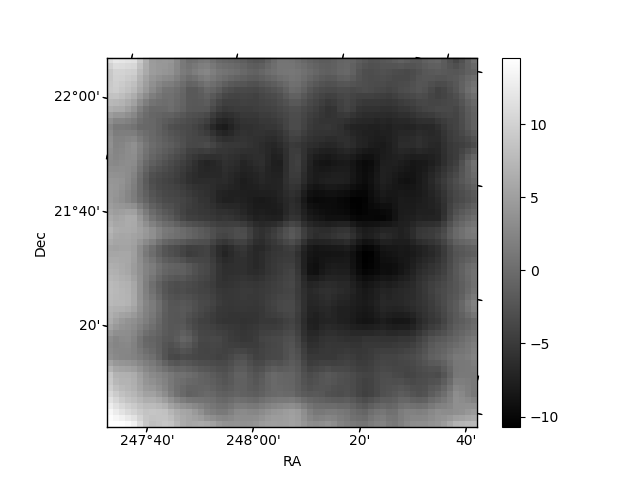
| Quadrant D | 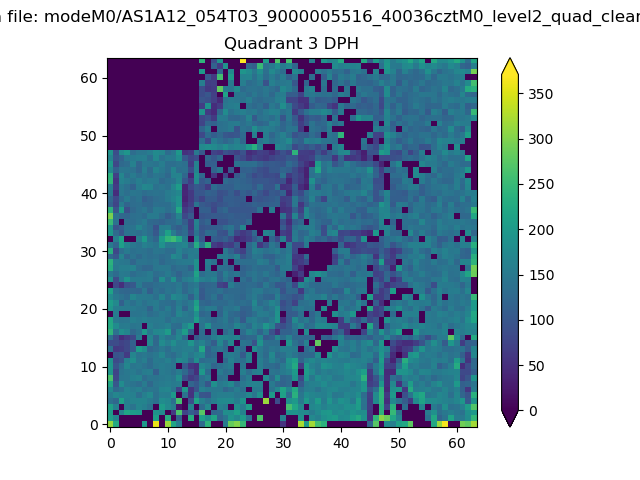 |
 |
Quadrant C |
| Plot type | Count rate plots | Images |
|---|---|---|
| Comparison with Poisson distribution Blue bars denote a histogram of data divided into 1 sec bins. Red curve is a Poisson curve with rate = median count rate of data. |
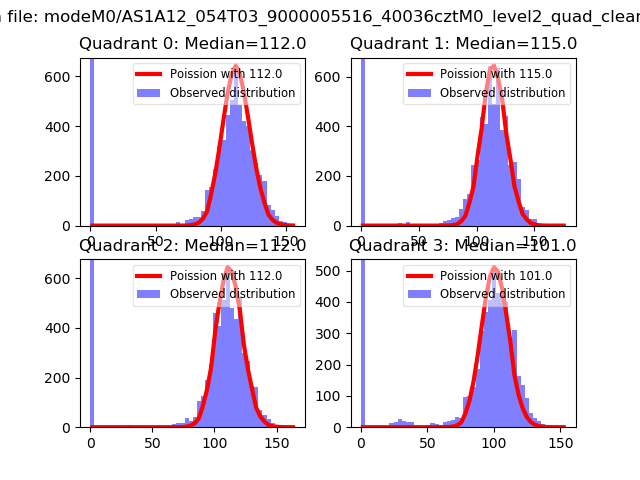 |
 |
| Quadrant-wise count rates Data is divided into 100 sec bins |
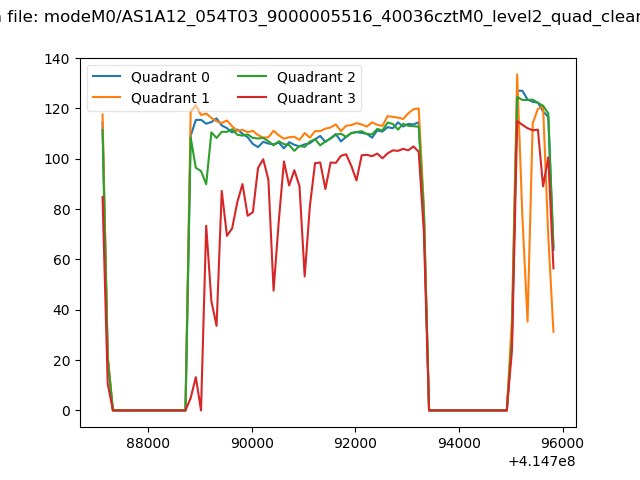 |
|
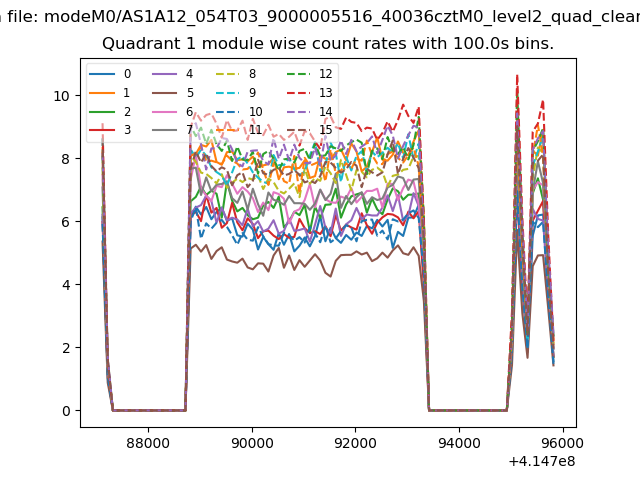
| Module-wise count rates for Quadrant A Data is divided into 100 sec bins |
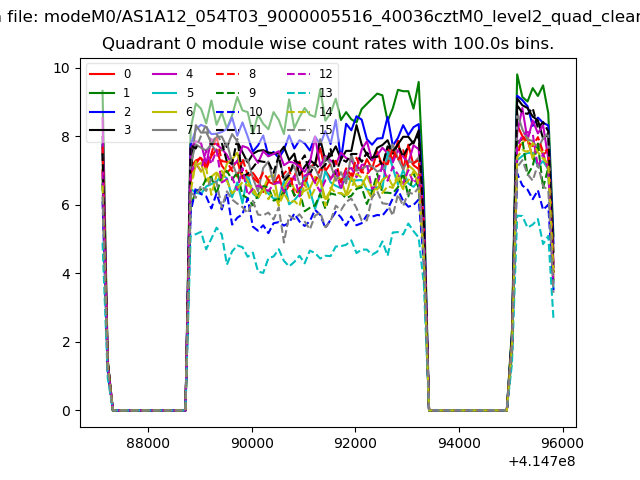 |
 |
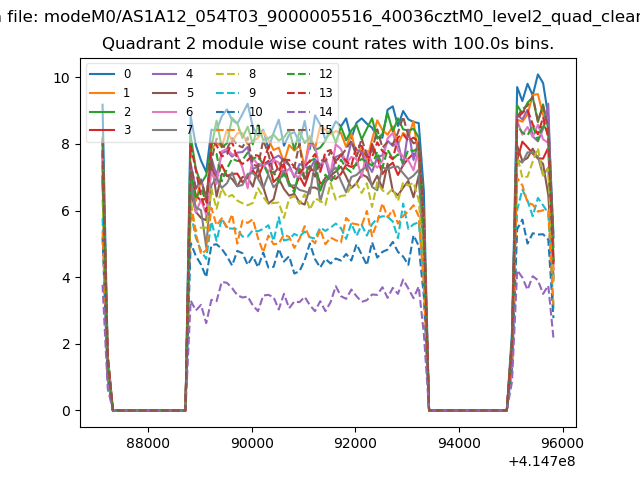
| Module-wise count rates for Quadrant B Data is divided into 100 sec bins |
 |
 |
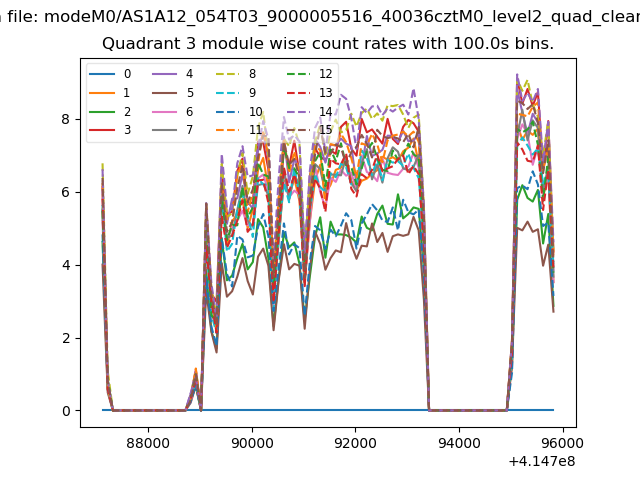
| Module-wise count rates for Quadrant C Data is divided into 100 sec bins |
 |
 |
| Module-wise count rates for Quadrant D Data is divided into 100 sec bins |
 |
 |
| Parameter | Plot |
|---|---|
| CZT HV Monitor | 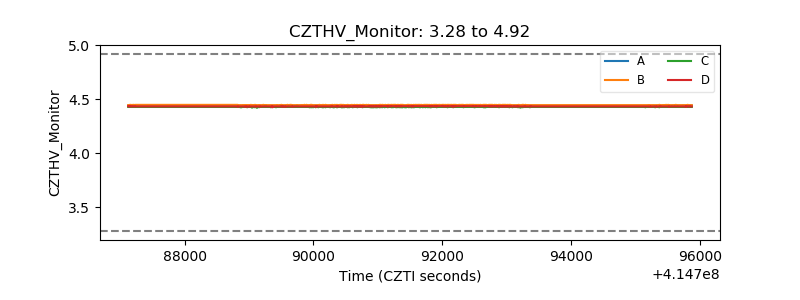 |
| D_VDD | 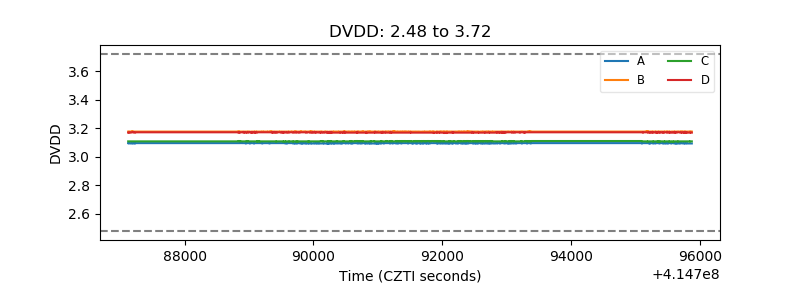 |
| Temperature 1 | 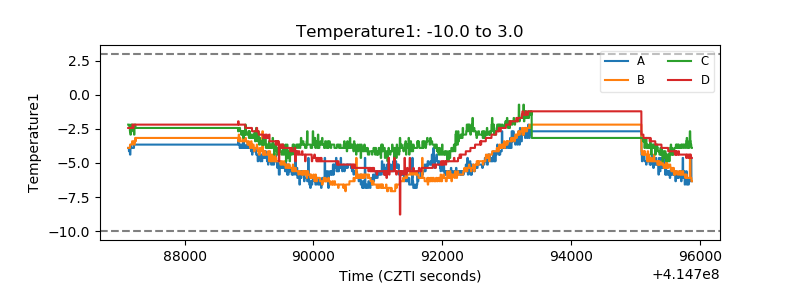 |
| Veto HV Monitor | 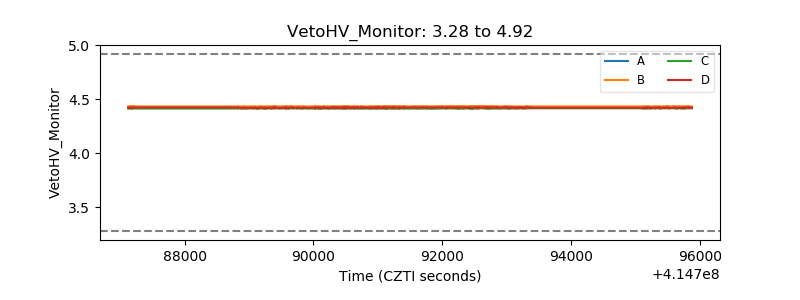 |
| Veto LLD | 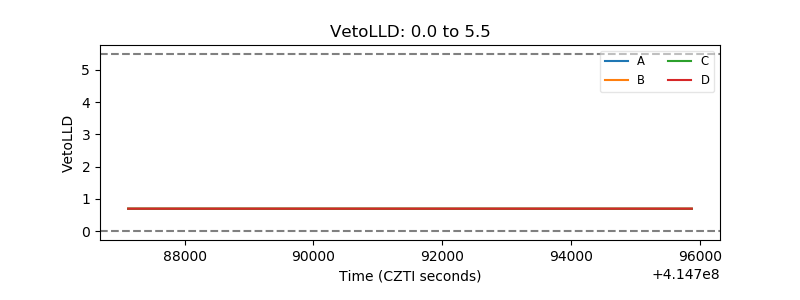 |
| Alpha Counter | 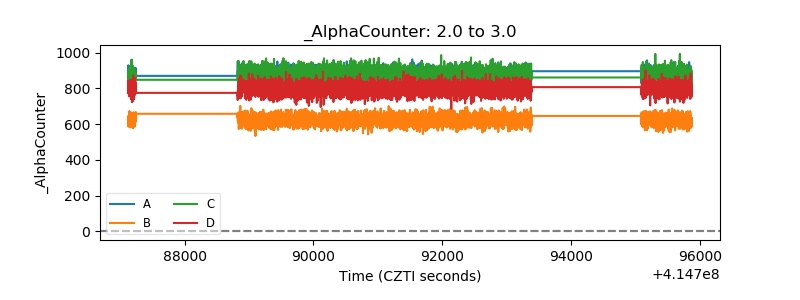 |
| _CPM_Rate | 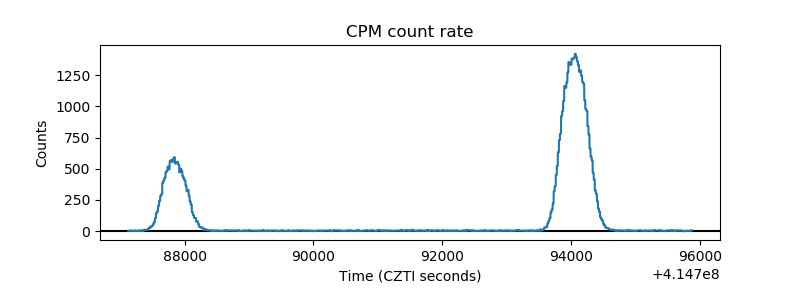 |
| CZT Counter | 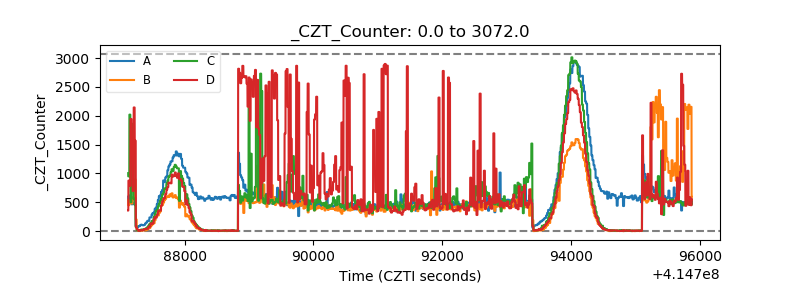 |
| +2.5 Volts monitor | 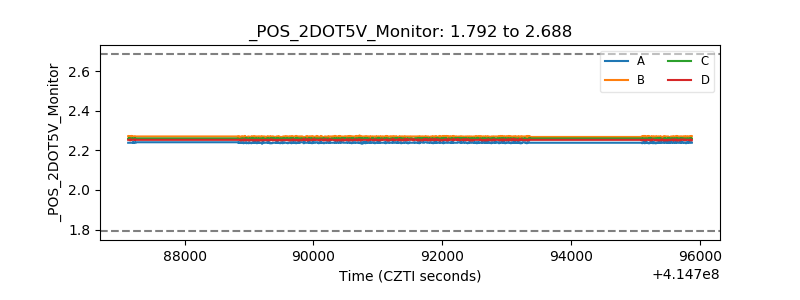 |
| +5 Volts monitor | 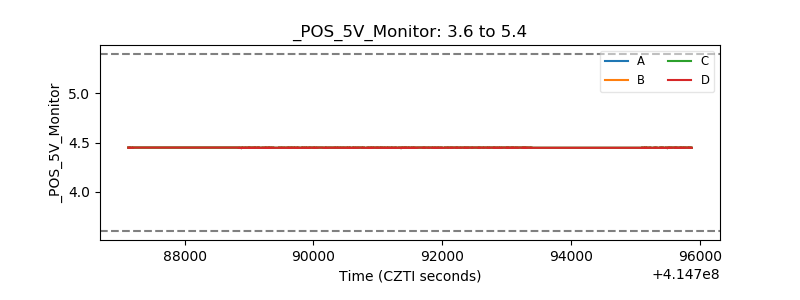 |
| _ROLL_ROT | 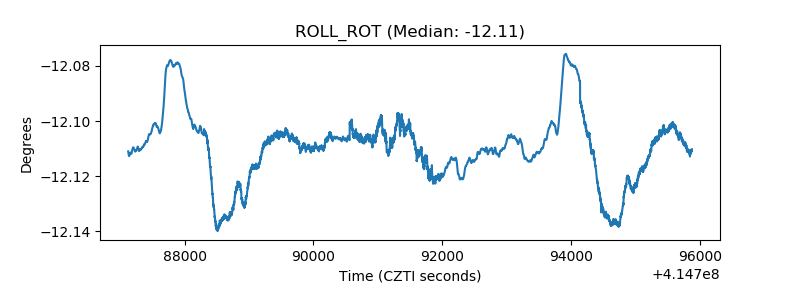 |
| _Roll_DEC | 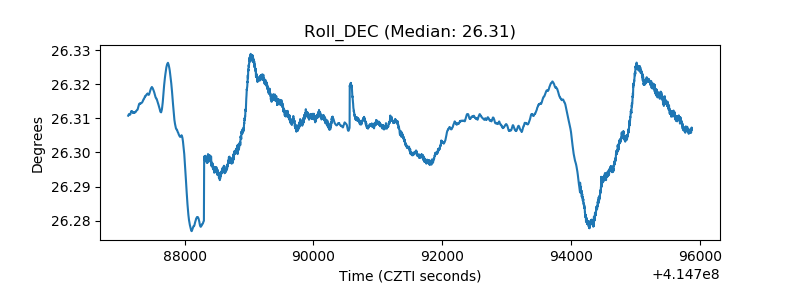 |
| _Roll_RA | 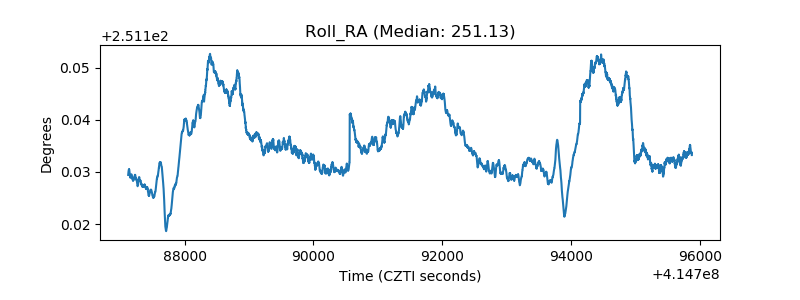 |
| Veto Counter | 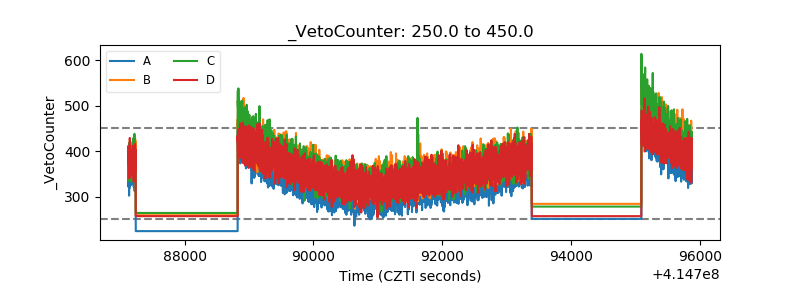 |