| Param | Original file | Final file |
|---|---|---|
| Filename | modeM0/AS1A12_054T03_9000005516_40038cztM0_level2.fits | modeM0/AS1A12_054T03_9000005516_40038cztM0_level2_quad_clean.evt |
| Size (bytes) | 348,200,640 | 93,101,760 |
| Size | 332.1 MB | 88.8 MB |
| Events in quadrant A | 2,865,419 | 629,178 |
| Events in quadrant B | 3,431,921 | 618,451 |
| Events in quadrant C | 2,922,137 | 629,594 |
| Events in quadrant D | 3,246,673 | 562,118 |
| Mode M9 | |||
|---|---|---|---|
| Quadrant | BADHDUFLAG | Total packets | Discarded packets |
| A | 0 | 36 | 0 |
| B | 0 | 36 | 0 |
| C | 0 | 36 | 0 |
| D | 0 | 36 | 0 |
| Mode SS | |||
|---|---|---|---|
| Quadrant | BADHDUFLAG | Total packets | Discarded packets |
| A | 0 | 112 | 0 |
| B | 0 | 112 | 0 |
| C | 0 | 112 | 0 |
| D | 0 | 112 | 0 |
| Mode M0 | |||
|---|---|---|---|
| Quadrant | BADHDUFLAG | Total packets | Discarded packets |
| A | 0 | 11968 | 3 |
| B | 0 | 14078 | 2 |
| C | 0 | 12195 | 2 |
| D | 0 | 13591 | 2 |
| Quadrant | Total seconds | Saturated seconds | Saturation percentage |
|---|---|---|---|
| A | 5429 | 20 | 0.368392% |
| B | 5429 | 368 | 6.778412% |
| C | 5429 | 25 | 0.460490% |
| D | 5429 | 189 | 3.481304% |
Noise dominated data is calculated using 1-second bins in cleaned event files. If a bin has >2000 counts, and if more than 50% of those come from <1% of pixels, then it is considered to be noise-dominated and hence unusable.
| Quadrant | # 1 sec bins | Bins with >0 counts | Bins with >2000 counts | High rate bins dominated by noise | Noise dominated (total time) | Noise dominated (detector-on time) | Marked lightcurve |
|---|---|---|---|---|---|---|---|
| A | 8985 | 5431 | 10 | 10 | 0.11% | 0.18% | 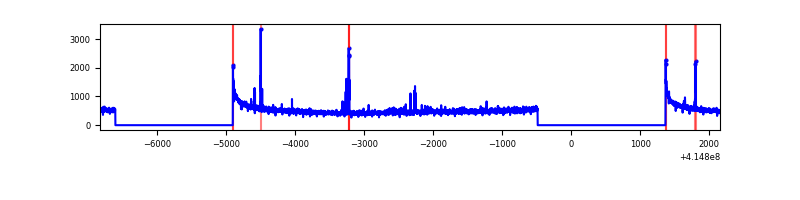 |
| B | 8985 | 5431 | 199 | 199 | 2.21% | 3.66% | 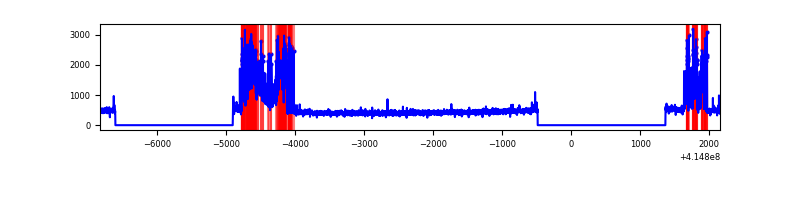 |
| C | 8985 | 5431 | 15 | 15 | 0.17% | 0.28% | 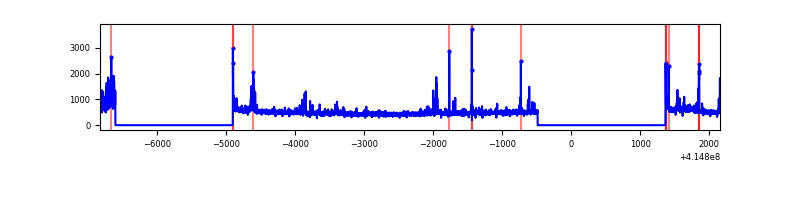 |
| D | 8985 | 5431 | 155 | 155 | 1.73% | 2.85% | 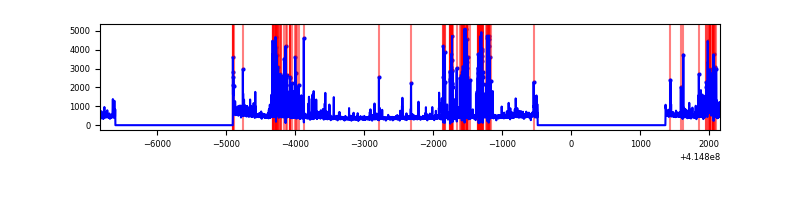 |
Top three noisy pixels from each quadrant. If the there are fewer than three noisy pixels in the level2.evt file, extra rows are filled as -1
| Pixel properties | Quadrant properties | ||||||
|---|---|---|---|---|---|---|---|
| Quadrant | DetID | PixID | Counts | Sigma | Mean | Median | Sigma |
| A | 10 | 83 | 450024 | 3630.96 | 603 | 591 | 123.8 |
| A | 6 | 10 | 43376 | 345.66 | 603 | 591 | 123.8 |
| A | 13 | 248 | 20503 | 160.87 | 603 | 591 | 123.8 |
| B | 4 | 171 | 1072042 | 9304.39 | 595 | 579 | 115.2 |
| B | 12 | 111 | 14218 | 118.44 | 595 | 579 | 115.2 |
| B | 11 | 111 | 12898 | 106.98 | 595 | 579 | 115.2 |
| C | 9 | 187 | 288221 | 2062.67 | 597 | 603 | 139.4 |
| C | 15 | 214 | 238881 | 1708.83 | 597 | 603 | 139.4 |
| C | 14 | 254 | 31546 | 221.91 | 597 | 603 | 139.4 |
| D | 12 | 227 | 626072 | 4387.53 | 580 | 565 | 142.6 |
| D | 2 | 250 | 160223 | 1119.9 | 580 | 565 | 142.6 |
| D | 13 | 249 | 142576 | 996.12 | 580 | 565 | 142.6 |
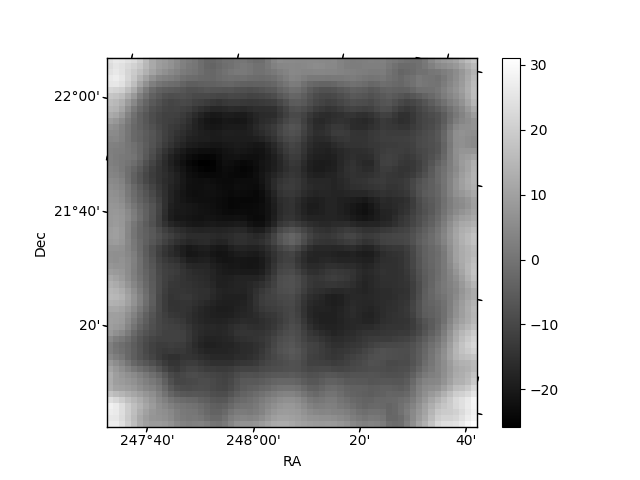
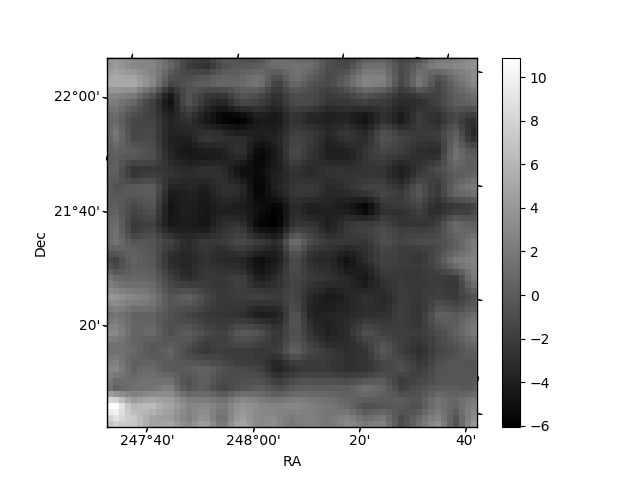
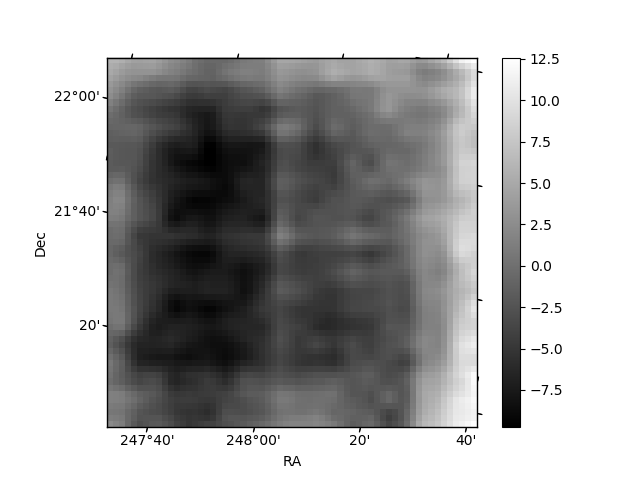
Histogram calculated using DETX and DETY for each event in the final _common_clean file
| Quadrant A | 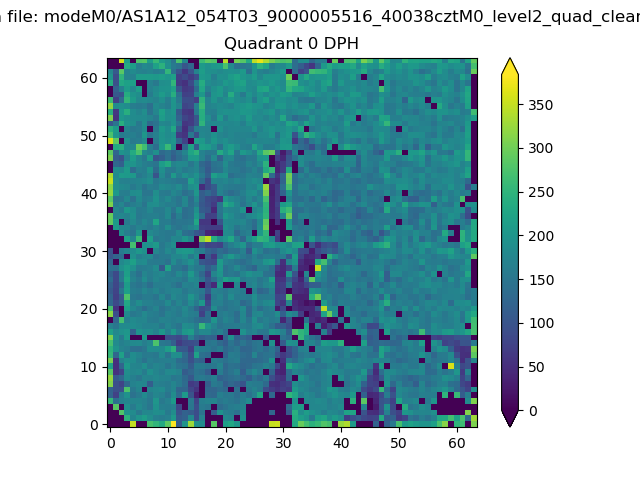 |
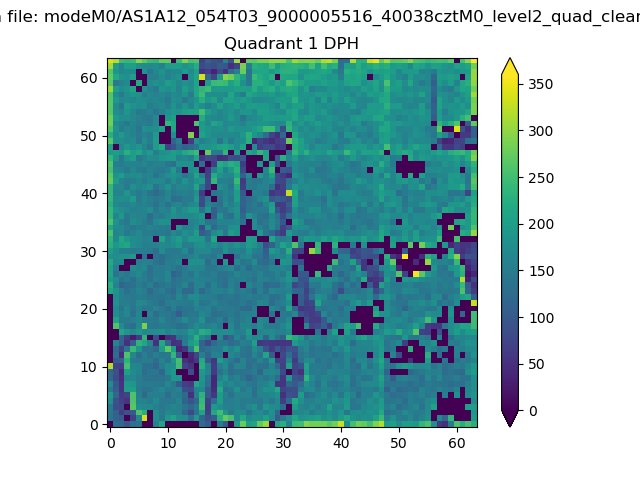 |
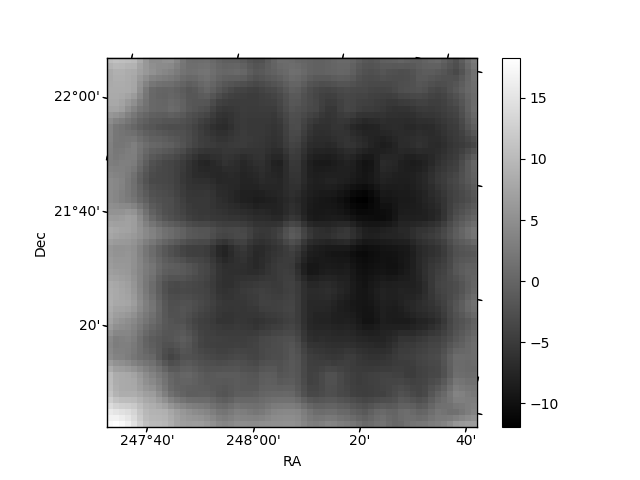
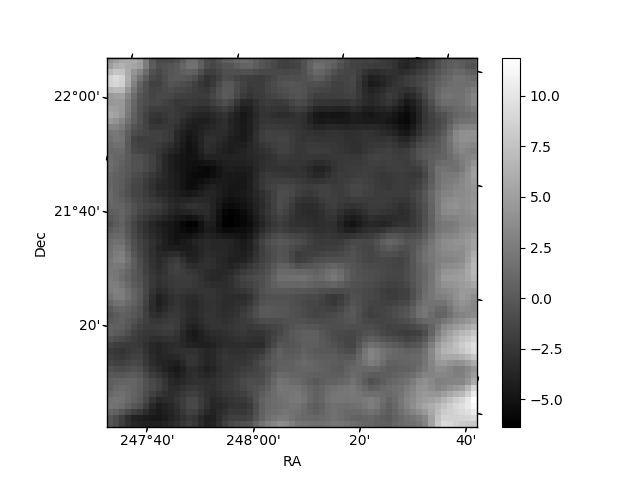
Quadrant B |
|---|---|---|---|
| Quadrant D | 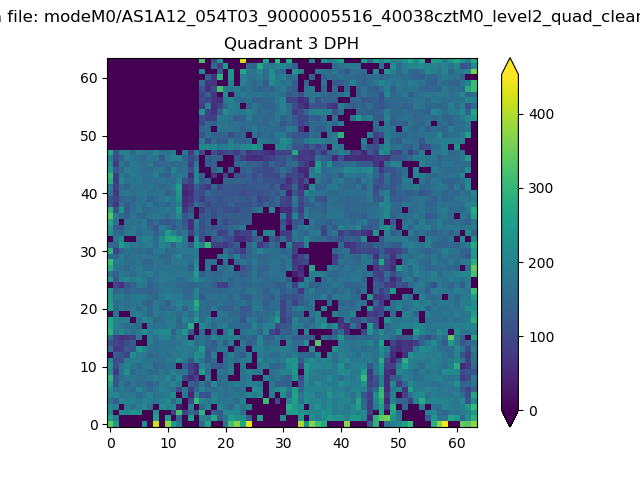 |
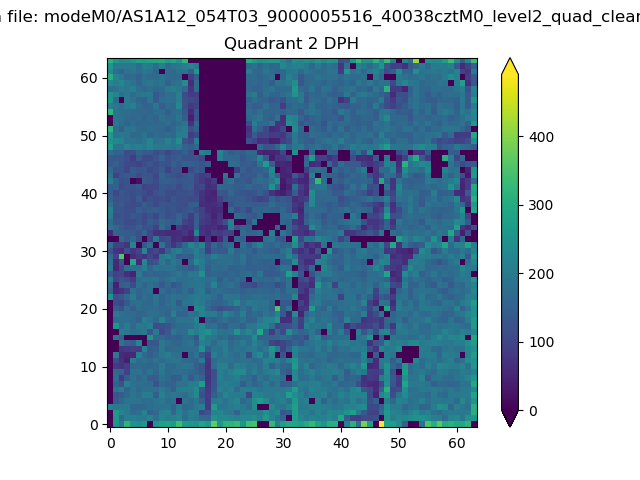 |
Quadrant C |
| Plot type | Count rate plots | Images |
|---|---|---|
| Comparison with Poisson distribution Blue bars denote a histogram of data divided into 1 sec bins. Red curve is a Poisson curve with rate = median count rate of data. |
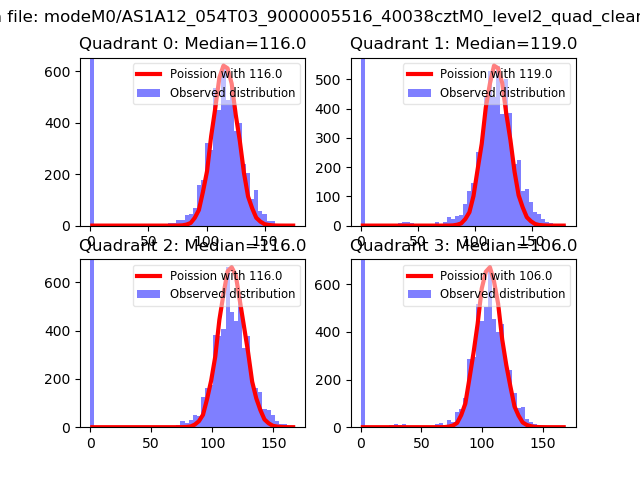 |
 |
| Quadrant-wise count rates Data is divided into 100 sec bins |
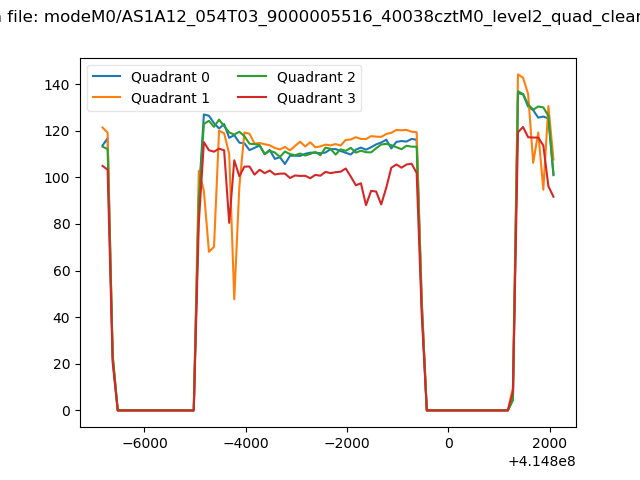 |
|
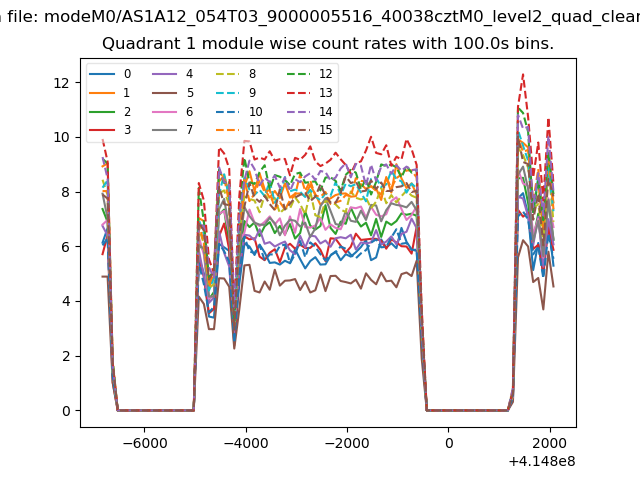
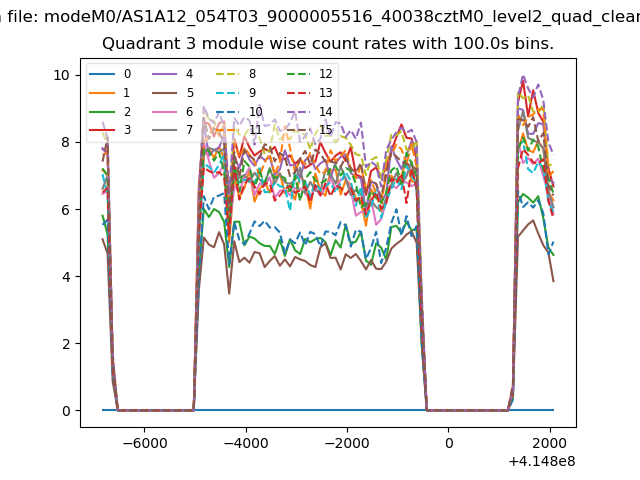
| Module-wise count rates for Quadrant A Data is divided into 100 sec bins |
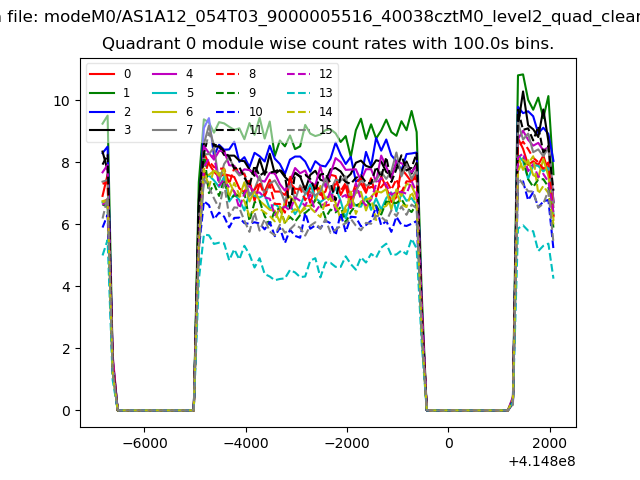 |
 |
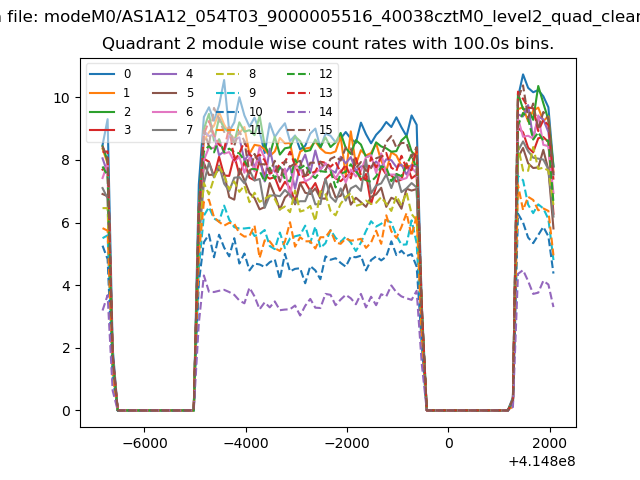
| Module-wise count rates for Quadrant B Data is divided into 100 sec bins |
 |
 |
| Module-wise count rates for Quadrant C Data is divided into 100 sec bins |
 |
 |
| Module-wise count rates for Quadrant D Data is divided into 100 sec bins |
 |
 |
| Parameter | Plot |
|---|---|
| CZT HV Monitor | 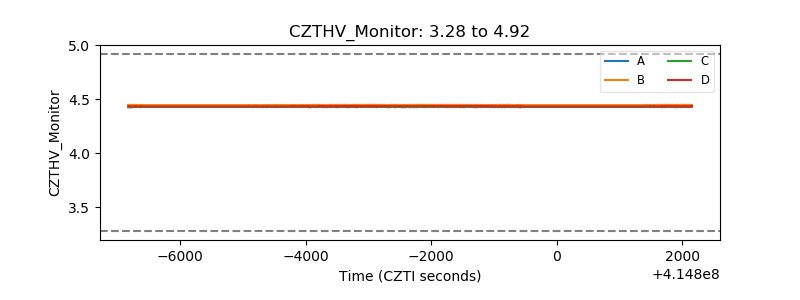 |
| D_VDD | 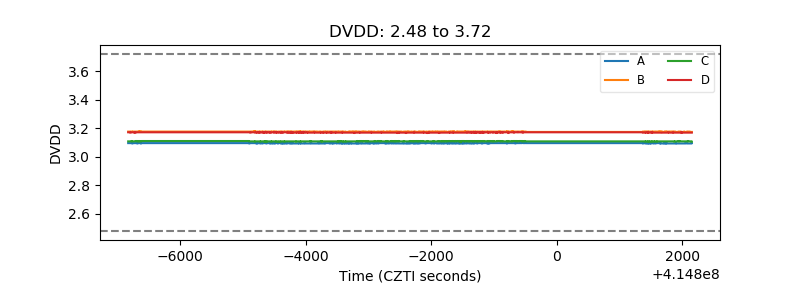 |
| Temperature 1 | 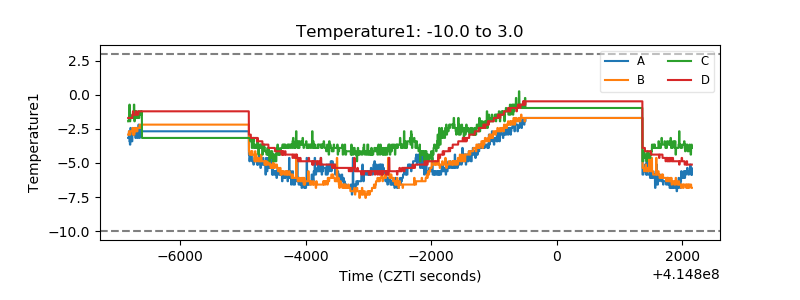 |
| Veto HV Monitor |  |
| Veto LLD | 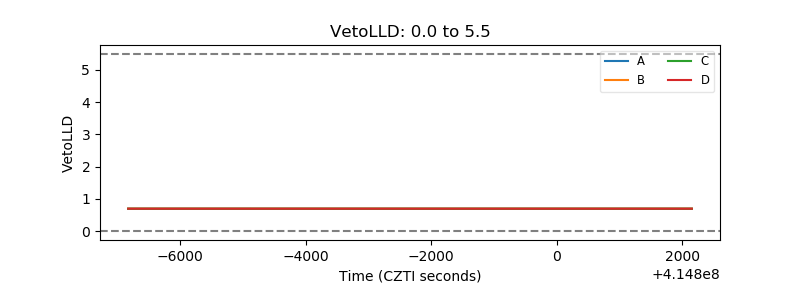 |
| Alpha Counter | 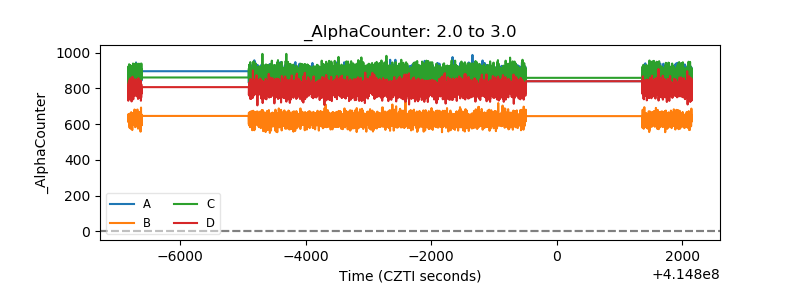 |
| _CPM_Rate | 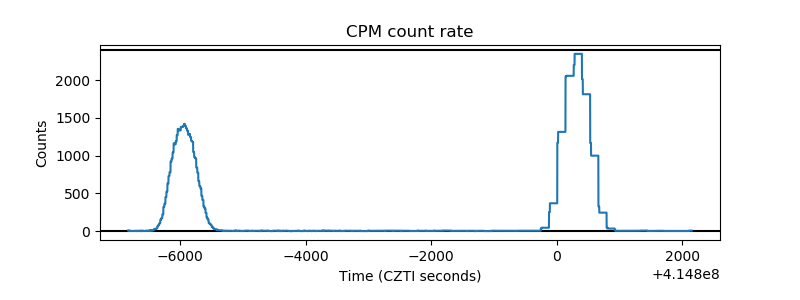 |
| CZT Counter | 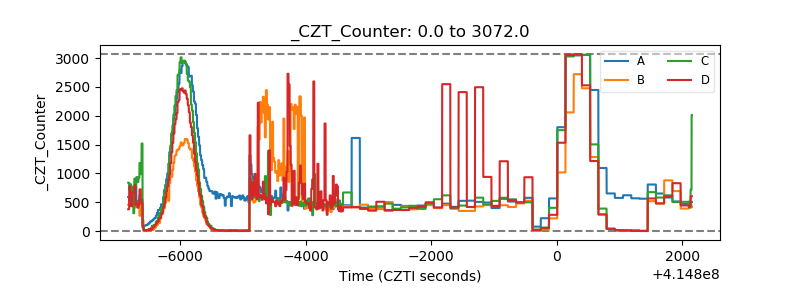 |
| +2.5 Volts monitor | 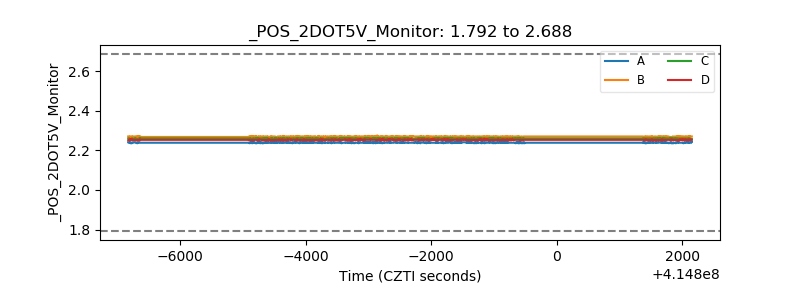 |
| +5 Volts monitor | 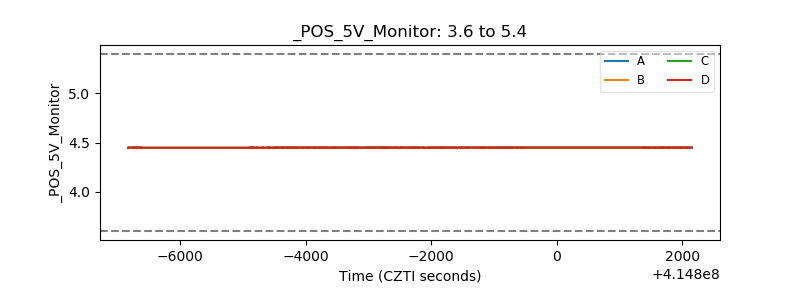 |
| _ROLL_ROT | 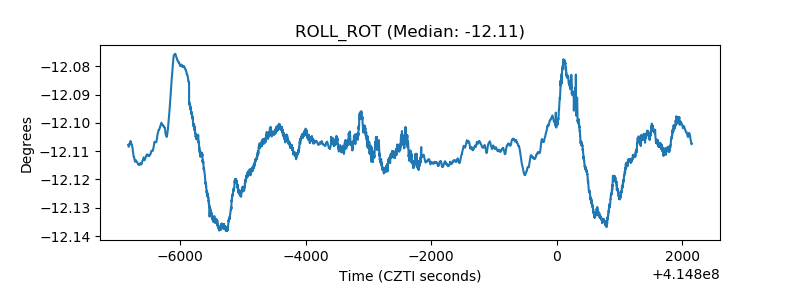 |
| _Roll_DEC | 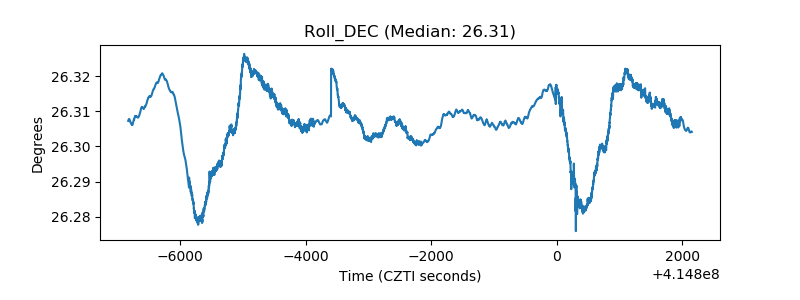 |
| _Roll_RA | 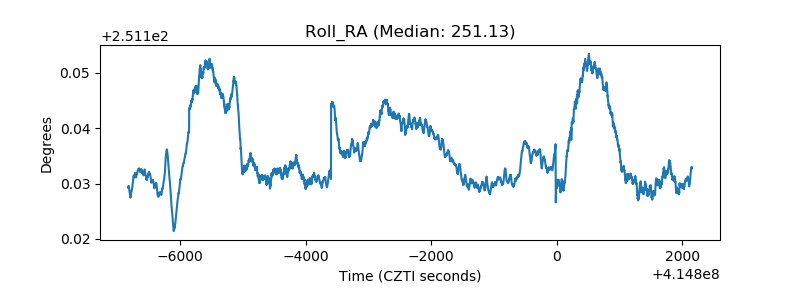 |
| Veto Counter | 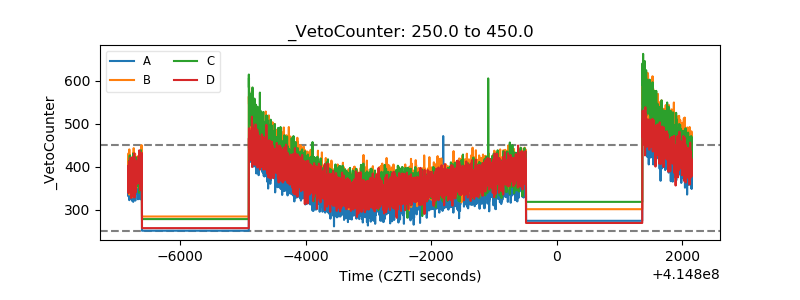 |