| Param | Original file | Final file |
|---|---|---|
| Filename | modeM0/AS1A12_054T03_9000005516_40040cztM0_level2.fits | modeM0/AS1A12_054T03_9000005516_40040cztM0_level2_quad_clean.evt |
| Size (bytes) | 317,577,600 | 90,285,120 |
| Size | 302.9 MB | 86.1 MB |
| Events in quadrant A | 2,913,043 | 607,015 |
| Events in quadrant B | 2,335,636 | 643,255 |
| Events in quadrant C | 3,204,730 | 597,634 |
| Events in quadrant D | 2,916,311 | 538,916 |
| Mode M9 | |||
|---|---|---|---|
| Quadrant | BADHDUFLAG | Total packets | Discarded packets |
| A | 0 | 36 | 0 |
| B | 0 | 36 | 0 |
| C | 0 | 36 | 0 |
| D | 0 | 37 | 0 |
| Mode SS | |||
|---|---|---|---|
| Quadrant | BADHDUFLAG | Total packets | Discarded packets |
| A | 0 | 100 | 0 |
| B | 0 | 100 | 0 |
| C | 0 | 100 | 0 |
| D | 0 | 100 | 0 |
| Mode M0 | |||
|---|---|---|---|
| Quadrant | BADHDUFLAG | Total packets | Discarded packets |
| A | 0 | 11703 | 3 |
| B | 0 | 10159 | 2 |
| C | 0 | 12721 | 2 |
| D | 0 | 12144 | 2 |
| Quadrant | Total seconds | Saturated seconds | Saturation percentage |
|---|---|---|---|
| A | 4955 | 80 | 1.614531% |
| B | 4955 | 16 | 0.322906% |
| C | 4955 | 103 | 2.078708% |
| D | 4955 | 126 | 2.542886% |
Noise dominated data is calculated using 1-second bins in cleaned event files. If a bin has >2000 counts, and if more than 50% of those come from <1% of pixels, then it is considered to be noise-dominated and hence unusable.
| Quadrant | # 1 sec bins | Bins with >0 counts | Bins with >2000 counts | High rate bins dominated by noise | Noise dominated (total time) | Noise dominated (detector-on time) | Marked lightcurve |
|---|---|---|---|---|---|---|---|
| A | 7047 | 4956 | 48 | 48 | 0.68% | 0.97% | 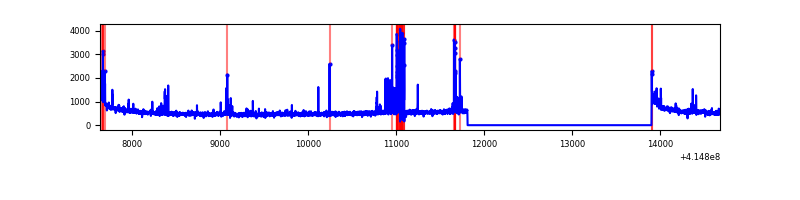 |
| B | 7047 | 4956 | 3 | 3 | 0.04% | 0.06% | 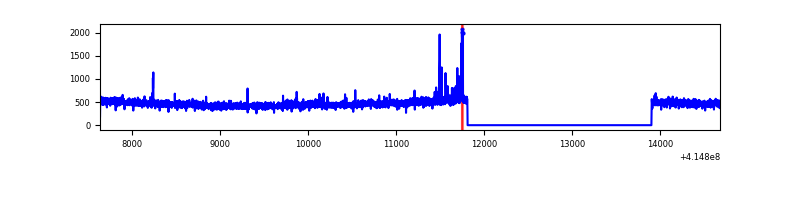 |
| C | 7047 | 4956 | 92 | 92 | 1.31% | 1.86% | 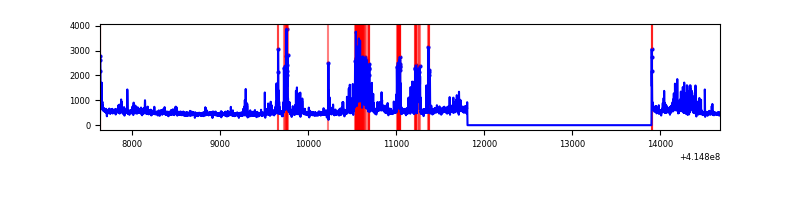 |
| D | 7047 | 4956 | 99 | 99 | 1.40% | 2.00% |  |
Top three noisy pixels from each quadrant. If the there are fewer than three noisy pixels in the level2.evt file, extra rows are filled as -1
| Pixel properties | Quadrant properties | ||||||
|---|---|---|---|---|---|---|---|
| Quadrant | DetID | PixID | Counts | Sigma | Mean | Median | Sigma |
| A | 10 | 83 | 430183 | 3741.34 | 561 | 551 | 114.8 |
| A | 13 | 248 | 245477 | 2132.88 | 561 | 551 | 114.8 |
| A | 10 | 255 | 22502 | 191.15 | 561 | 551 | 114.8 |
| B | 5 | 32 | 33466 | 306.01 | 569 | 556 | 107.5 |
| B | 0 | 230 | 23331 | 211.77 | 569 | 556 | 107.5 |
| B | 0 | 221 | 15457 | 138.56 | 569 | 556 | 107.5 |
| C | 9 | 187 | 757523 | 5939.91 | 550 | 555 | 127.4 |
| C | 15 | 214 | 217855 | 1705.14 | 550 | 555 | 127.4 |
| C | 14 | 254 | 38949 | 301.27 | 550 | 555 | 127.4 |
| D | 12 | 227 | 556328 | 4261.89 | 539 | 526 | 130.4 |
| D | 13 | 249 | 110310 | 841.82 | 539 | 526 | 130.4 |
| D | 2 | 250 | 81034 | 617.34 | 539 | 526 | 130.4 |
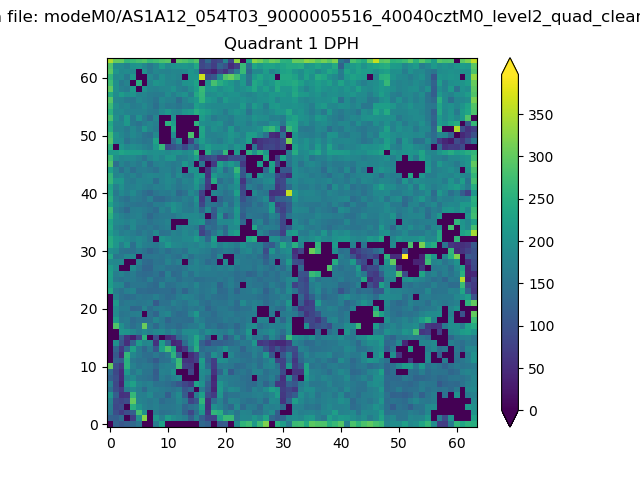
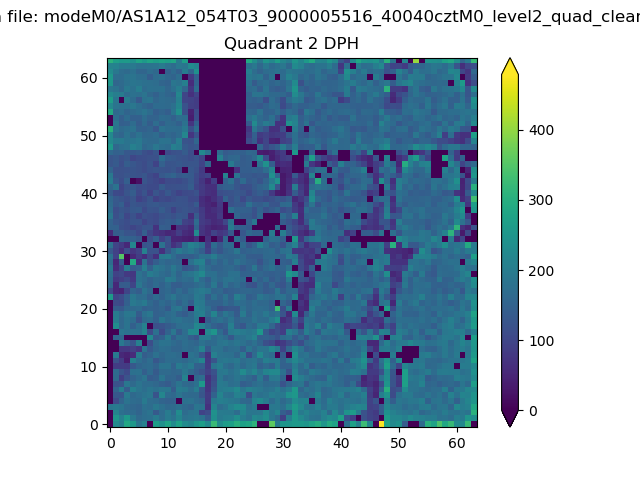
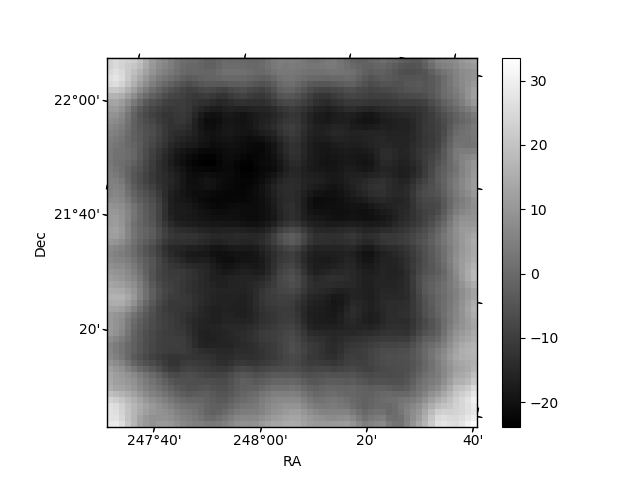
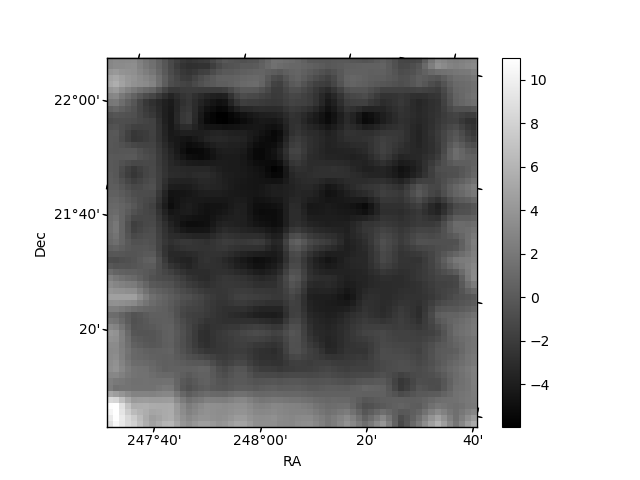
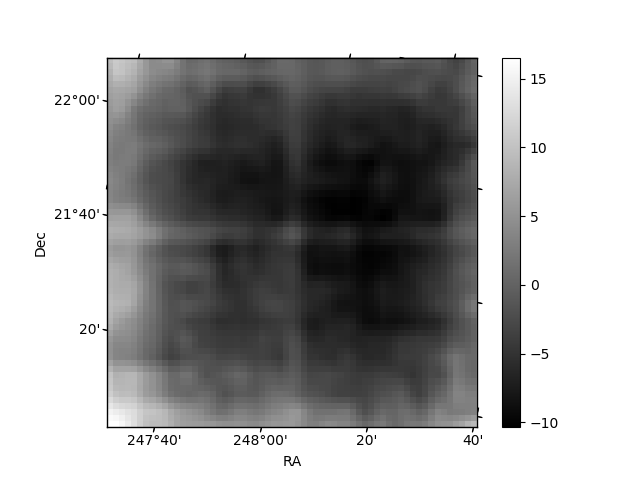
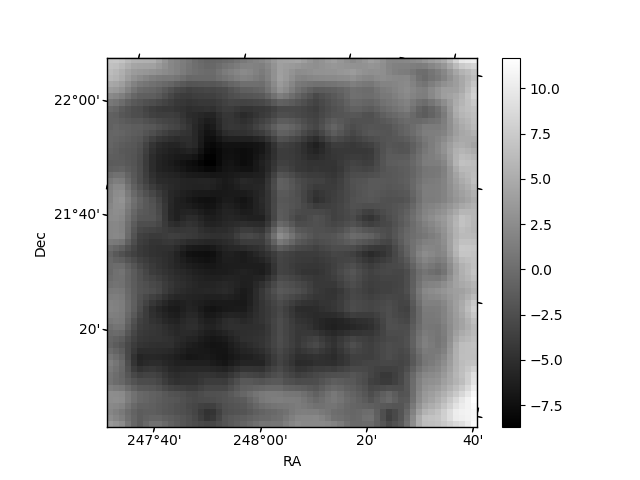
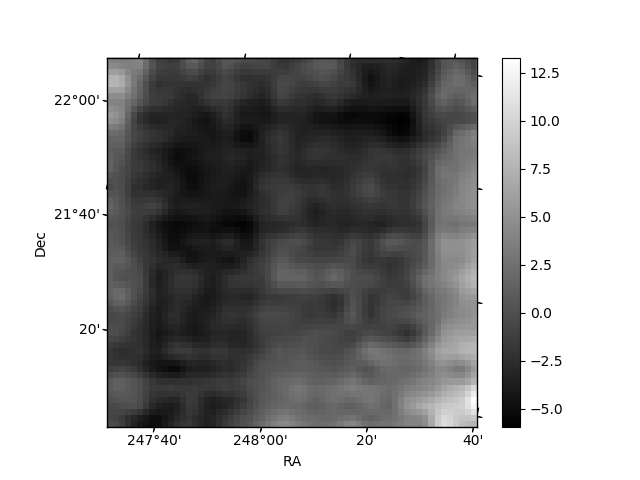
Histogram calculated using DETX and DETY for each event in the final _common_clean file
| Quadrant A | 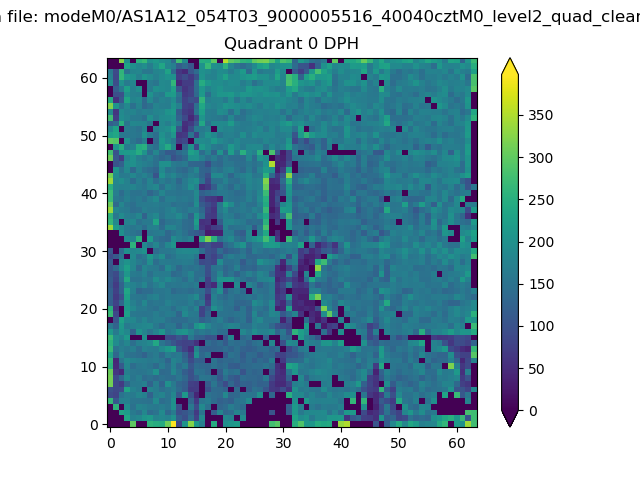 |
 |
Quadrant B |
|---|---|---|---|
| Quadrant D | 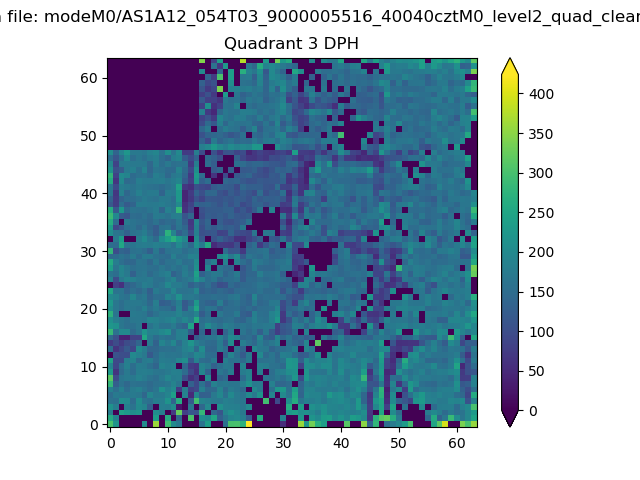 |
 |
Quadrant C |
| Plot type | Count rate plots | Images |
|---|---|---|
| Comparison with Poisson distribution Blue bars denote a histogram of data divided into 1 sec bins. Red curve is a Poisson curve with rate = median count rate of data. |
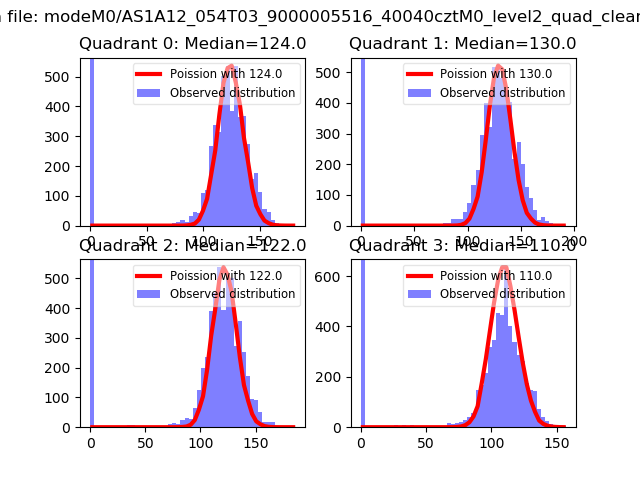 |
 |
| Quadrant-wise count rates Data is divided into 100 sec bins |
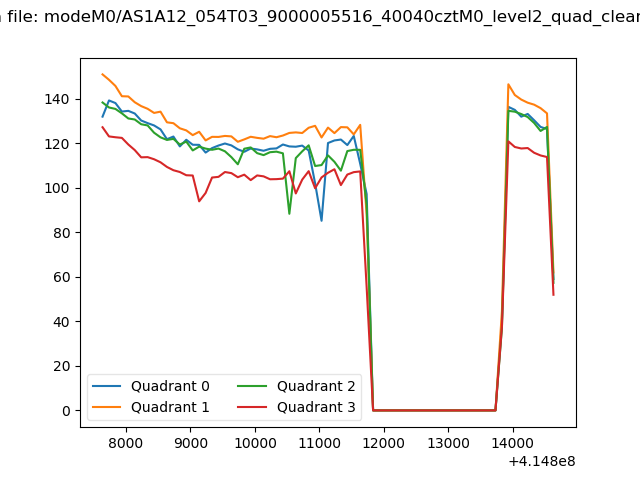 |
|
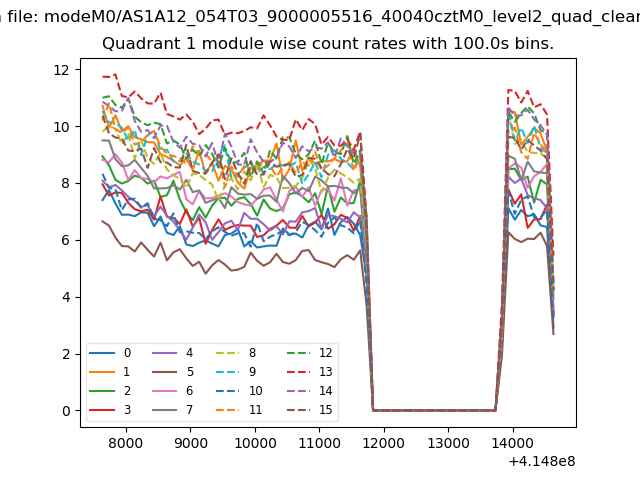
| Module-wise count rates for Quadrant A Data is divided into 100 sec bins |
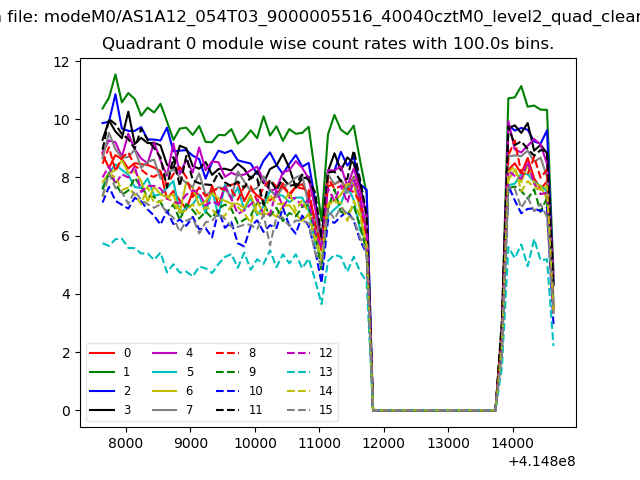 |
 |
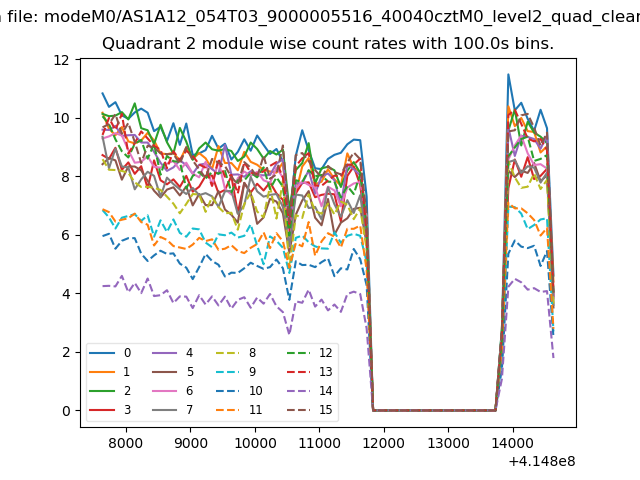
| Module-wise count rates for Quadrant B Data is divided into 100 sec bins |
 |
 |
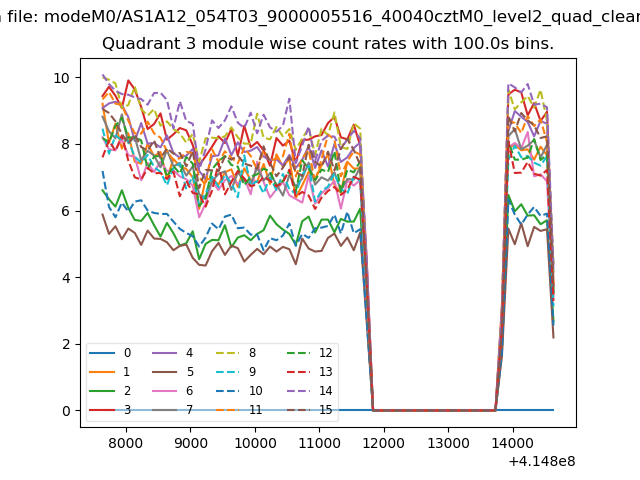
| Module-wise count rates for Quadrant C Data is divided into 100 sec bins |
 |
 |
| Module-wise count rates for Quadrant D Data is divided into 100 sec bins |
 |
 |
| Parameter | Plot |
|---|---|
| CZT HV Monitor | 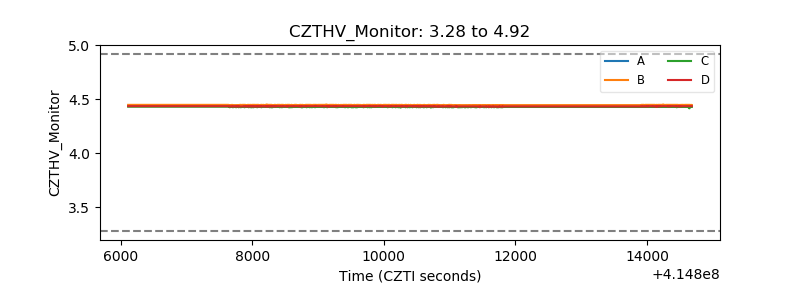 |
| D_VDD | 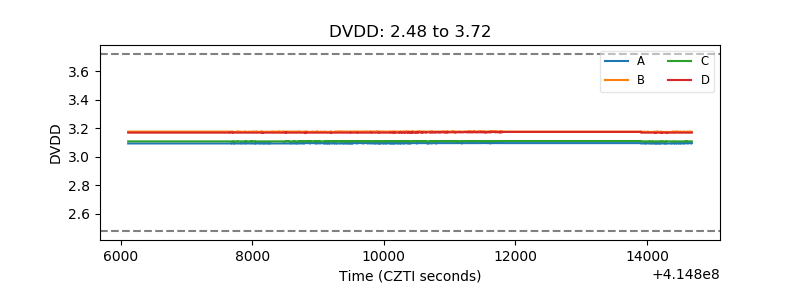 |
| Temperature 1 | 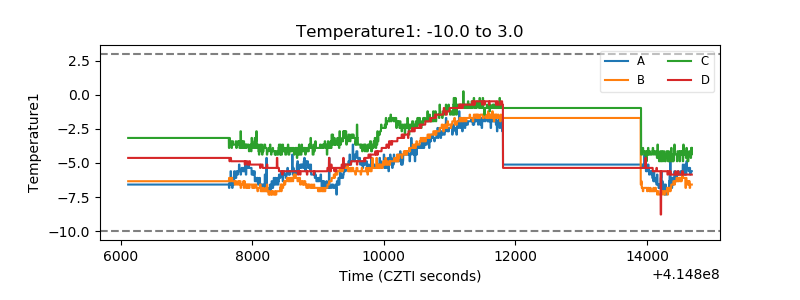 |
| Veto HV Monitor | 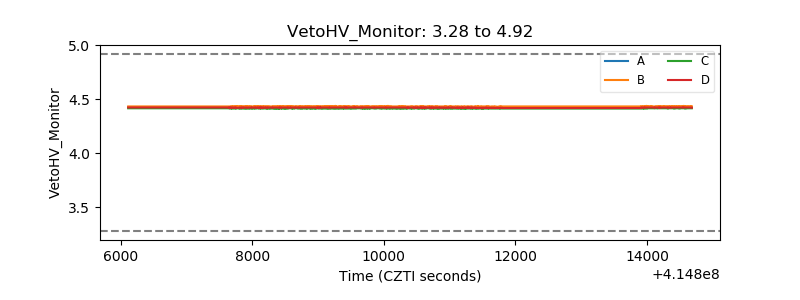 |
| Veto LLD | 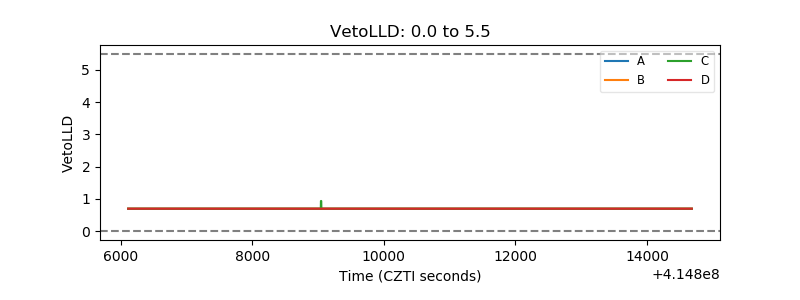 |
| Alpha Counter | 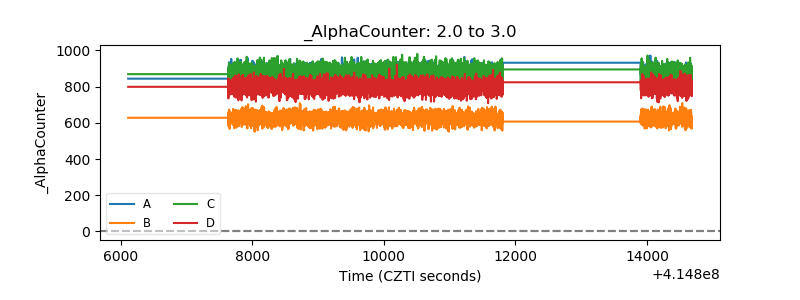 |
| _CPM_Rate | 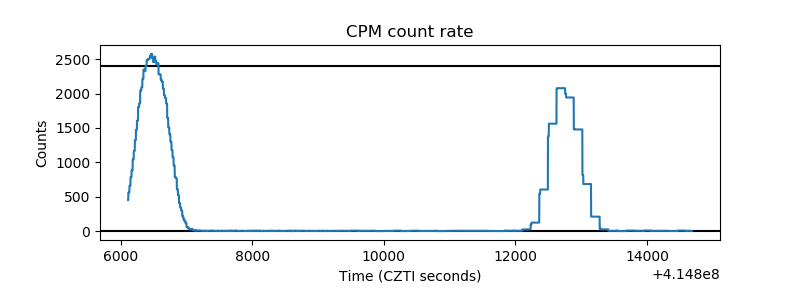 |
| CZT Counter | 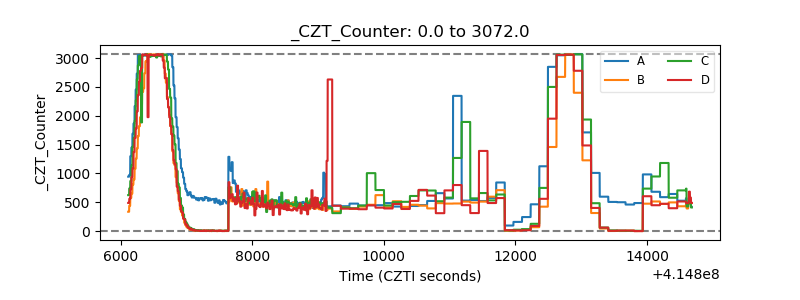 |
| +2.5 Volts monitor | 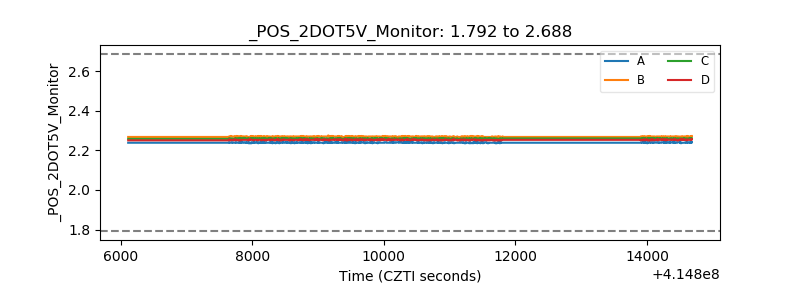 |
| +5 Volts monitor | 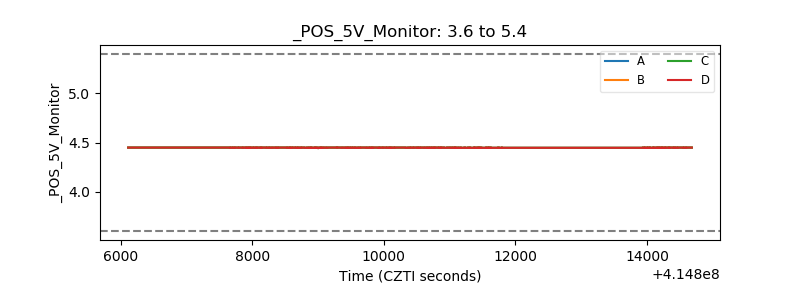 |
| _ROLL_ROT | 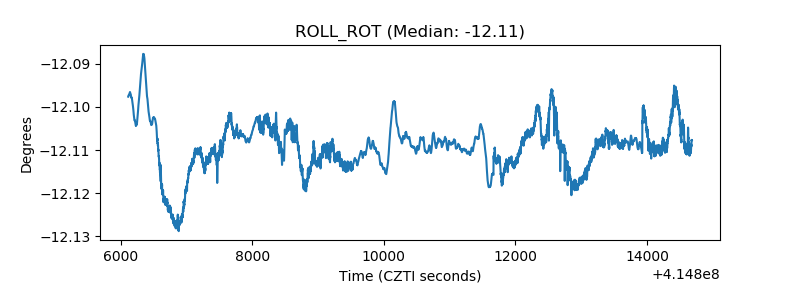 |
| _Roll_DEC | 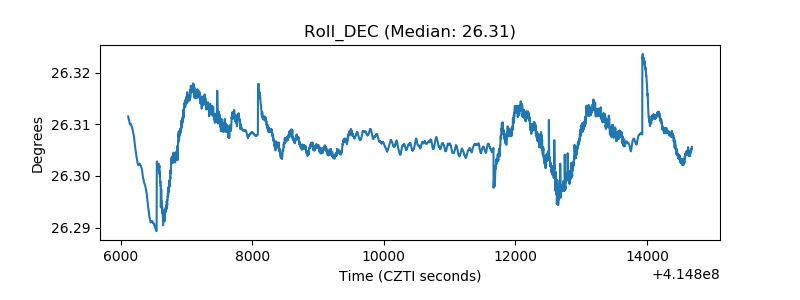 |
| _Roll_RA | 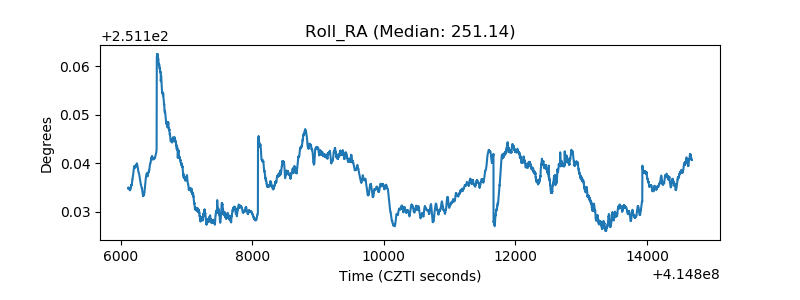 |
| Veto Counter | 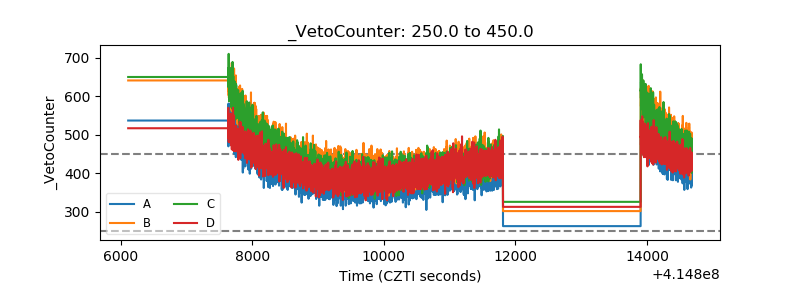 |