| Param | Original file | Final file |
|---|---|---|
| Filename | modeM0/AS1A12_054T03_9000005516_40041cztM0_level2.fits | modeM0/AS1A12_054T03_9000005516_40041cztM0_level2_quad_clean.evt |
| Size (bytes) | 351,388,800 | 93,850,560 |
| Size | 335.1 MB | 89.5 MB |
| Events in quadrant A | 2,824,868 | 632,092 |
| Events in quadrant B | 2,386,660 | 664,463 |
| Events in quadrant C | 4,171,023 | 618,493 |
| Events in quadrant D | 3,218,471 | 561,056 |
| Mode M9 | |||
|---|---|---|---|
| Quadrant | BADHDUFLAG | Total packets | Discarded packets |
| A | 0 | 40 | 0 |
| B | 0 | 40 | 0 |
| C | 0 | 40 | 0 |
| D | 0 | 41 | 0 |
| Mode SS | |||
|---|---|---|---|
| Quadrant | BADHDUFLAG | Total packets | Discarded packets |
| A | 0 | 108 | 0 |
| B | 0 | 108 | 0 |
| C | 0 | 108 | 0 |
| D | 0 | 108 | 0 |
| Mode M0 | |||
|---|---|---|---|
| Quadrant | BADHDUFLAG | Total packets | Discarded packets |
| A | 0 | 11537 | 3 |
| B | 0 | 10591 | 2 |
| C | 0 | 15944 | 2 |
| D | 0 | 13248 | 2 |
| Quadrant | Total seconds | Saturated seconds | Saturation percentage |
|---|---|---|---|
| A | 5220 | 9 | 0.172414% |
| B | 5220 | 7 | 0.134100% |
| C | 5220 | 129 | 2.471264% |
| D | 5220 | 88 | 1.685824% |
Noise dominated data is calculated using 1-second bins in cleaned event files. If a bin has >2000 counts, and if more than 50% of those come from <1% of pixels, then it is considered to be noise-dominated and hence unusable.
| Quadrant | # 1 sec bins | Bins with >0 counts | Bins with >2000 counts | High rate bins dominated by noise | Noise dominated (total time) | Noise dominated (detector-on time) | Marked lightcurve |
|---|---|---|---|---|---|---|---|
| A | 7372 | 5221 | 4 | 4 | 0.05% | 0.08% | 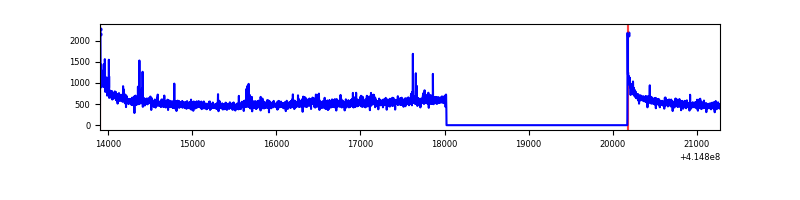 |
| B | 7372 | 5221 | 1 | 1 | 0.01% | 0.02% | 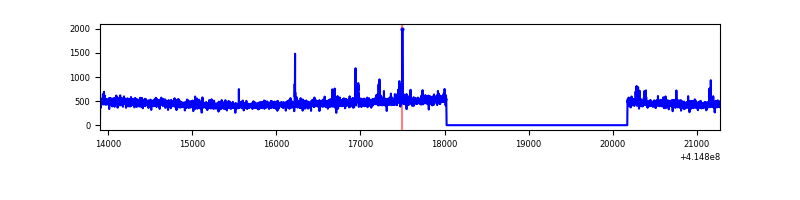 |
| C | 7372 | 5221 | 107 | 107 | 1.45% | 2.05% | 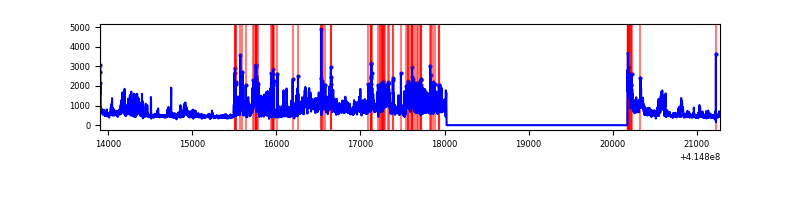 |
| D | 7372 | 5221 | 71 | 71 | 0.96% | 1.36% | 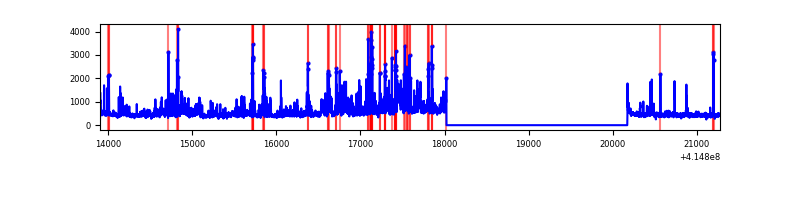 |
Top three noisy pixels from each quadrant. If the there are fewer than three noisy pixels in the level2.evt file, extra rows are filled as -1
| Pixel properties | Quadrant properties | ||||||
|---|---|---|---|---|---|---|---|
| Quadrant | DetID | PixID | Counts | Sigma | Mean | Median | Sigma |
| A | 10 | 83 | 451327 | 3772.56 | 588 | 576 | 119.5 |
| A | 12 | 189 | 46713 | 386.14 | 588 | 576 | 119.5 |
| A | 10 | 255 | 21244 | 172.98 | 588 | 576 | 119.5 |
| B | 0 | 221 | 46950 | 412.02 | 590 | 576 | 112.6 |
| B | 0 | 230 | 16302 | 139.72 | 590 | 576 | 112.6 |
| B | 12 | 111 | 13463 | 114.5 | 590 | 576 | 112.6 |
| C | 9 | 187 | 1604207 | 12087.28 | 569 | 574 | 132.7 |
| C | 15 | 214 | 215820 | 1622.4 | 569 | 574 | 132.7 |
| C | 14 | 254 | 57710 | 430.66 | 569 | 574 | 132.7 |
| D | 12 | 227 | 717928 | 5237.82 | 561 | 546 | 137.0 |
| D | 1 | 47 | 140520 | 1021.99 | 561 | 546 | 137.0 |
| D | 13 | 249 | 104035 | 755.6 | 561 | 546 | 137.0 |
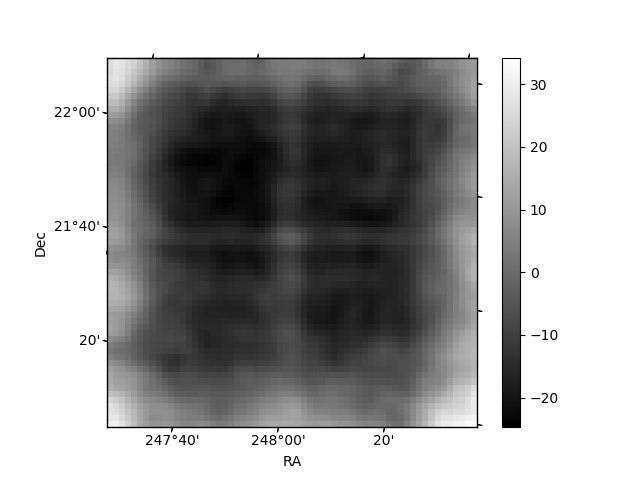
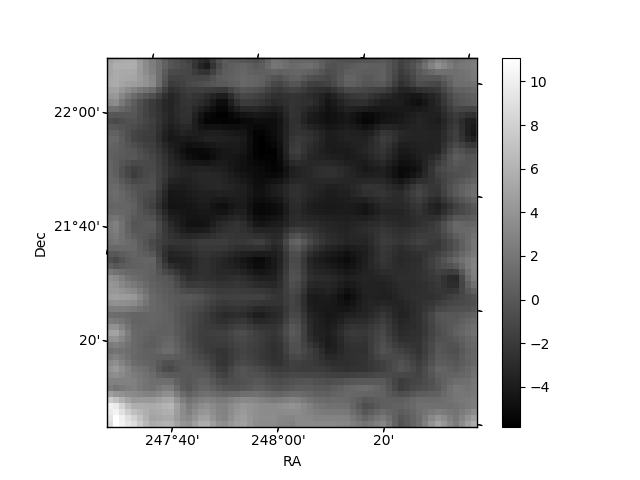
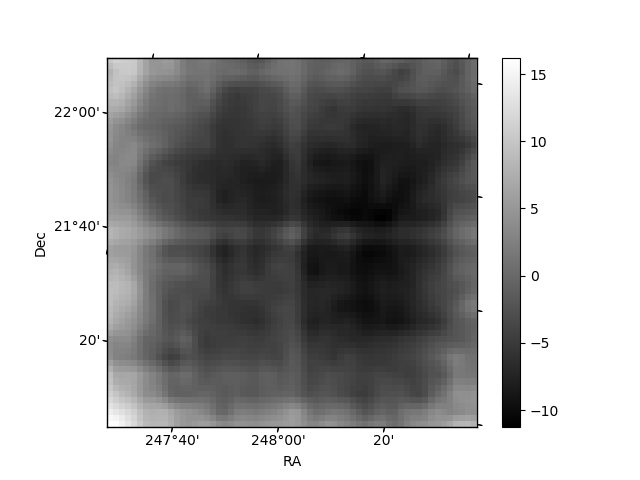
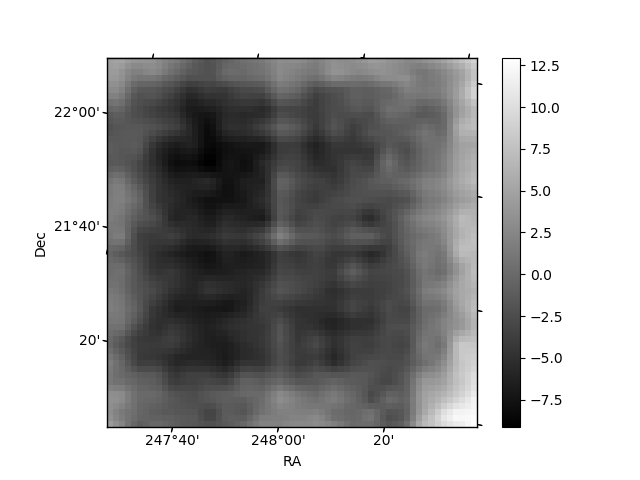
Histogram calculated using DETX and DETY for each event in the final _common_clean file
| Quadrant A | 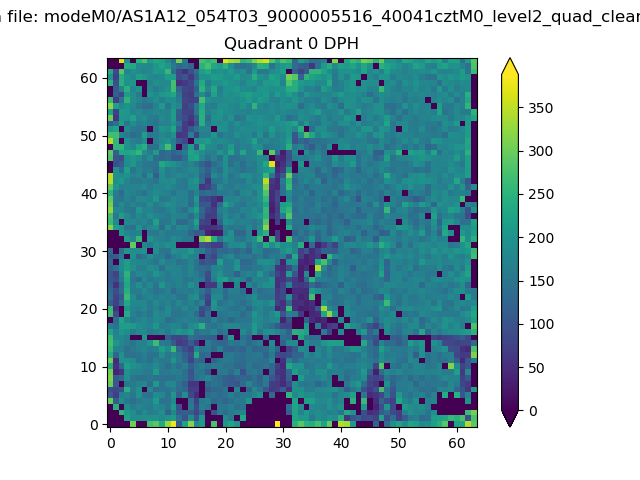 |
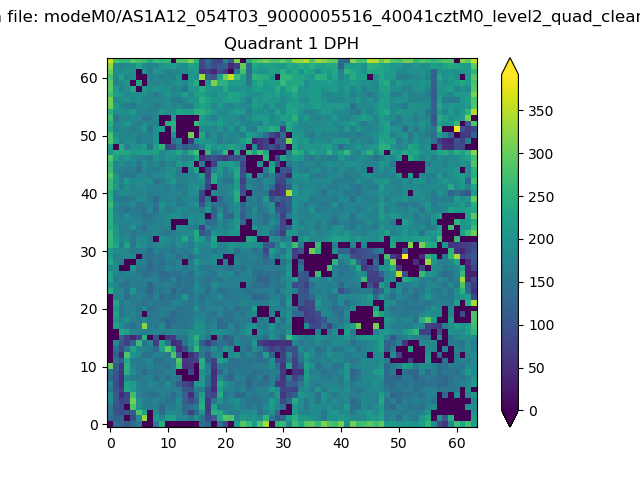 |
Quadrant B |
|---|---|---|---|
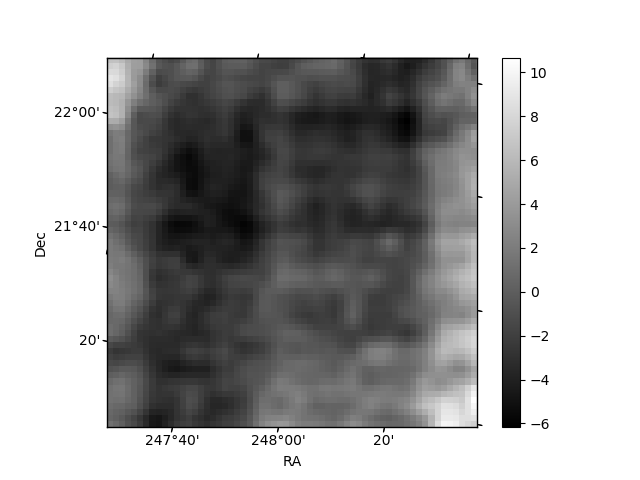
| Quadrant D | 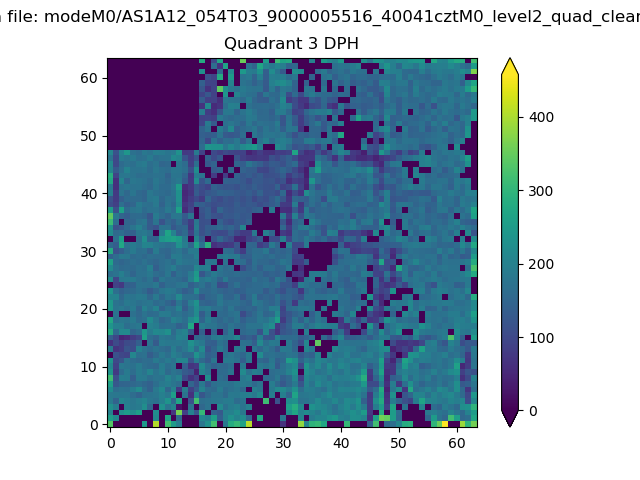 |
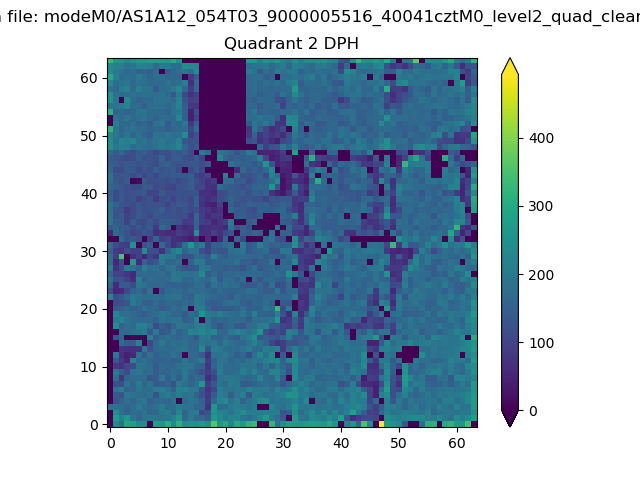 |
Quadrant C |
| Plot type | Count rate plots | Images |
|---|---|---|
| Comparison with Poisson distribution Blue bars denote a histogram of data divided into 1 sec bins. Red curve is a Poisson curve with rate = median count rate of data. |
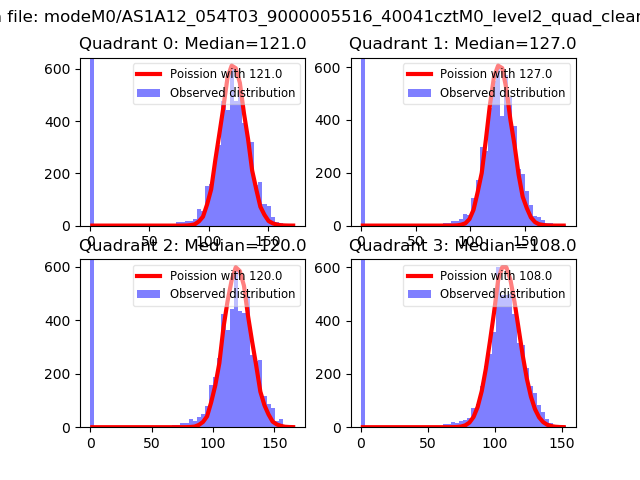 |
 |
| Quadrant-wise count rates Data is divided into 100 sec bins |
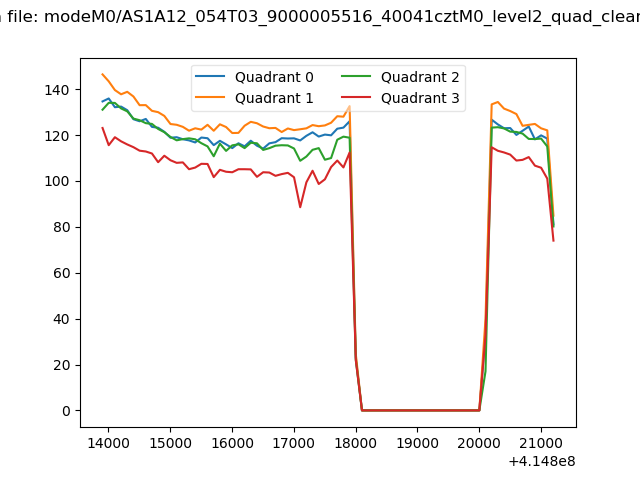 |
|
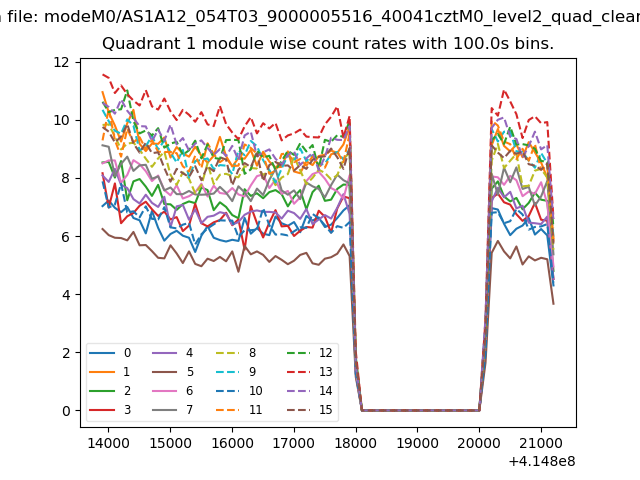
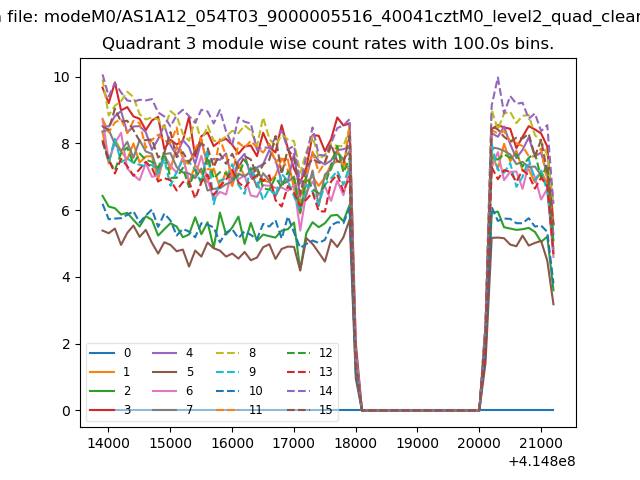
| Module-wise count rates for Quadrant A Data is divided into 100 sec bins |
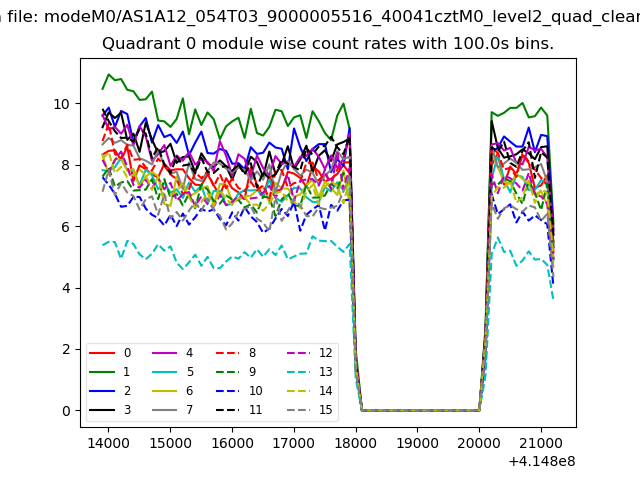 |
 |
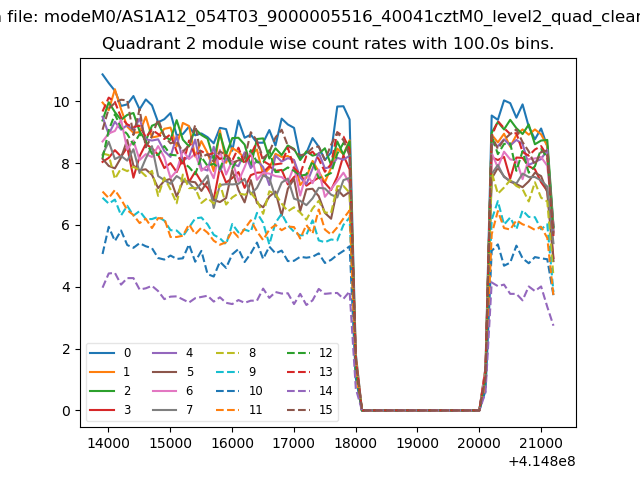
| Module-wise count rates for Quadrant B Data is divided into 100 sec bins |
 |
 |
| Module-wise count rates for Quadrant C Data is divided into 100 sec bins |
 |
 |
| Module-wise count rates for Quadrant D Data is divided into 100 sec bins |
 |
 |
| Parameter | Plot |
|---|---|
| CZT HV Monitor | 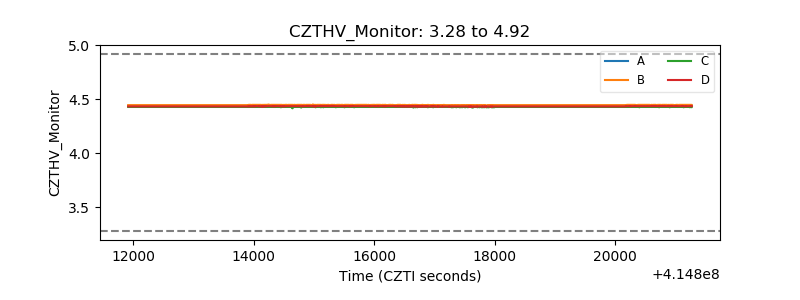 |
| D_VDD | 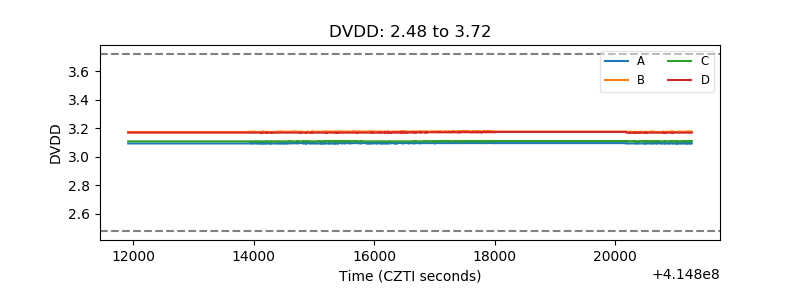 |
| Temperature 1 | 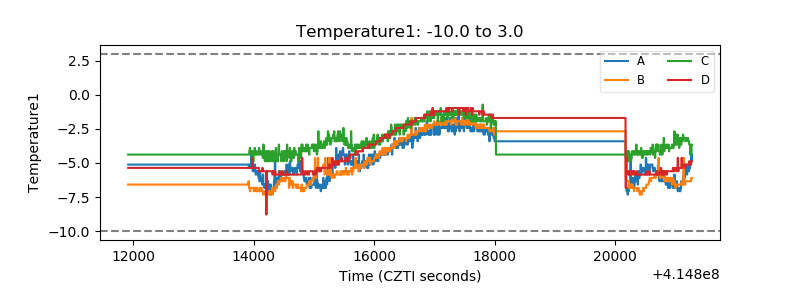 |
| Veto HV Monitor | 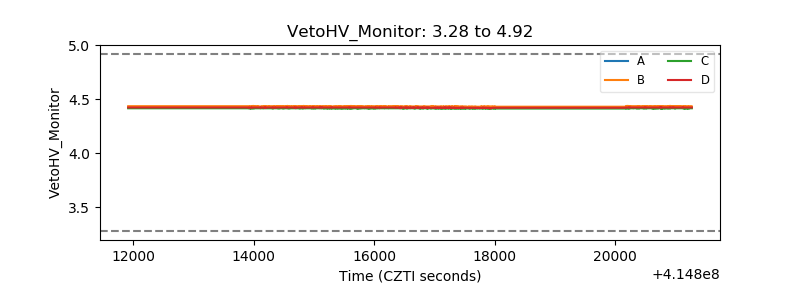 |
| Veto LLD | 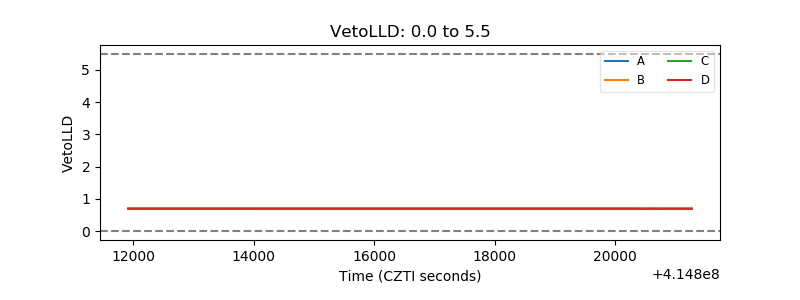 |
| Alpha Counter | 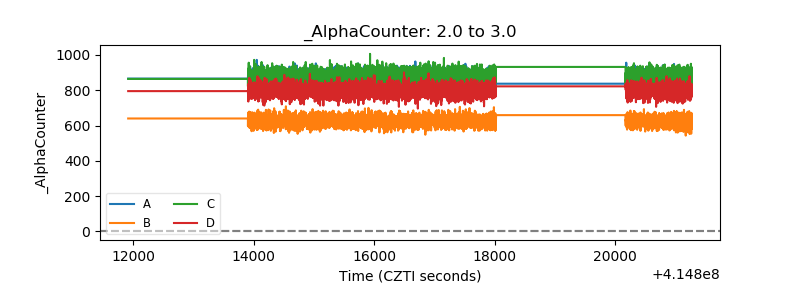 |
| _CPM_Rate | 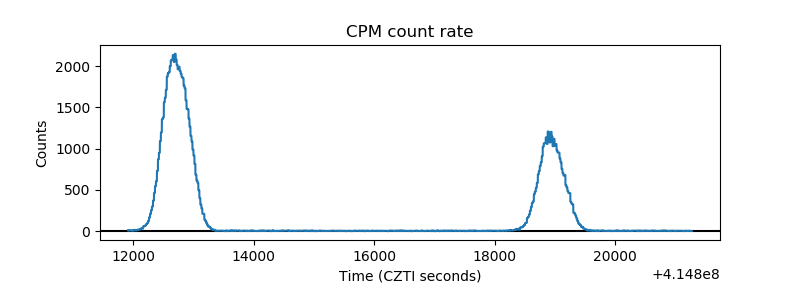 |
| CZT Counter | 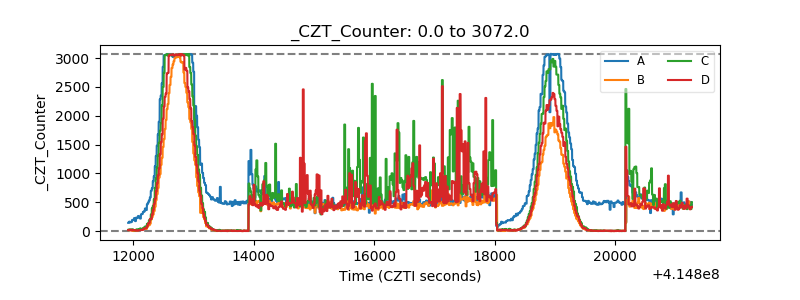 |
| +2.5 Volts monitor | 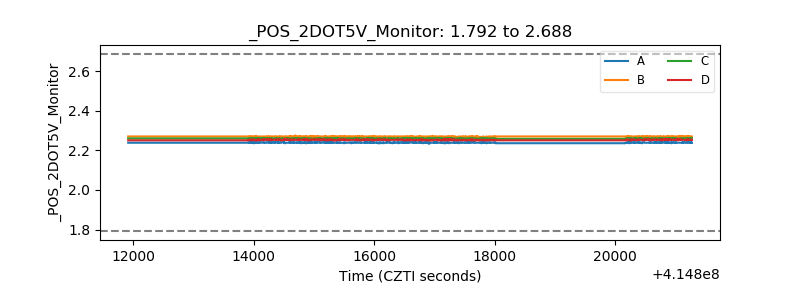 |
| +5 Volts monitor | 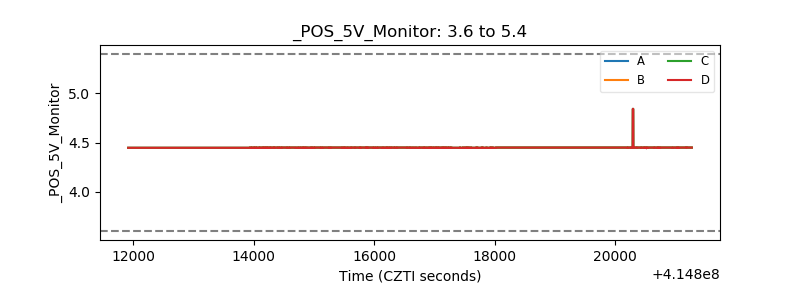 |
| _ROLL_ROT | 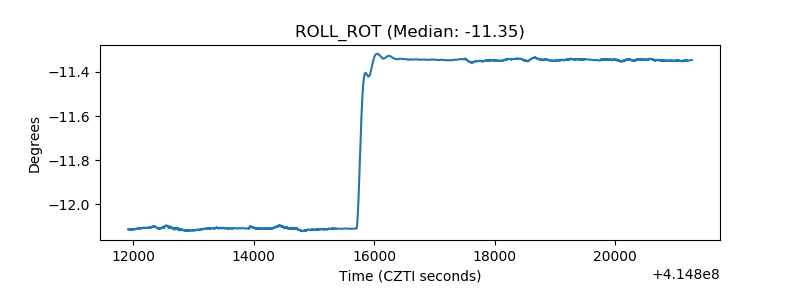 |
| _Roll_DEC | 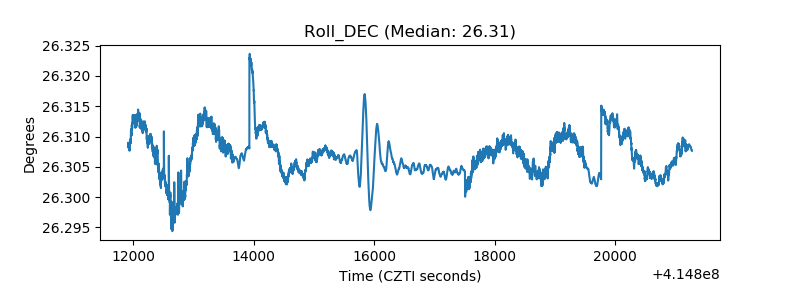 |
| _Roll_RA | 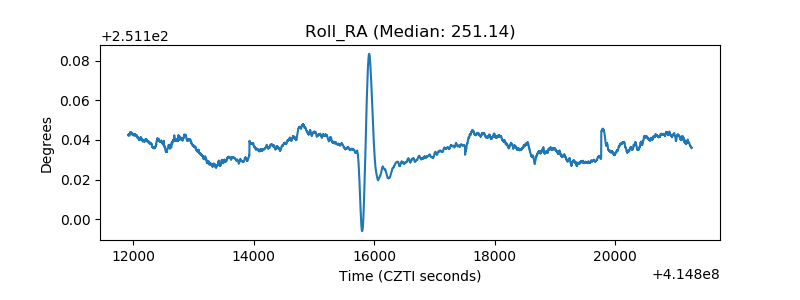 |
| Veto Counter | 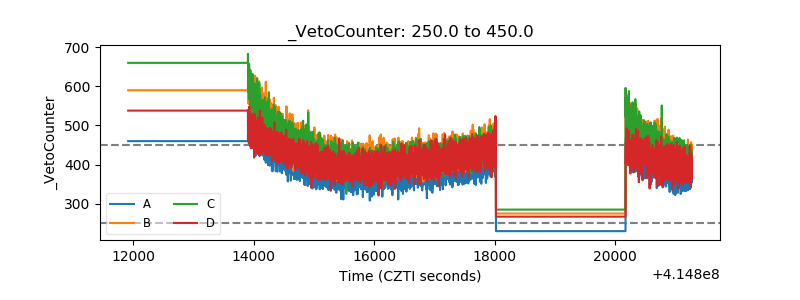 |