| Param | Original file | Final file |
|---|---|---|
| Filename | modeM0/AS1A12_054T03_9000005516_40042cztM0_level2.fits | modeM0/AS1A12_054T03_9000005516_40042cztM0_level2_quad_clean.evt |
| Size (bytes) | 354,113,280 | 90,195,840 |
| Size | 337.7 MB | 86.0 MB |
| Events in quadrant A | 2,837,749 | 608,079 |
| Events in quadrant B | 2,381,943 | 634,857 |
| Events in quadrant C | 3,439,452 | 594,931 |
| Events in quadrant D | 4,042,331 | 527,509 |
| Mode M9 | |||
|---|---|---|---|
| Quadrant | BADHDUFLAG | Total packets | Discarded packets |
| A | 0 | 33 | 0 |
| B | 0 | 33 | 0 |
| C | 0 | 33 | 0 |
| D | 0 | 34 | 0 |
| Mode SS | |||
|---|---|---|---|
| Quadrant | BADHDUFLAG | Total packets | Discarded packets |
| A | 0 | 106 | 0 |
| B | 0 | 106 | 0 |
| C | 0 | 106 | 0 |
| D | 0 | 106 | 0 |
| Mode M0 | |||
|---|---|---|---|
| Quadrant | BADHDUFLAG | Total packets | Discarded packets |
| A | 0 | 11635 | 2 |
| B | 0 | 10788 | 1 |
| C | 0 | 13625 | 1 |
| D | 0 | 15778 | 1 |
| Quadrant | Total seconds | Saturated seconds | Saturation percentage |
|---|---|---|---|
| A | 5227 | 29 | 0.554812% |
| B | 5227 | 7 | 0.133920% |
| C | 5227 | 88 | 1.683566% |
| D | 5227 | 255 | 4.878515% |
Noise dominated data is calculated using 1-second bins in cleaned event files. If a bin has >2000 counts, and if more than 50% of those come from <1% of pixels, then it is considered to be noise-dominated and hence unusable.
| Quadrant | # 1 sec bins | Bins with >0 counts | Bins with >2000 counts | High rate bins dominated by noise | Noise dominated (total time) | Noise dominated (detector-on time) | Marked lightcurve |
|---|---|---|---|---|---|---|---|
| A | 7349 | 5228 | 14 | 14 | 0.19% | 0.27% | 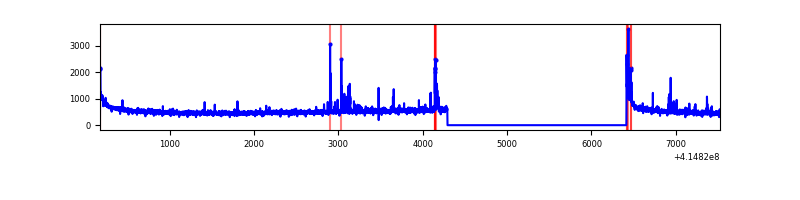 |
| B | 7349 | 5228 | 0 | 0 | 0.00% | 0.00% | 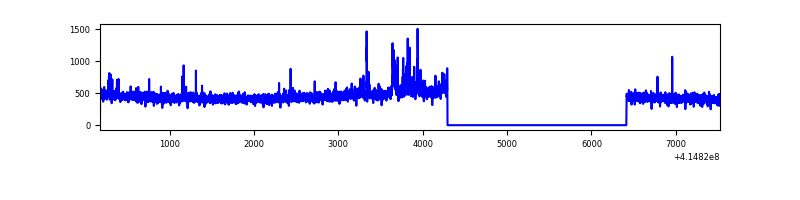 |
| C | 7349 | 5228 | 76 | 76 | 1.03% | 1.45% | 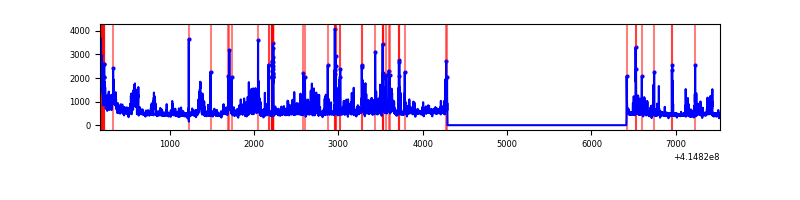 |
| D | 7349 | 5228 | 219 | 219 | 2.98% | 4.19% | 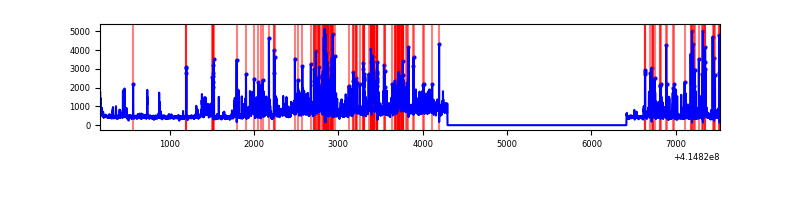 |
Top three noisy pixels from each quadrant. If the there are fewer than three noisy pixels in the level2.evt file, extra rows are filled as -1
| Pixel properties | Quadrant properties | ||||||
|---|---|---|---|---|---|---|---|
| Quadrant | DetID | PixID | Counts | Sigma | Mean | Median | Sigma |
| A | 10 | 83 | 456574 | 3879.83 | 578 | 568 | 117.5 |
| A | 2 | 79 | 44154 | 370.84 | 578 | 568 | 117.5 |
| A | 13 | 248 | 42674 | 358.25 | 578 | 568 | 117.5 |
| B | 4 | 171 | 60535 | 543.73 | 577 | 562 | 110.3 |
| B | 0 | 230 | 33325 | 297.04 | 577 | 562 | 110.3 |
| B | 0 | 221 | 25262 | 223.94 | 577 | 562 | 110.3 |
| C | 9 | 187 | 744612 | 5723.14 | 559 | 564 | 130.0 |
| C | 15 | 214 | 219186 | 1681.62 | 559 | 564 | 130.0 |
| C | 14 | 254 | 207721 | 1593.43 | 559 | 564 | 130.0 |
| D | 12 | 227 | 1236547 | 9178.1 | 548 | 533 | 134.7 |
| D | 2 | 250 | 273731 | 2028.65 | 548 | 533 | 134.7 |
| D | 1 | 52 | 154435 | 1142.81 | 548 | 533 | 134.7 |
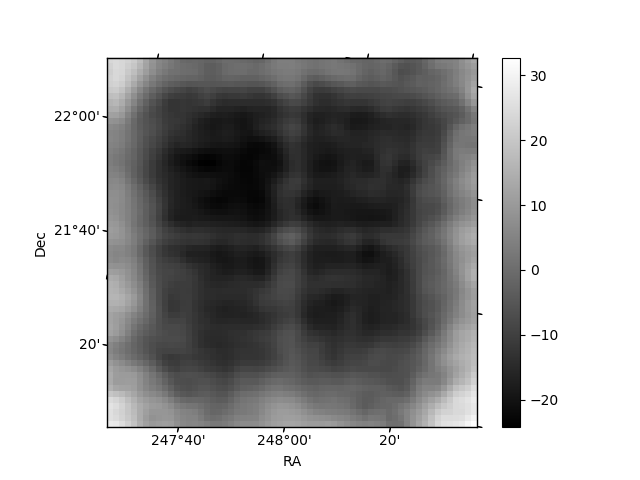
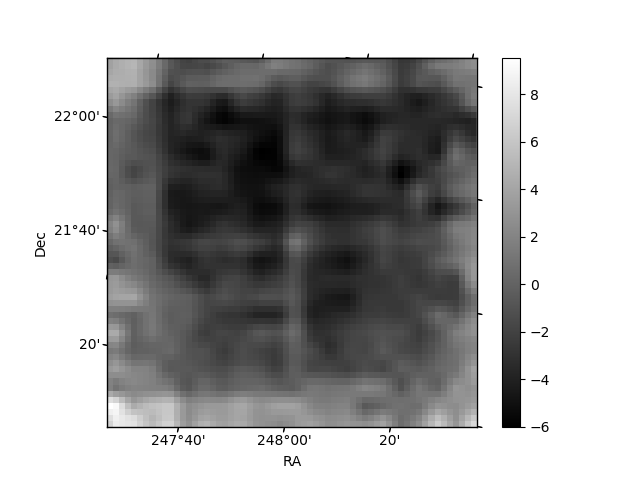
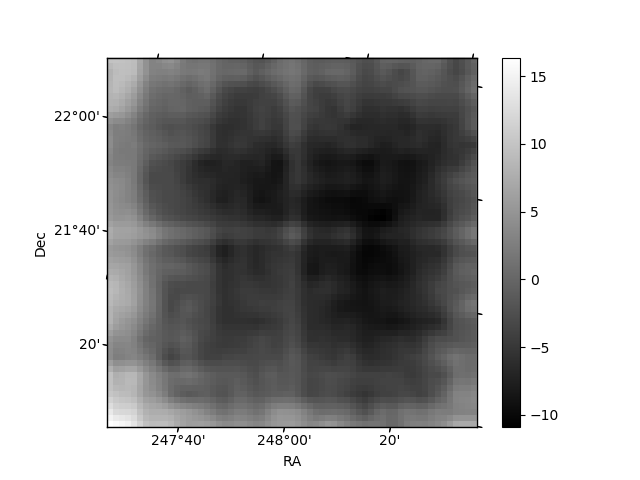
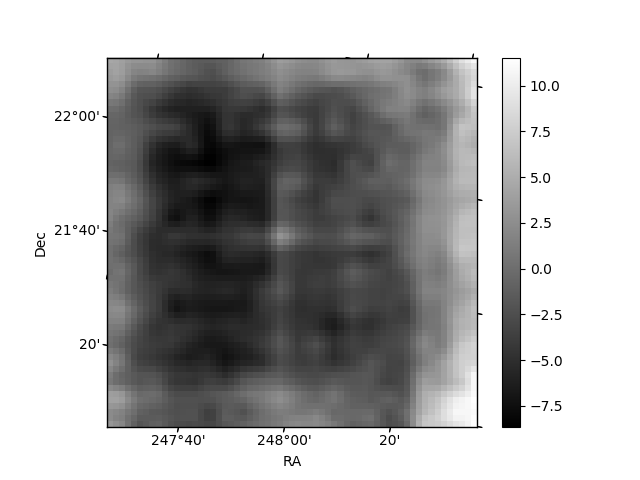
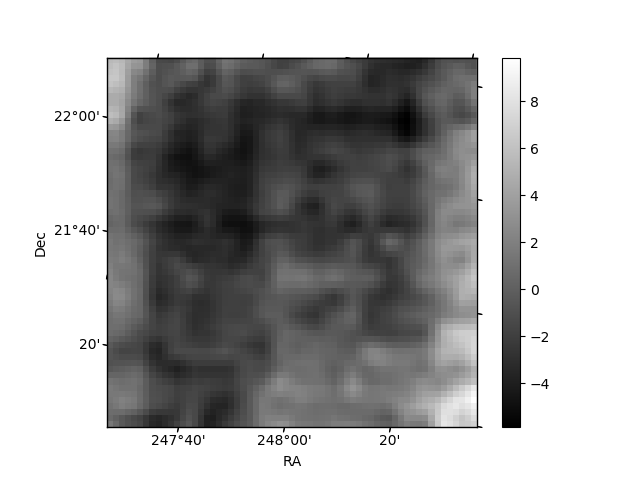
Histogram calculated using DETX and DETY for each event in the final _common_clean file
| Quadrant A | 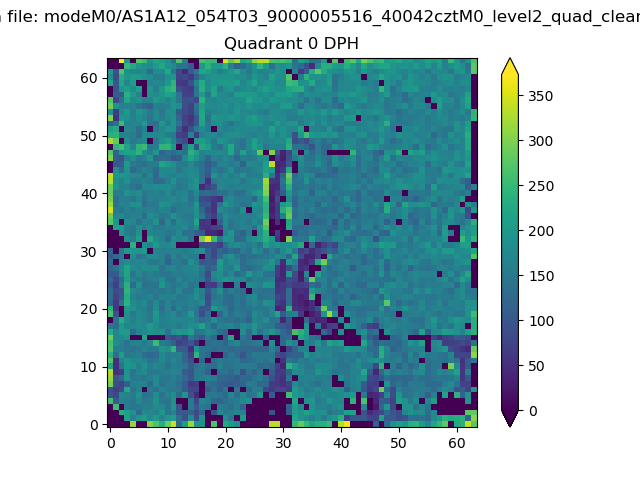 |
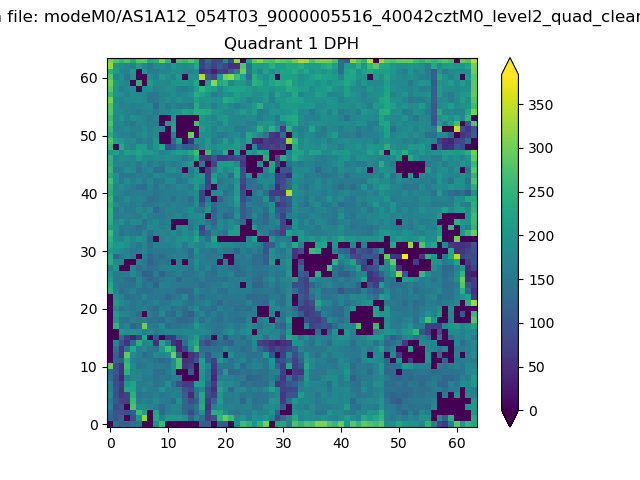 |
Quadrant B |
|---|---|---|---|
| Quadrant D | 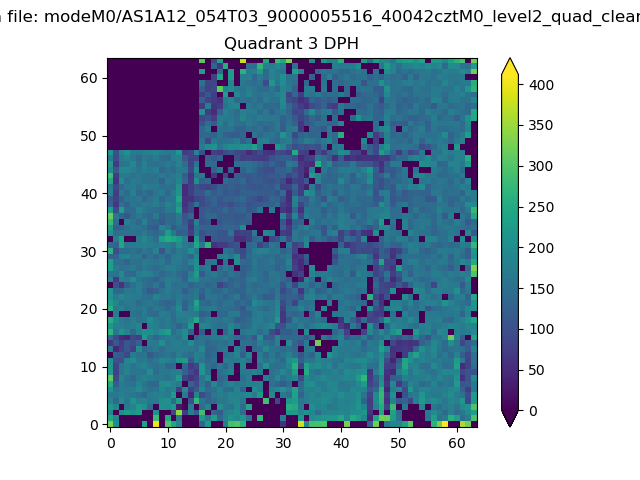 |
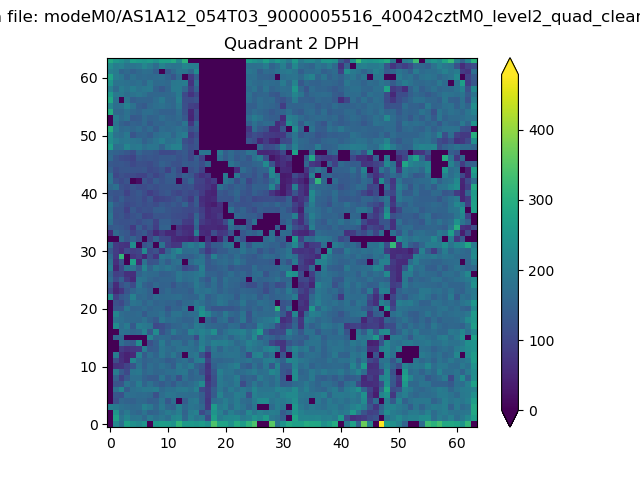 |
Quadrant C |
| Plot type | Count rate plots | Images |
|---|---|---|
| Comparison with Poisson distribution Blue bars denote a histogram of data divided into 1 sec bins. Red curve is a Poisson curve with rate = median count rate of data. |
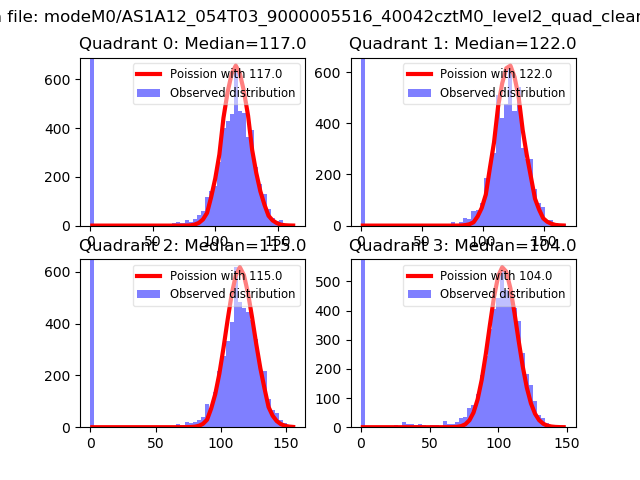 |
 |
| Quadrant-wise count rates Data is divided into 100 sec bins |
 |
|
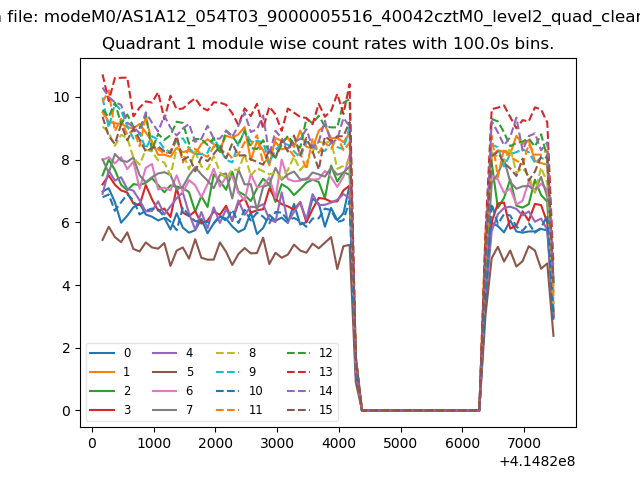
| Module-wise count rates for Quadrant A Data is divided into 100 sec bins |
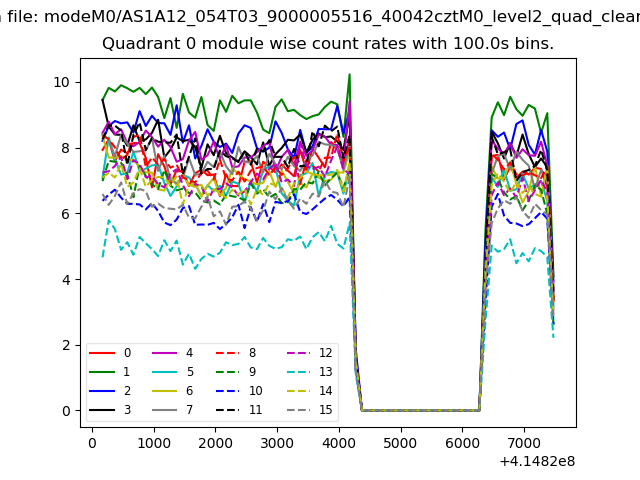 |
 |
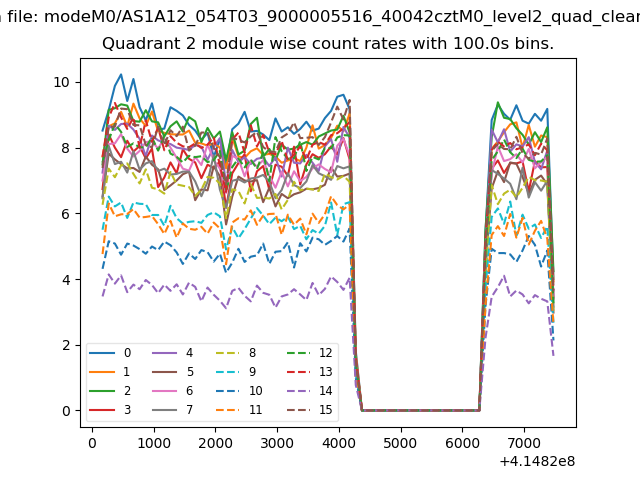
| Module-wise count rates for Quadrant B Data is divided into 100 sec bins |
 |
 |
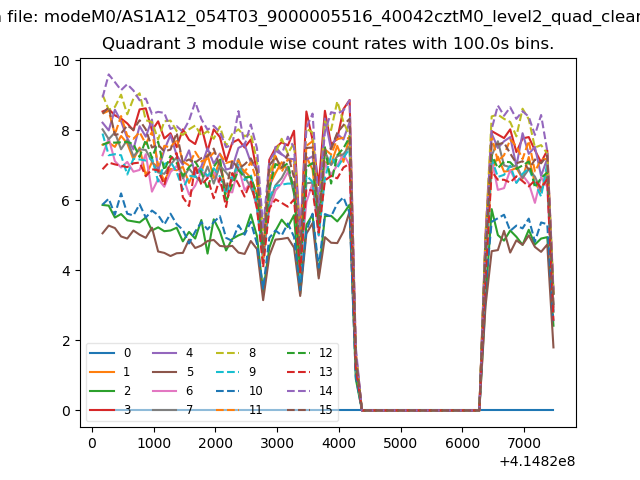
| Module-wise count rates for Quadrant C Data is divided into 100 sec bins |
 |
 |
| Module-wise count rates for Quadrant D Data is divided into 100 sec bins |
 |
 |
| Parameter | Plot |
|---|---|
| CZT HV Monitor | 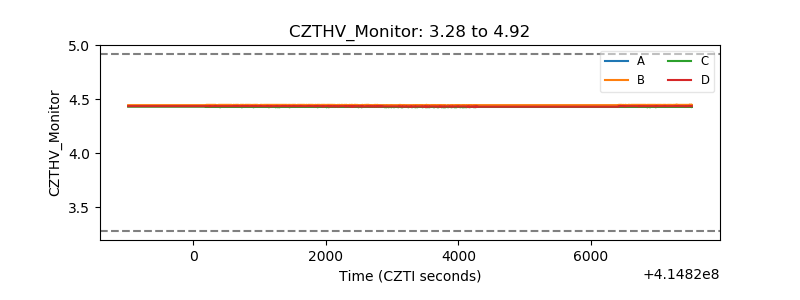 |
| D_VDD | 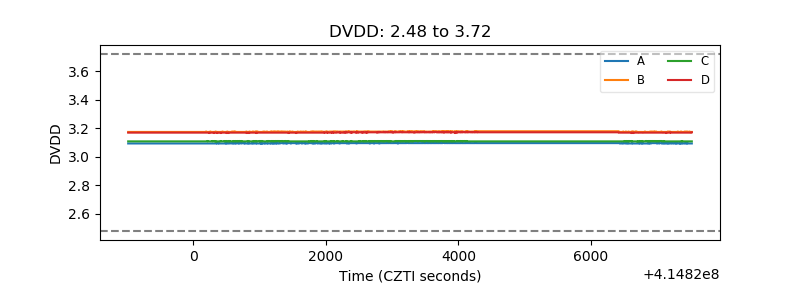 |
| Temperature 1 | 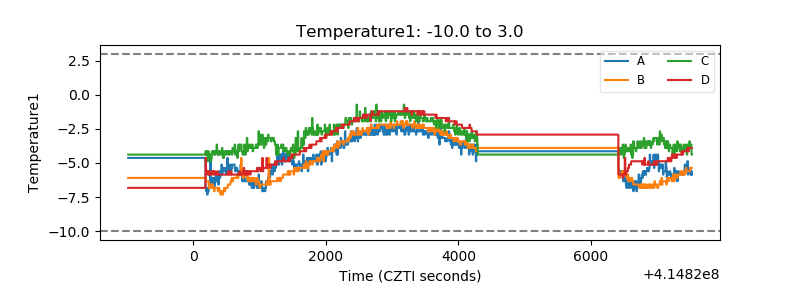 |
| Veto HV Monitor | 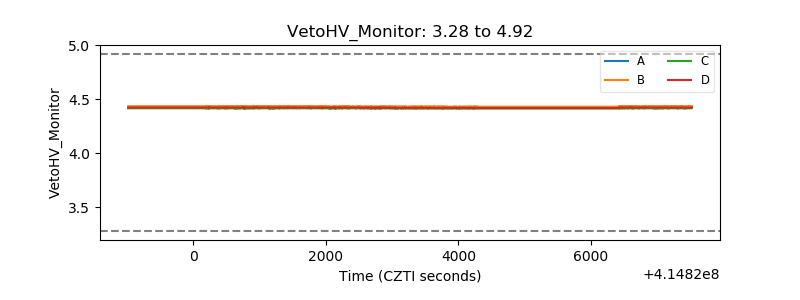 |
| Veto LLD | 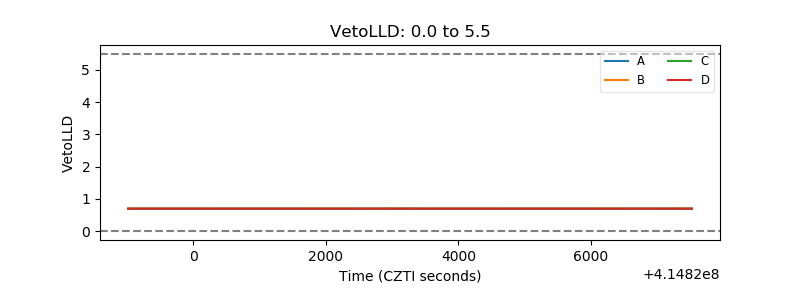 |
| Alpha Counter | 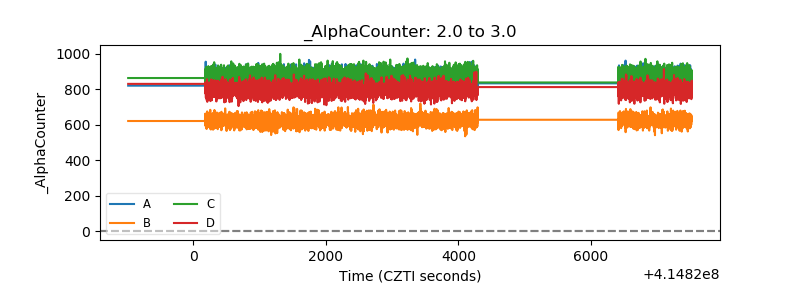 |
| _CPM_Rate | 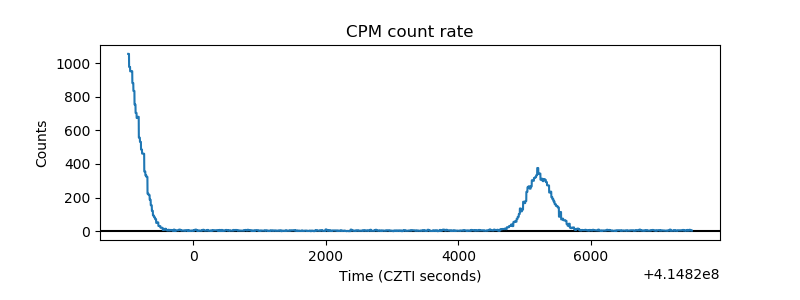 |
| CZT Counter | 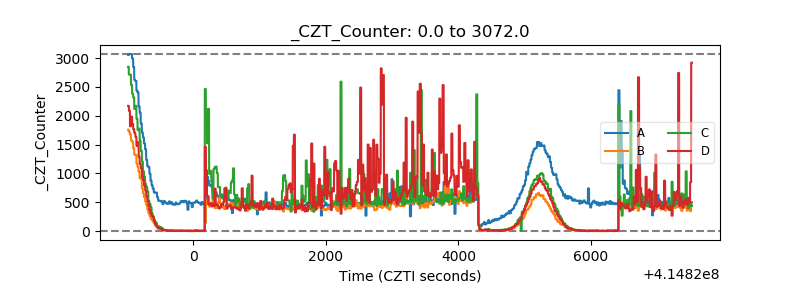 |
| +2.5 Volts monitor | 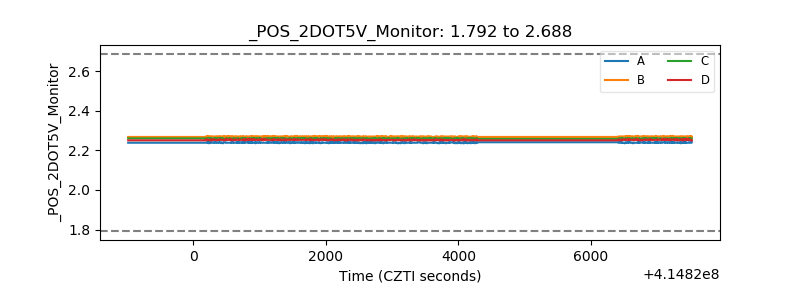 |
| +5 Volts monitor | 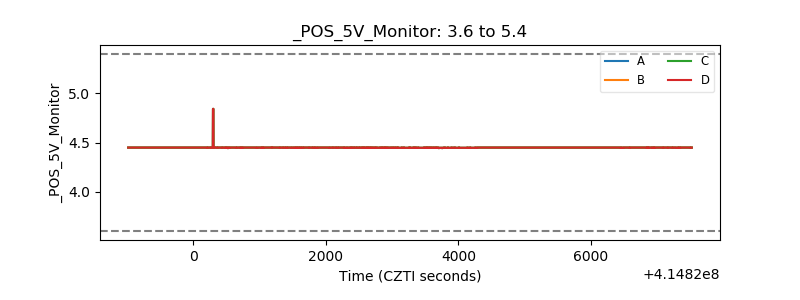 |
| _ROLL_ROT | 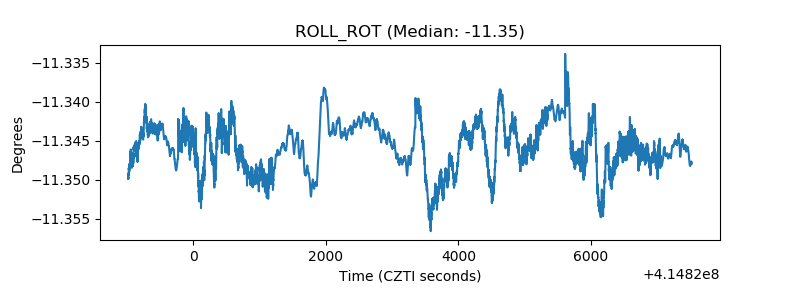 |
| _Roll_DEC | 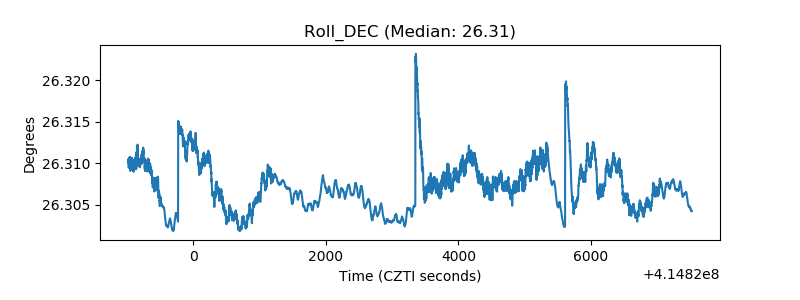 |
| _Roll_RA | 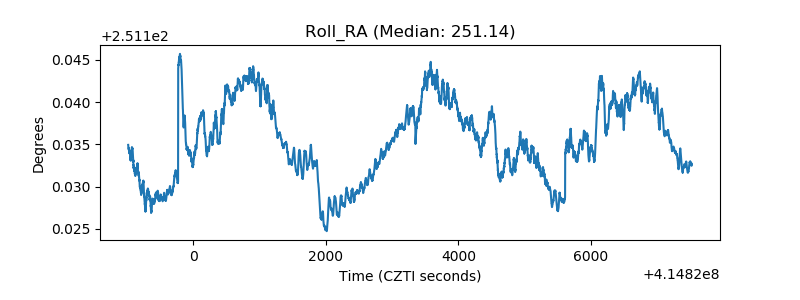 |
| Veto Counter | 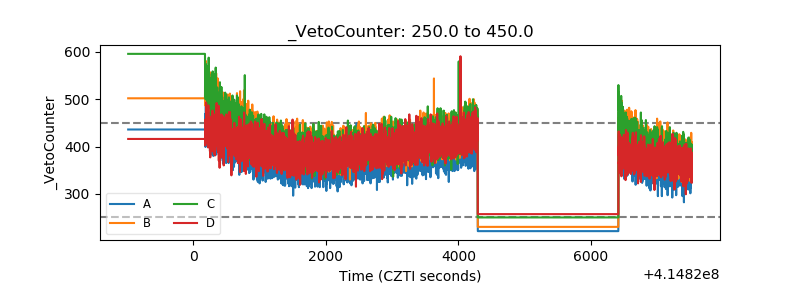 |