| Param | Original file | Final file |
|---|---|---|
| Filename | modeM0/AS1A12_054T03_9000005516_40043cztM0_level2.fits | modeM0/AS1A12_054T03_9000005516_40043cztM0_level2_quad_clean.evt |
| Size (bytes) | 343,653,120 | 87,425,280 |
| Size | 327.7 MB | 83.4 MB |
| Events in quadrant A | 3,024,181 | 588,376 |
| Events in quadrant B | 2,297,562 | 611,384 |
| Events in quadrant C | 3,540,233 | 560,121 |
| Events in quadrant D | 3,448,608 | 518,656 |
| Mode M9 | |||
|---|---|---|---|
| Quadrant | BADHDUFLAG | Total packets | Discarded packets |
| A | 0 | 33 | 0 |
| B | 0 | 33 | 0 |
| C | 0 | 33 | 0 |
| D | 0 | 34 | 0 |
| Mode SS | |||
|---|---|---|---|
| Quadrant | BADHDUFLAG | Total packets | Discarded packets |
| A | 0 | 106 | 0 |
| B | 0 | 106 | 0 |
| C | 0 | 106 | 0 |
| D | 0 | 106 | 0 |
| Mode M0 | |||
|---|---|---|---|
| Quadrant | BADHDUFLAG | Total packets | Discarded packets |
| A | 0 | 12140 | 2 |
| B | 0 | 10583 | 1 |
| C | 0 | 13845 | 1 |
| D | 0 | 14113 | 1 |
| Quadrant | Total seconds | Saturated seconds | Saturation percentage |
|---|---|---|---|
| A | 5270 | 37 | 0.702087% |
| B | 5270 | 3 | 0.056926% |
| C | 5270 | 256 | 4.857685% |
| D | 5270 | 189 | 3.586338% |
Noise dominated data is calculated using 1-second bins in cleaned event files. If a bin has >2000 counts, and if more than 50% of those come from <1% of pixels, then it is considered to be noise-dominated and hence unusable.
| Quadrant | # 1 sec bins | Bins with >0 counts | Bins with >2000 counts | High rate bins dominated by noise | Noise dominated (total time) | Noise dominated (detector-on time) | Marked lightcurve |
|---|---|---|---|---|---|---|---|
| A | 7242 | 5271 | 32 | 32 | 0.44% | 0.61% | 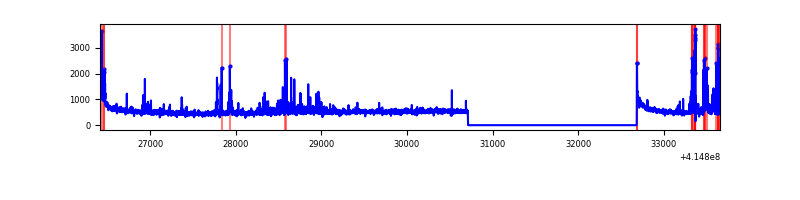 |
| B | 7242 | 5271 | 0 | 0 | 0.00% | 0.00% | 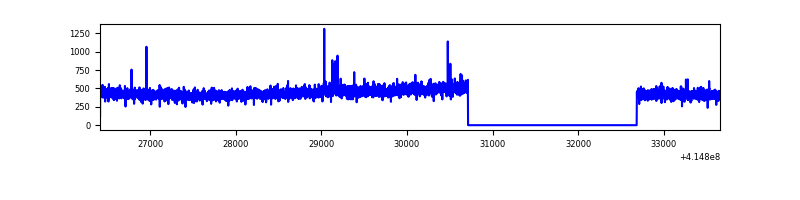 |
| C | 7242 | 5271 | 214 | 214 | 2.95% | 4.06% | 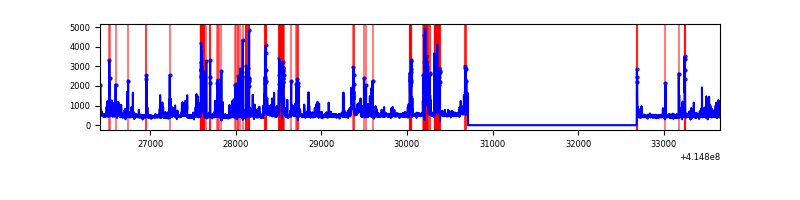 |
| D | 7242 | 5271 | 165 | 165 | 2.28% | 3.13% | 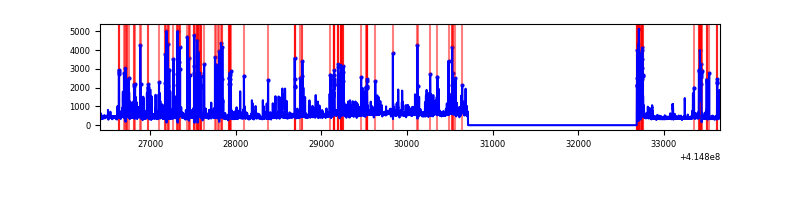 |
Top three noisy pixels from each quadrant. If the there are fewer than three noisy pixels in the level2.evt file, extra rows are filled as -1
| Pixel properties | Quadrant properties | ||||||
|---|---|---|---|---|---|---|---|
| Quadrant | DetID | PixID | Counts | Sigma | Mean | Median | Sigma |
| A | 10 | 83 | 460127 | 3921.4 | 575 | 566 | 117.2 |
| A | 13 | 248 | 268767 | 2288.54 | 575 | 566 | 117.2 |
| A | 2 | 79 | 30855 | 258.45 | 575 | 566 | 117.2 |
| B | 0 | 230 | 22017 | 189.99 | 573 | 557 | 113.0 |
| B | 12 | 111 | 13746 | 116.77 | 573 | 557 | 113.0 |
| B | 11 | 111 | 12674 | 107.27 | 573 | 557 | 113.0 |
| C | 14 | 254 | 684999 | 5279.06 | 552 | 557 | 129.7 |
| C | 9 | 187 | 448497 | 3454.93 | 552 | 557 | 129.7 |
| C | 15 | 214 | 218435 | 1680.48 | 552 | 557 | 129.7 |
| D | 12 | 227 | 691063 | 5137.2 | 552 | 539 | 134.4 |
| D | 1 | 47 | 196912 | 1460.93 | 552 | 539 | 134.4 |
| D | 1 | 52 | 167132 | 1239.38 | 552 | 539 | 134.4 |
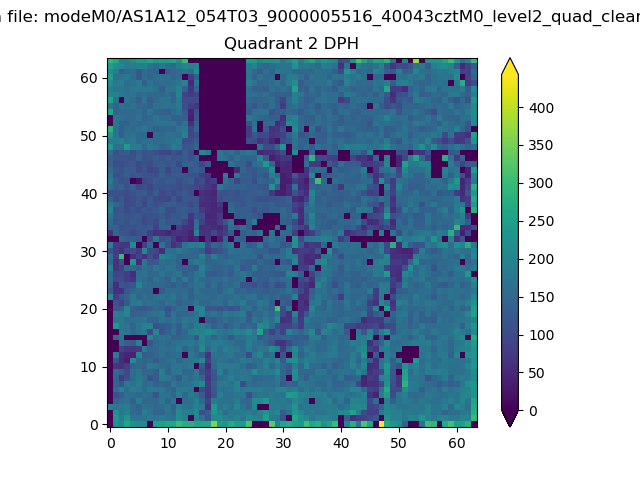
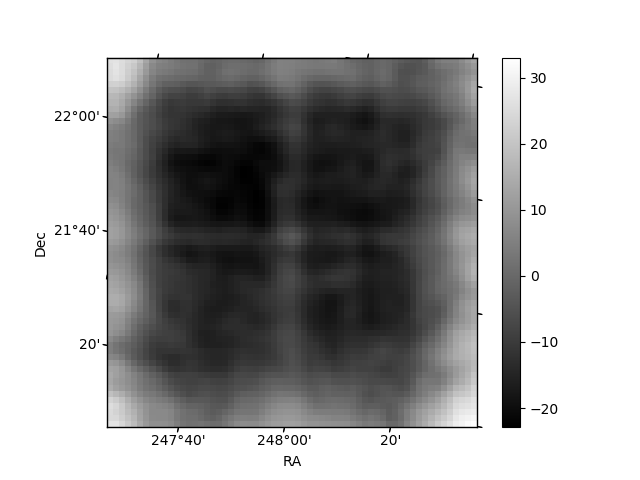
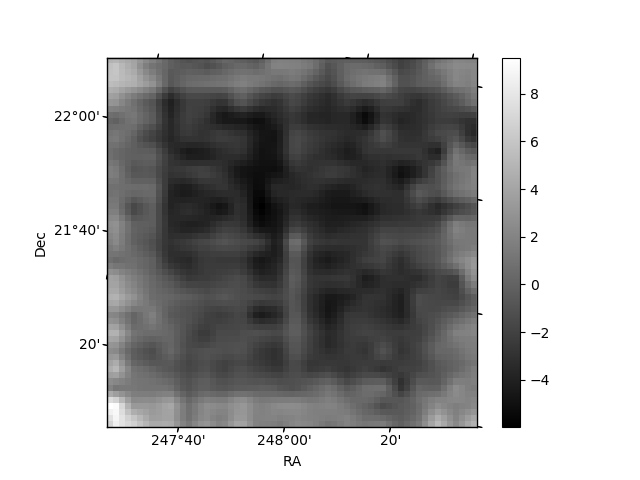
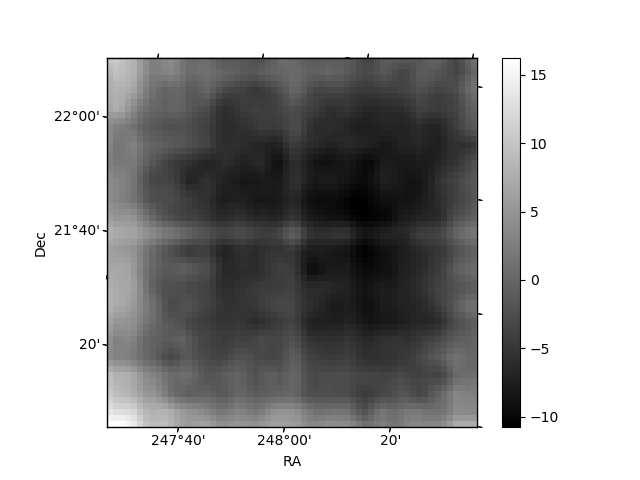
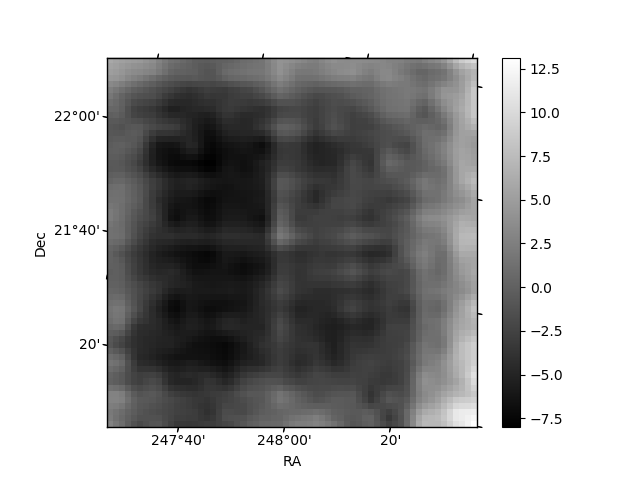
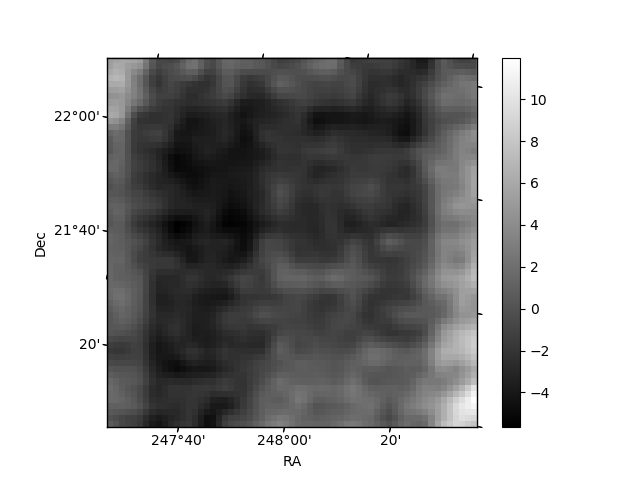
Histogram calculated using DETX and DETY for each event in the final _common_clean file
| Quadrant A | 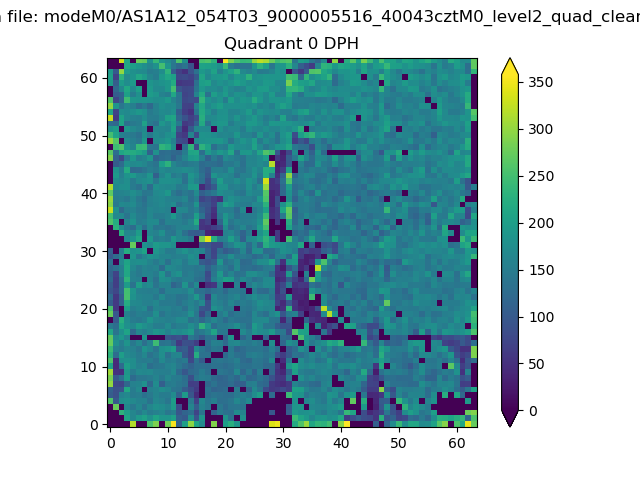 |
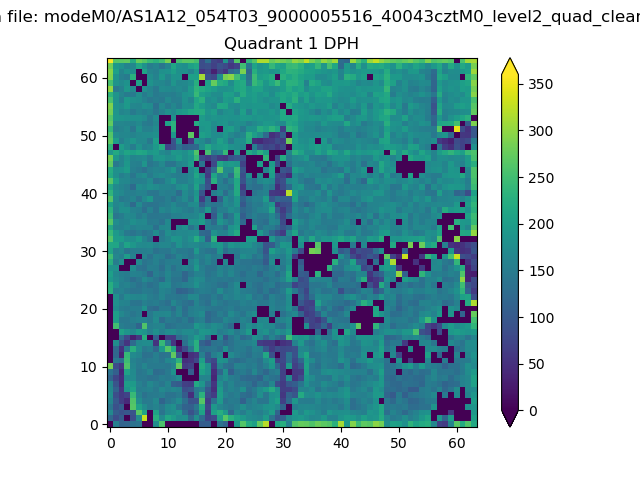 |
Quadrant B |
|---|---|---|---|
| Quadrant D | 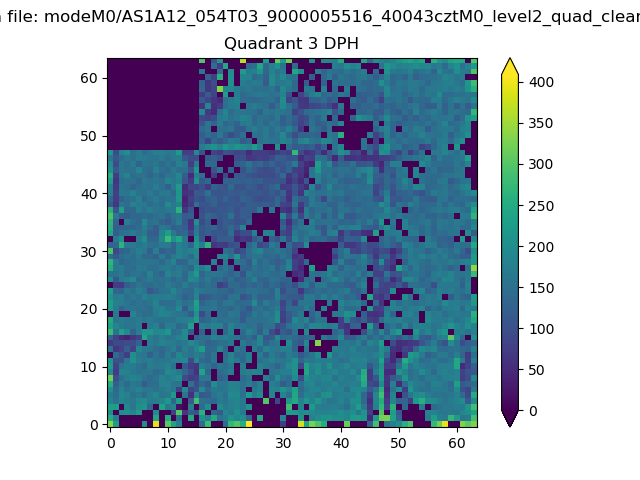 |
 |
Quadrant C |
| Plot type | Count rate plots | Images |
|---|---|---|
| Comparison with Poisson distribution Blue bars denote a histogram of data divided into 1 sec bins. Red curve is a Poisson curve with rate = median count rate of data. |
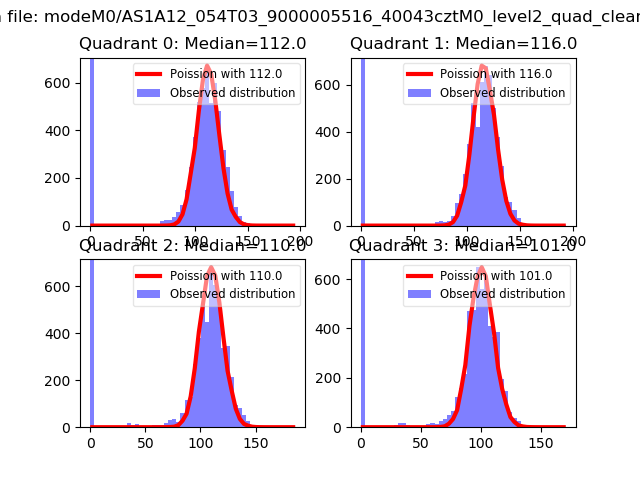 |
 |
| Quadrant-wise count rates Data is divided into 100 sec bins |
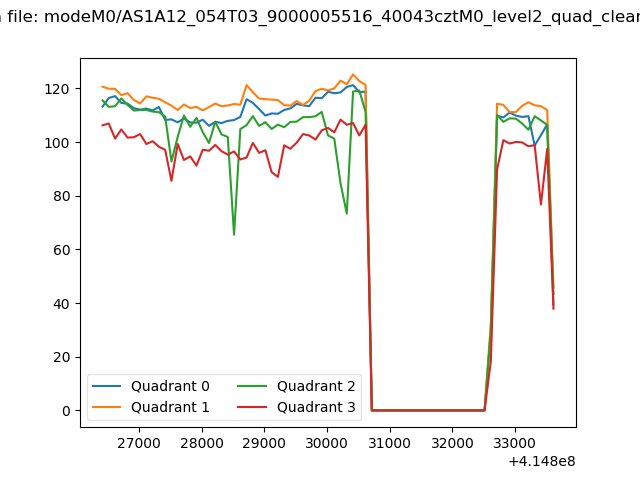 |
|
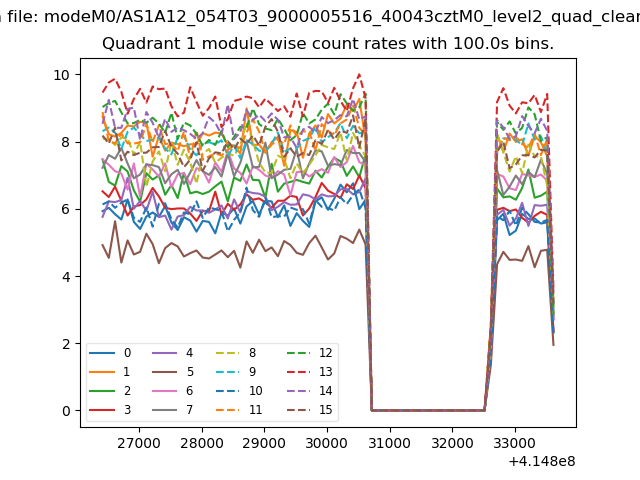
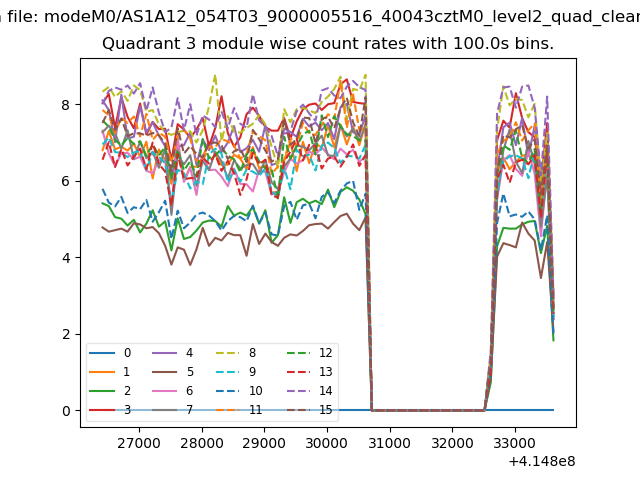
| Module-wise count rates for Quadrant A Data is divided into 100 sec bins |
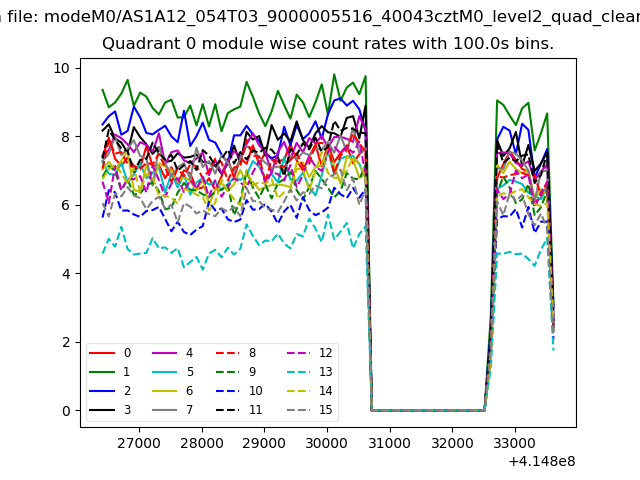 |
 |
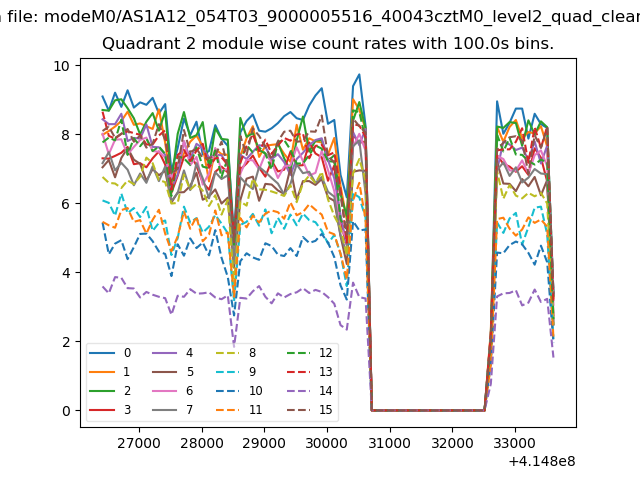
| Module-wise count rates for Quadrant B Data is divided into 100 sec bins |
 |
 |
| Module-wise count rates for Quadrant C Data is divided into 100 sec bins |
 |
 |
| Module-wise count rates for Quadrant D Data is divided into 100 sec bins |
 |
 |
| Parameter | Plot |
|---|---|
| CZT HV Monitor | 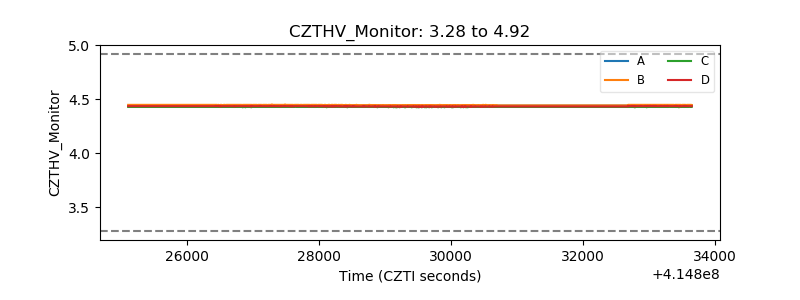 |
| D_VDD | 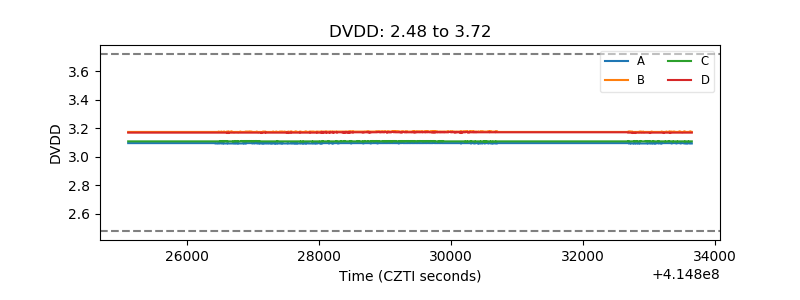 |
| Temperature 1 | 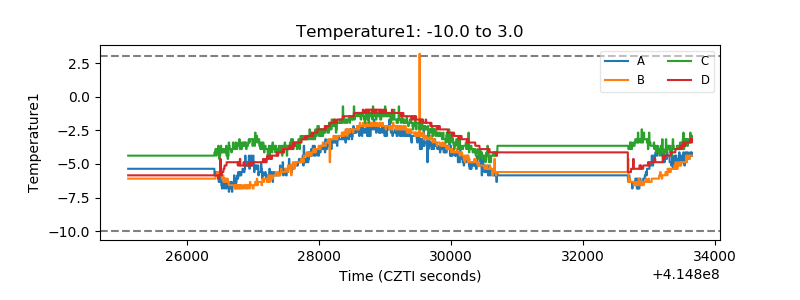 |
| Veto HV Monitor | 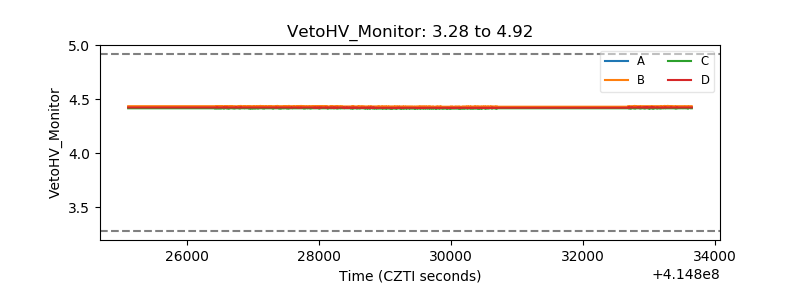 |
| Veto LLD | 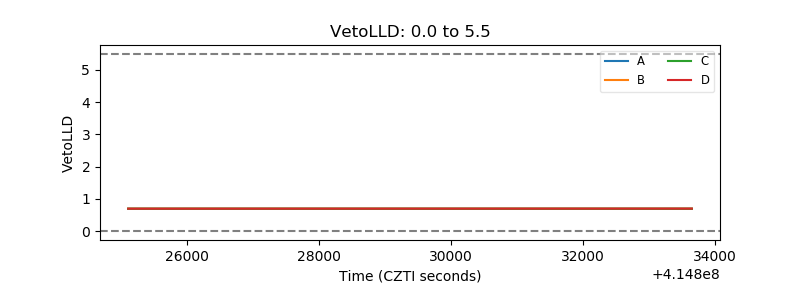 |
| Alpha Counter | 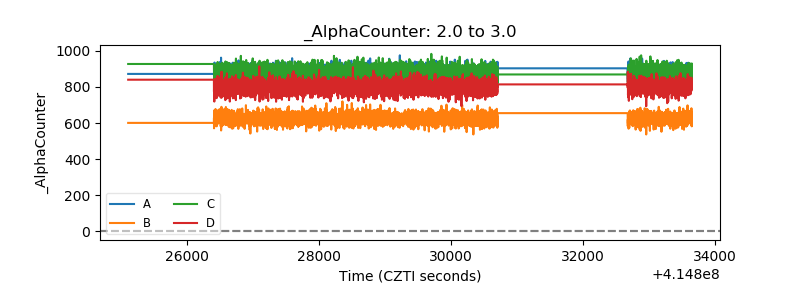 |
| _CPM_Rate | 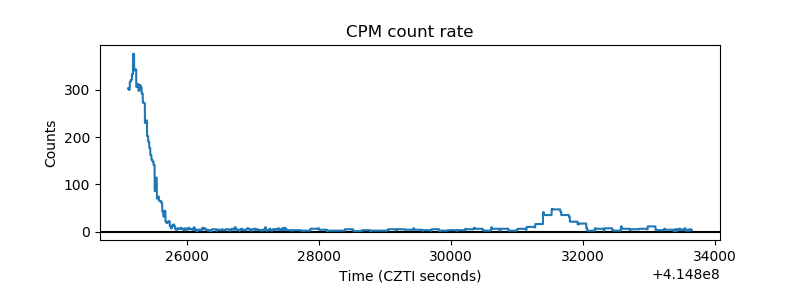 |
| CZT Counter | 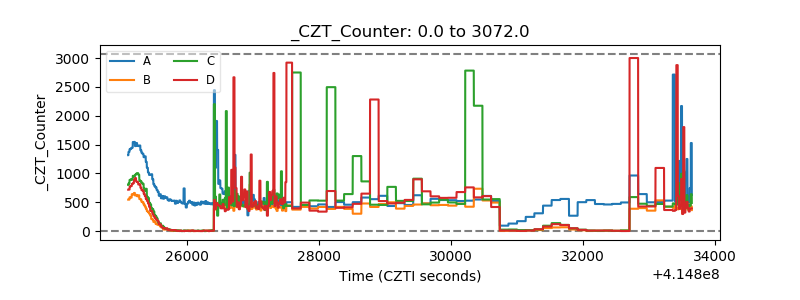 |
| +2.5 Volts monitor | 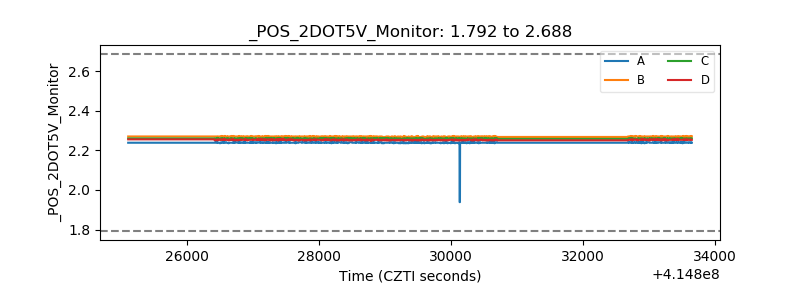 |
| +5 Volts monitor | 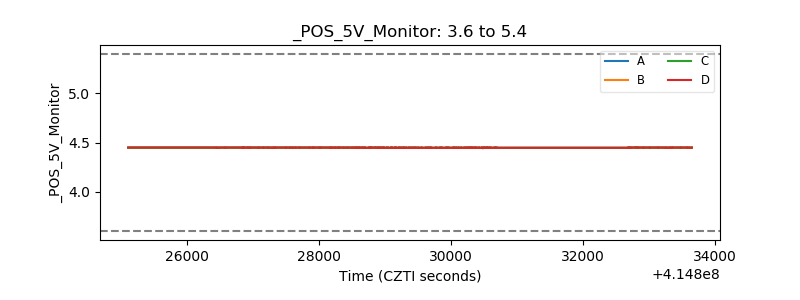 |
| _ROLL_ROT | 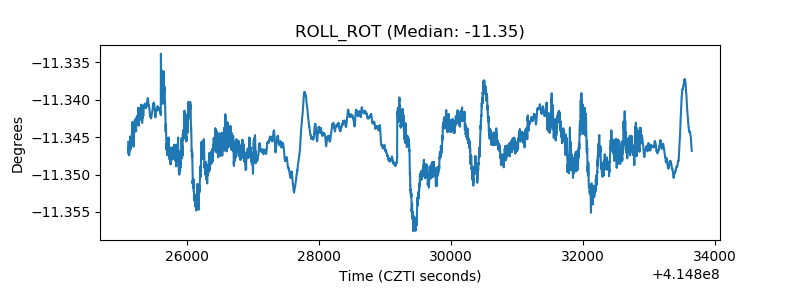 |
| _Roll_DEC | 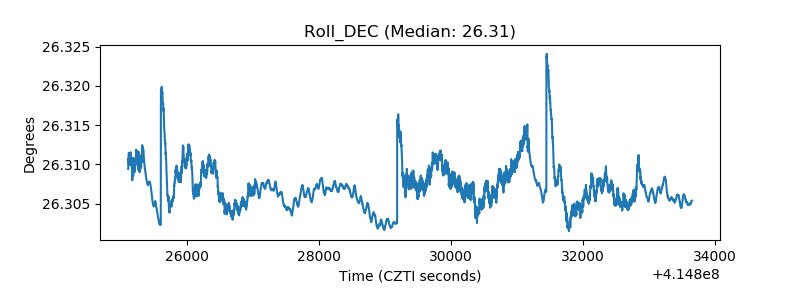 |
| _Roll_RA | 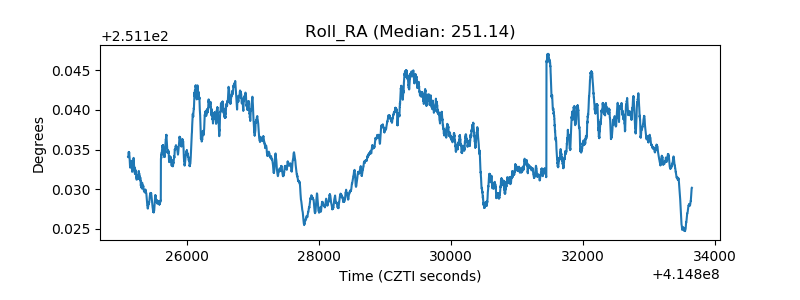 |
| Veto Counter | 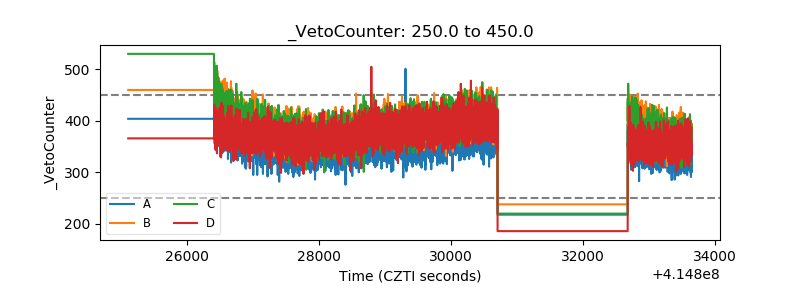 |