| Param | Original file | Final file |
|---|---|---|
| Filename | modeM0/AS1A12_054T03_9000005516_40044cztM0_level2.fits | modeM0/AS1A12_054T03_9000005516_40044cztM0_level2_quad_clean.evt |
| Size (bytes) | 360,783,360 | 88,632,000 |
| Size | 344.1 MB | 84.5 MB |
| Events in quadrant A | 3,566,644 | 585,727 |
| Events in quadrant B | 2,549,044 | 613,635 |
| Events in quadrant C | 3,080,473 | 588,032 |
| Events in quadrant D | 3,731,903 | 512,984 |
| Mode M9 | |||
|---|---|---|---|
| Quadrant | BADHDUFLAG | Total packets | Discarded packets |
| A | 0 | 26 | 0 |
| B | 0 | 26 | 0 |
| C | 0 | 26 | 0 |
| D | 0 | 27 | 0 |
| Mode SS | |||
|---|---|---|---|
| Quadrant | BADHDUFLAG | Total packets | Discarded packets |
| A | 0 | 110 | 0 |
| B | 0 | 110 | 0 |
| C | 0 | 110 | 0 |
| D | 0 | 110 | 0 |
| Mode M0 | |||
|---|---|---|---|
| Quadrant | BADHDUFLAG | Total packets | Discarded packets |
| A | 0 | 13869 | 3 |
| B | 0 | 11448 | 2 |
| C | 0 | 12624 | 2 |
| D | 0 | 14871 | 2 |
| Quadrant | Total seconds | Saturated seconds | Saturation percentage |
|---|---|---|---|
| A | 5482 | 154 | 2.809194% |
| B | 5482 | 44 | 0.802627% |
| C | 5482 | 47 | 0.857351% |
| D | 5482 | 338 | 6.165633% |
Noise dominated data is calculated using 1-second bins in cleaned event files. If a bin has >2000 counts, and if more than 50% of those come from <1% of pixels, then it is considered to be noise-dominated and hence unusable.
| Quadrant | # 1 sec bins | Bins with >0 counts | Bins with >2000 counts | High rate bins dominated by noise | Noise dominated (total time) | Noise dominated (detector-on time) | Marked lightcurve |
|---|---|---|---|---|---|---|---|
| A | 7125 | 5483 | 124 | 124 | 1.74% | 2.26% | 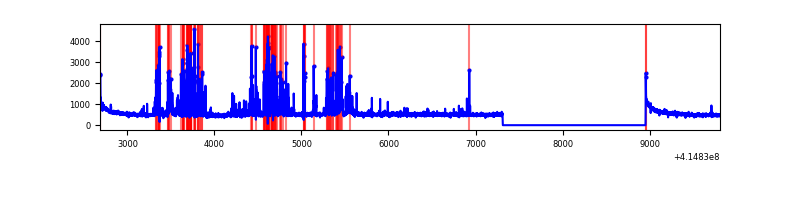 |
| B | 7125 | 5483 | 28 | 28 | 0.39% | 0.51% | 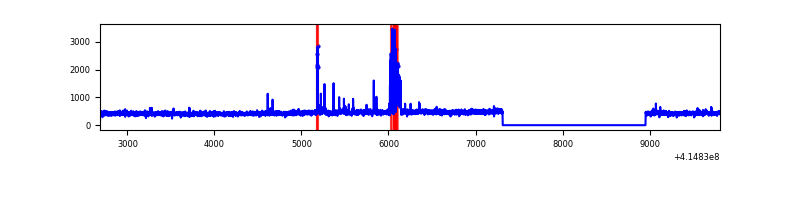 |
| C | 7125 | 5483 | 36 | 36 | 0.51% | 0.66% | 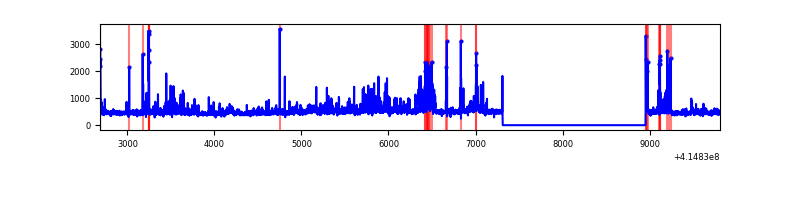 |
| D | 7125 | 5483 | 280 | 280 | 3.93% | 5.11% | 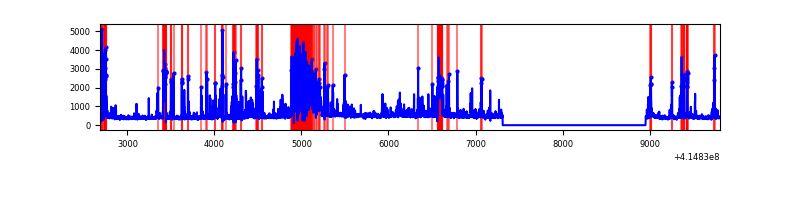 |
Top three noisy pixels from each quadrant. If the there are fewer than three noisy pixels in the level2.evt file, extra rows are filled as -1
| Pixel properties | Quadrant properties | ||||||
|---|---|---|---|---|---|---|---|
| Quadrant | DetID | PixID | Counts | Sigma | Mean | Median | Sigma |
| A | 13 | 248 | 741641 | 6088.19 | 591 | 579 | 121.7 |
| A | 10 | 83 | 474214 | 3891.15 | 591 | 579 | 121.7 |
| A | 2 | 79 | 27752 | 223.24 | 591 | 579 | 121.7 |
| B | 5 | 32 | 151097 | 1290.33 | 594 | 578 | 116.7 |
| B | 0 | 221 | 23154 | 193.53 | 594 | 578 | 116.7 |
| B | 0 | 230 | 17219 | 142.66 | 594 | 578 | 116.7 |
| C | 9 | 187 | 371769 | 2704.04 | 582 | 586 | 137.3 |
| C | 15 | 214 | 229561 | 1668.06 | 582 | 586 | 137.3 |
| C | 14 | 254 | 178649 | 1297.17 | 582 | 586 | 137.3 |
| D | 12 | 227 | 637401 | 4524.75 | 568 | 551 | 140.7 |
| D | 2 | 250 | 461080 | 3272.01 | 568 | 551 | 140.7 |
| D | 1 | 47 | 192294 | 1362.31 | 568 | 551 | 140.7 |
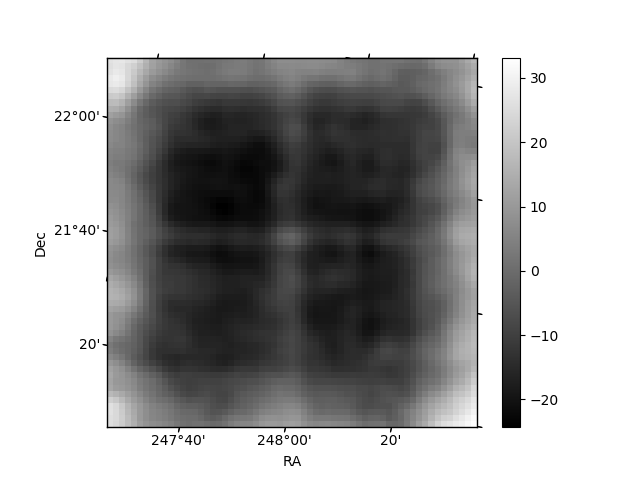
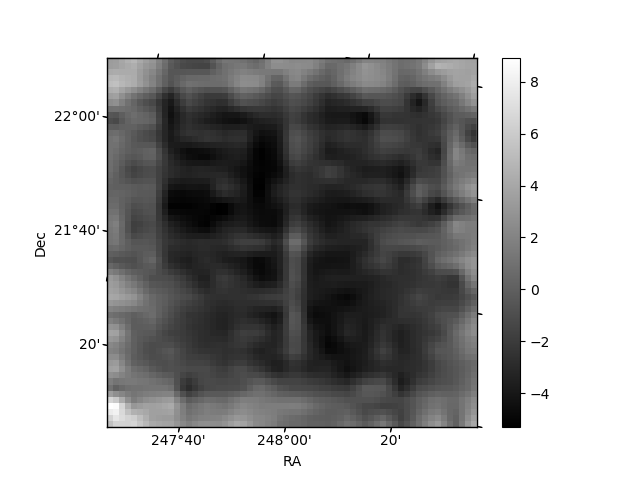
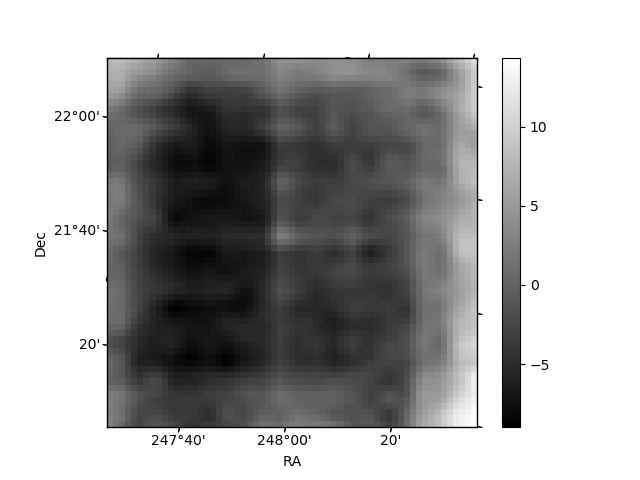
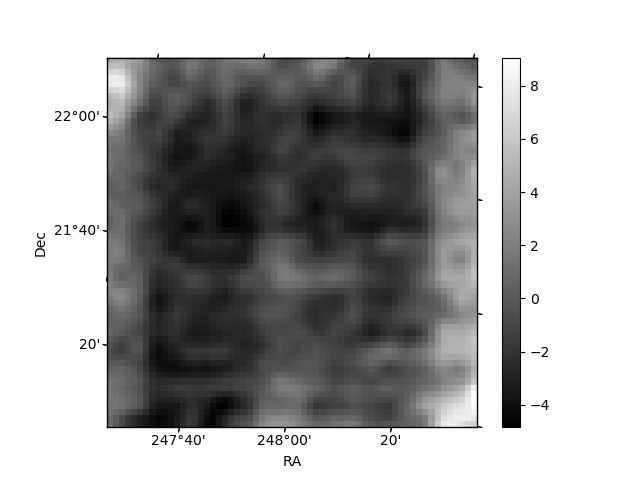
Histogram calculated using DETX and DETY for each event in the final _common_clean file
| Quadrant A | 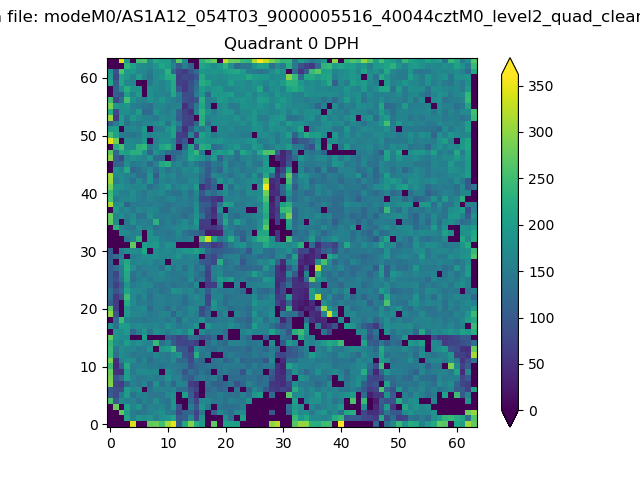 |
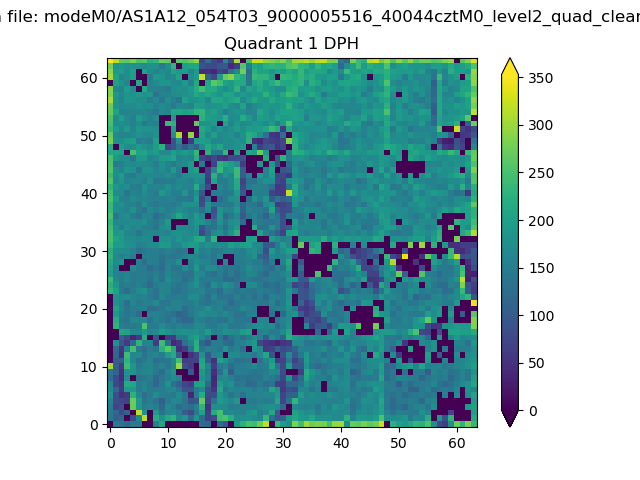 |
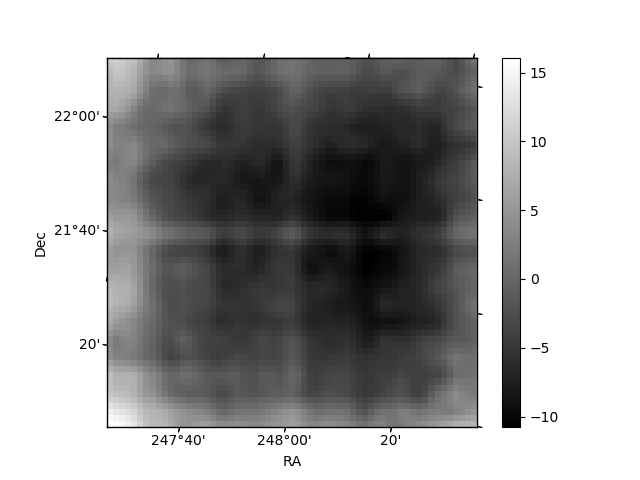
Quadrant B |
|---|---|---|---|
| Quadrant D | 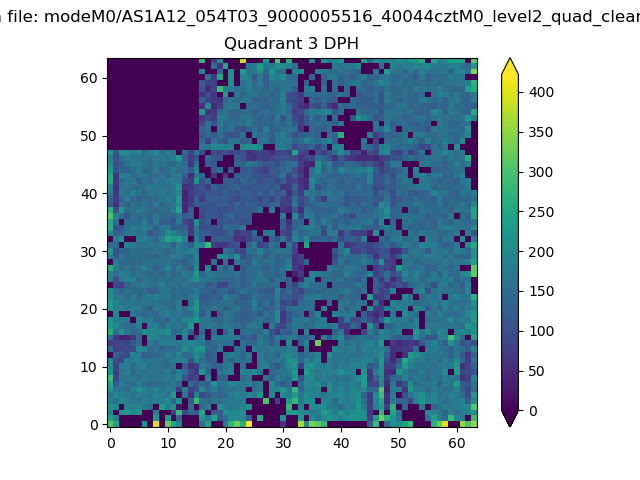 |
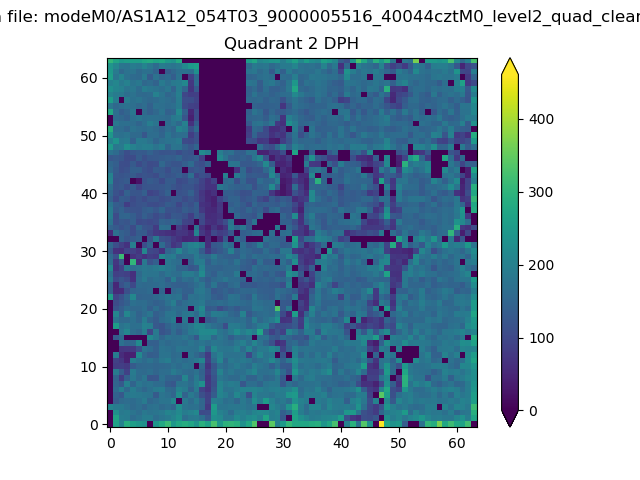 |
Quadrant C |
| Plot type | Count rate plots | Images |
|---|---|---|
| Comparison with Poisson distribution Blue bars denote a histogram of data divided into 1 sec bins. Red curve is a Poisson curve with rate = median count rate of data. |
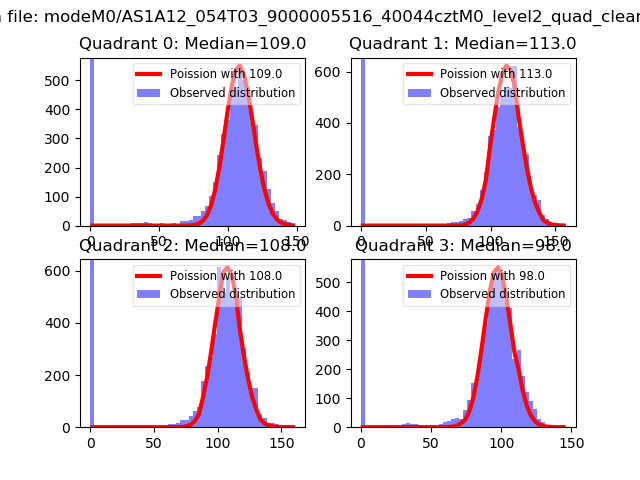 |
 |
| Quadrant-wise count rates Data is divided into 100 sec bins |
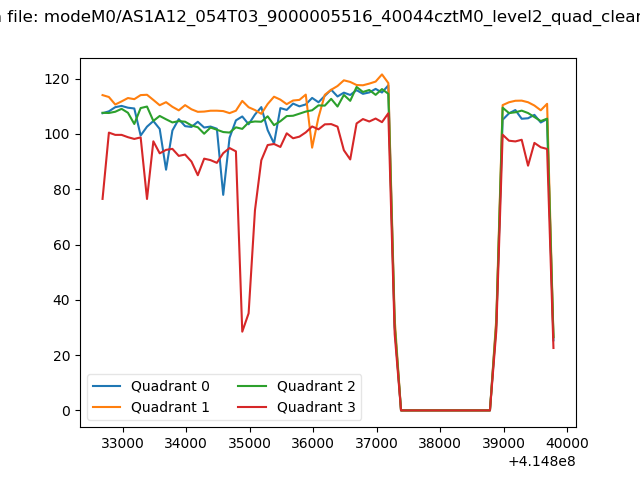 |
|
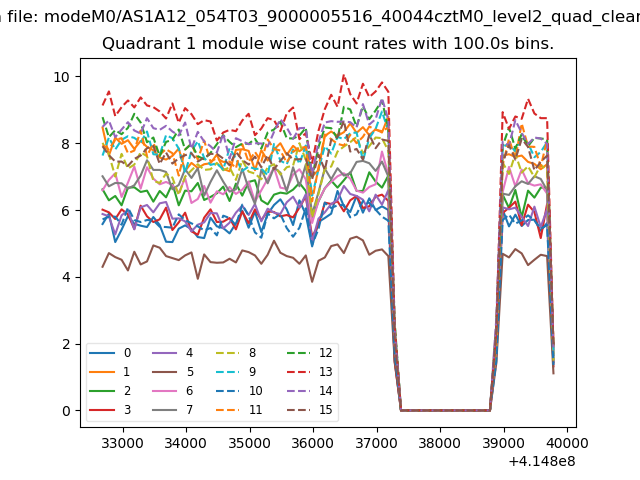
| Module-wise count rates for Quadrant A Data is divided into 100 sec bins |
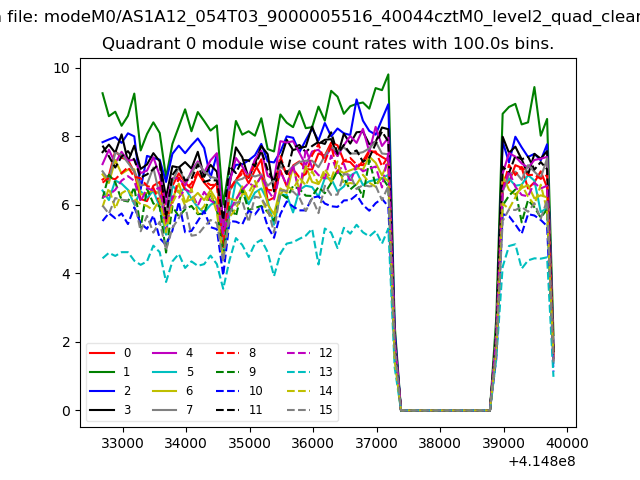 |
 |
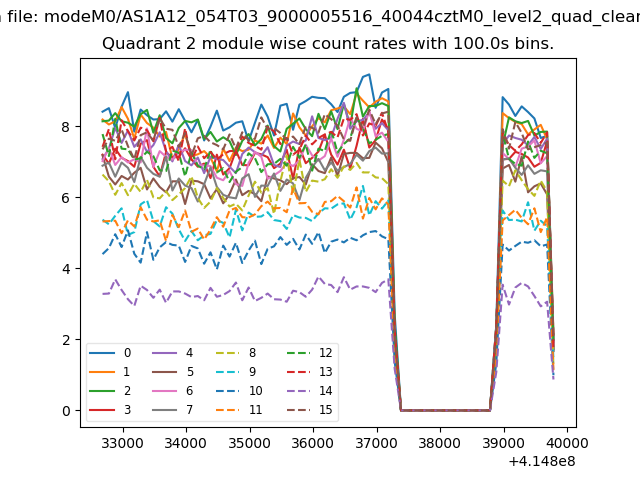
| Module-wise count rates for Quadrant B Data is divided into 100 sec bins |
 |
 |
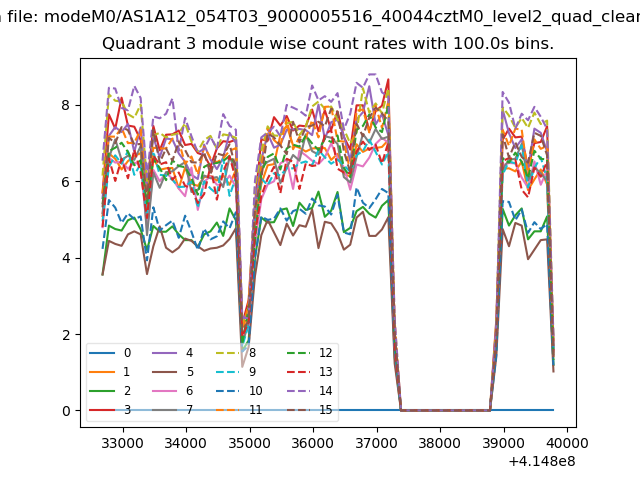
| Module-wise count rates for Quadrant C Data is divided into 100 sec bins |
 |
 |
| Module-wise count rates for Quadrant D Data is divided into 100 sec bins |
 |
 |
| Parameter | Plot |
|---|---|
| CZT HV Monitor | 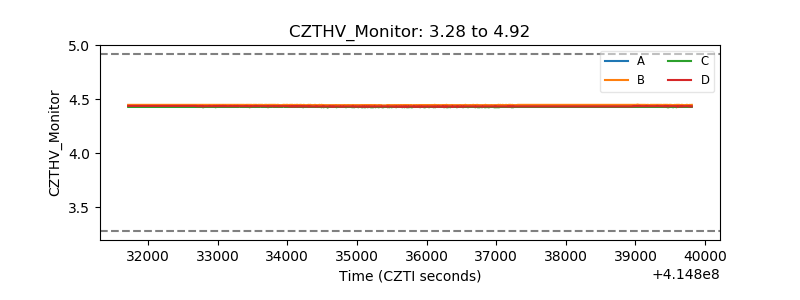 |
| D_VDD | 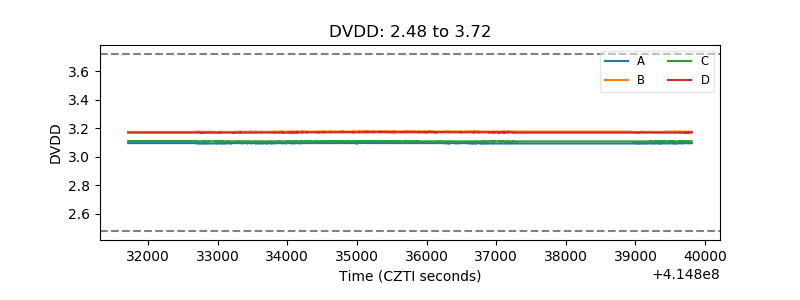 |
| Temperature 1 | 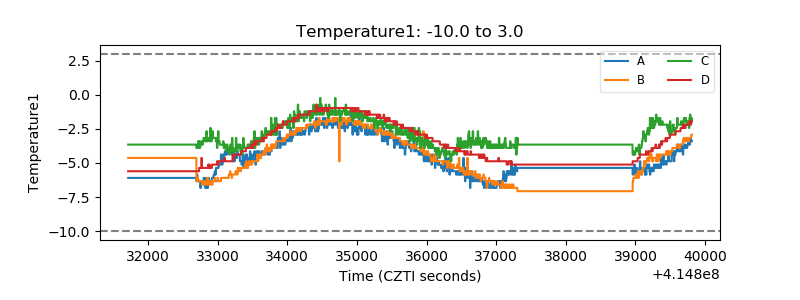 |
| Veto HV Monitor | 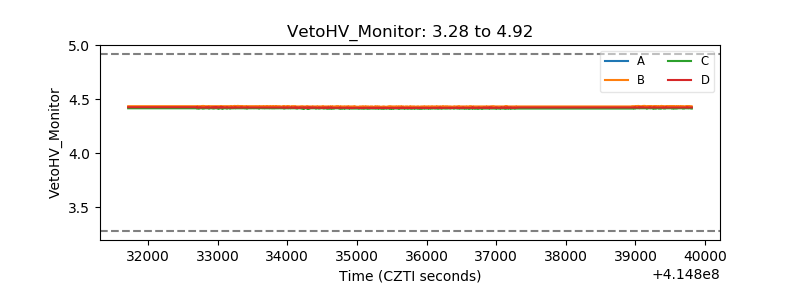 |
| Veto LLD | 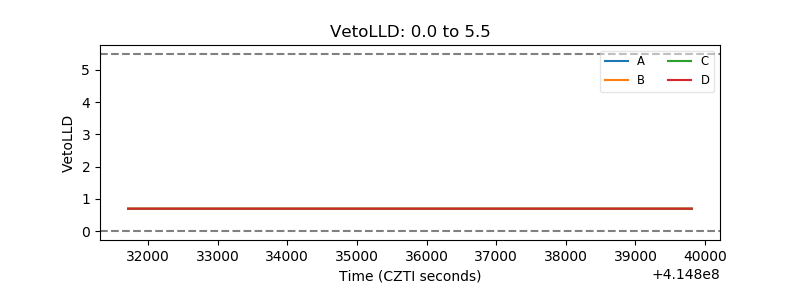 |
| Alpha Counter | 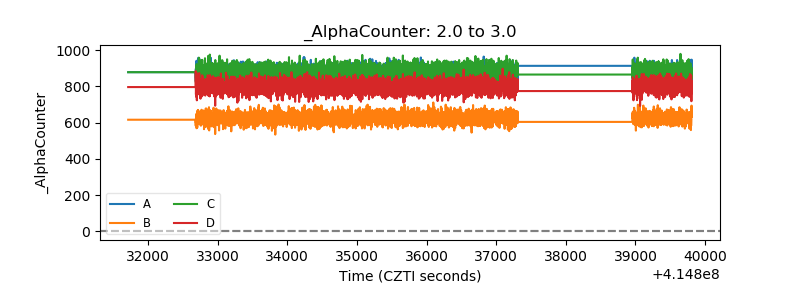 |
| _CPM_Rate | 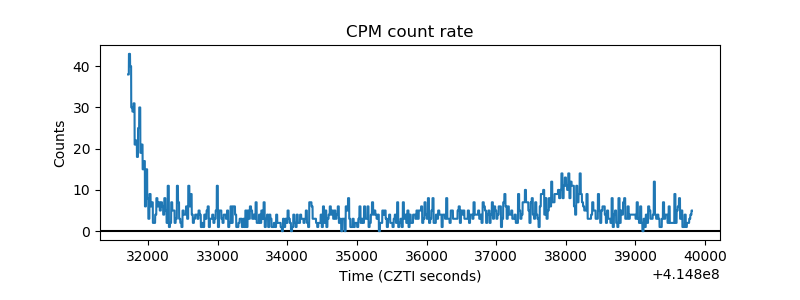 |
| CZT Counter | 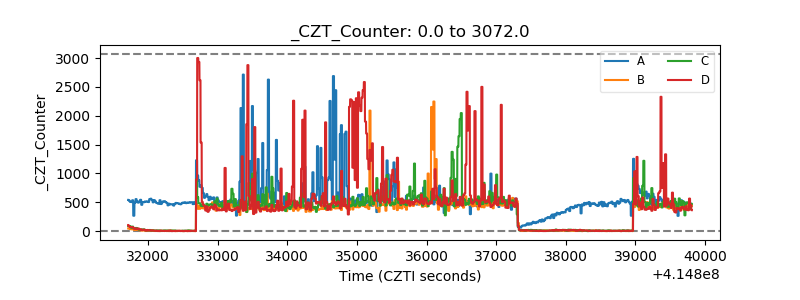 |
| +2.5 Volts monitor |  |
| +5 Volts monitor | 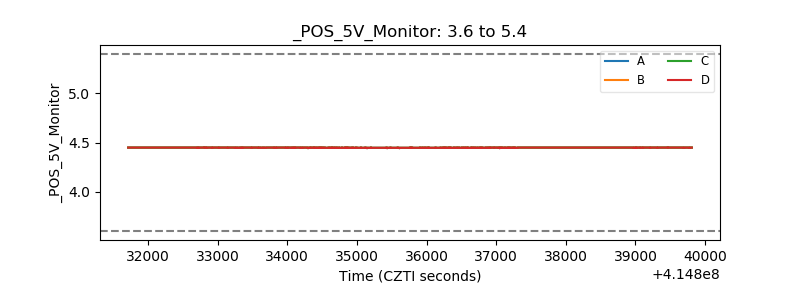 |
| _ROLL_ROT | 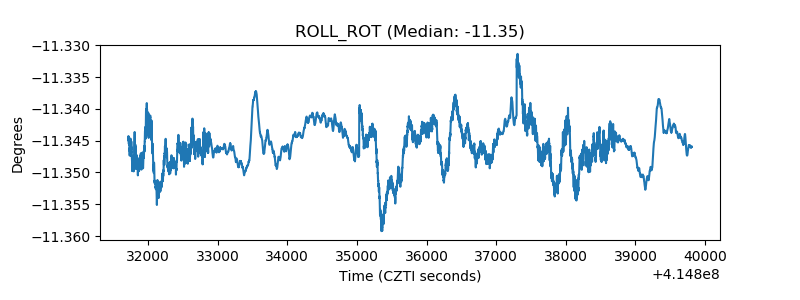 |
| _Roll_DEC | 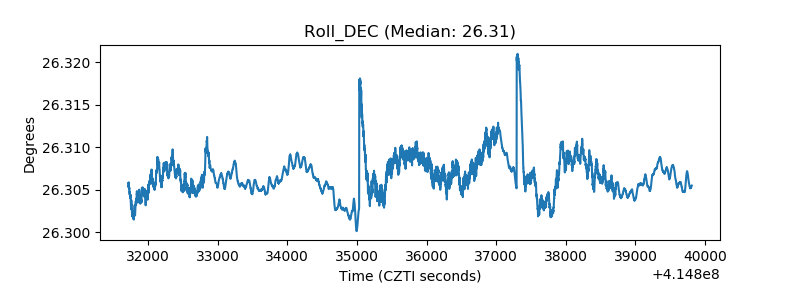 |
| _Roll_RA | 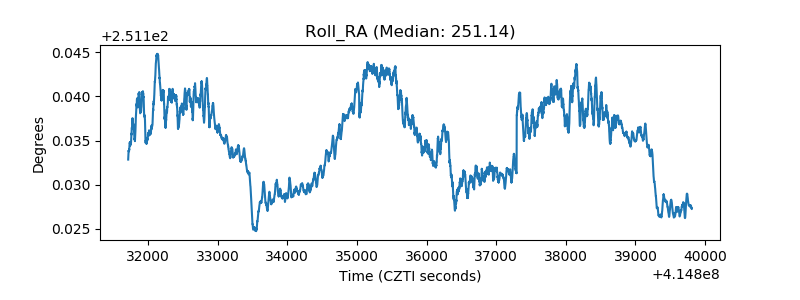 |
| Veto Counter | 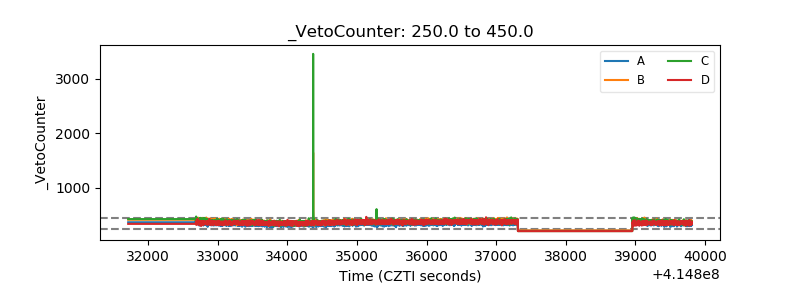 |