| Param | Original file | Final file |
|---|---|---|
| Filename | modeM0/AS1A12_054T03_9000005516_40045cztM0_level2.fits | modeM0/AS1A12_054T03_9000005516_40045cztM0_level2_quad_clean.evt |
| Size (bytes) | 381,729,600 | 93,427,200 |
| Size | 364.0 MB | 89.1 MB |
| Events in quadrant A | 3,549,025 | 618,194 |
| Events in quadrant B | 3,107,867 | 637,570 |
| Events in quadrant C | 3,378,556 | 613,078 |
| Events in quadrant D | 3,644,657 | 555,828 |
| Mode M9 | |||
|---|---|---|---|
| Quadrant | BADHDUFLAG | Total packets | Discarded packets |
| A | 0 | 19 | 0 |
| B | 0 | 19 | 0 |
| C | 0 | 19 | 0 |
| D | 0 | 20 | 0 |
| Mode SS | |||
|---|---|---|---|
| Quadrant | BADHDUFLAG | Total packets | Discarded packets |
| A | 0 | 116 | 0 |
| B | 0 | 116 | 0 |
| C | 0 | 116 | 0 |
| D | 0 | 116 | 0 |
| Mode M0 | |||
|---|---|---|---|
| Quadrant | BADHDUFLAG | Total packets | Discarded packets |
| A | 0 | 14044 | 3 |
| B | 0 | 13162 | 2 |
| C | 0 | 13736 | 2 |
| D | 0 | 14778 | 2 |
| Quadrant | Total seconds | Saturated seconds | Saturation percentage |
|---|---|---|---|
| A | 5788 | 102 | 1.762267% |
| B | 5788 | 132 | 2.280581% |
| C | 5788 | 73 | 1.261230% |
| D | 5788 | 128 | 2.211472% |
Noise dominated data is calculated using 1-second bins in cleaned event files. If a bin has >2000 counts, and if more than 50% of those come from <1% of pixels, then it is considered to be noise-dominated and hence unusable.
| Quadrant | # 1 sec bins | Bins with >0 counts | Bins with >2000 counts | High rate bins dominated by noise | Noise dominated (total time) | Noise dominated (detector-on time) | Marked lightcurve |
|---|---|---|---|---|---|---|---|
| A | 7159 | 5789 | 74 | 74 | 1.03% | 1.28% | 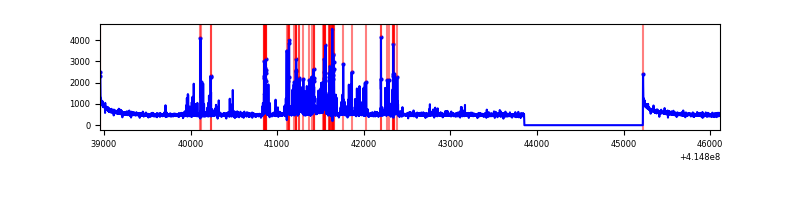 |
| B | 7159 | 5789 | 83 | 83 | 1.16% | 1.43% | 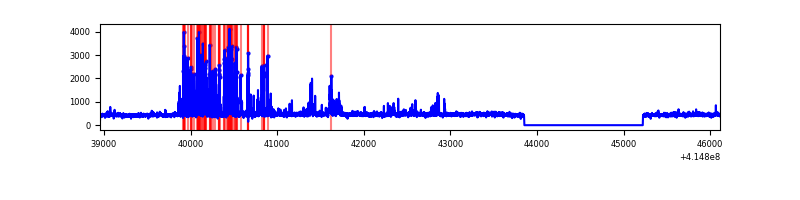 |
| C | 7159 | 5789 | 71 | 71 | 0.99% | 1.23% | 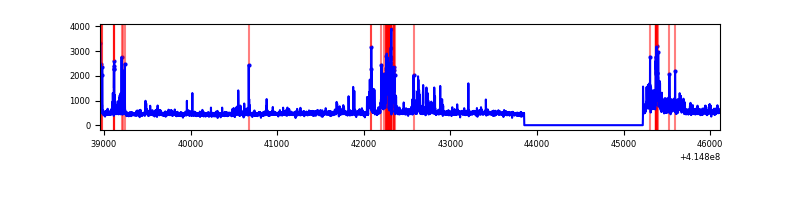 |
| D | 7159 | 5789 | 125 | 125 | 1.75% | 2.16% | 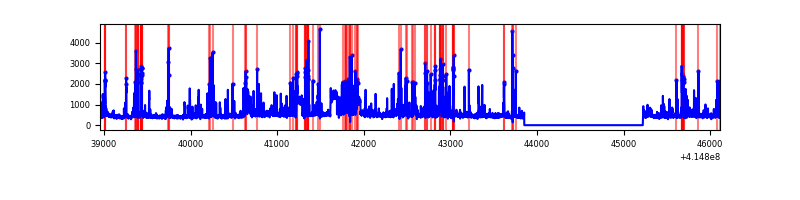 |
Top three noisy pixels from each quadrant. If the there are fewer than three noisy pixels in the level2.evt file, extra rows are filled as -1
| Pixel properties | Quadrant properties | ||||||
|---|---|---|---|---|---|---|---|
| Quadrant | DetID | PixID | Counts | Sigma | Mean | Median | Sigma |
| A | 13 | 248 | 554579 | 4300.49 | 627 | 614 | 128.8 |
| A | 10 | 83 | 492664 | 3819.83 | 627 | 614 | 128.8 |
| A | 2 | 79 | 30909 | 235.18 | 627 | 614 | 128.8 |
| B | 4 | 171 | 572662 | 4650.64 | 624 | 607 | 123.0 |
| B | 0 | 230 | 25624 | 203.38 | 624 | 607 | 123.0 |
| B | 0 | 221 | 25583 | 203.05 | 624 | 607 | 123.0 |
| C | 9 | 187 | 554747 | 3801.69 | 616 | 620 | 145.8 |
| C | 15 | 214 | 242500 | 1659.46 | 616 | 620 | 145.8 |
| C | 14 | 254 | 110655 | 754.92 | 616 | 620 | 145.8 |
| D | 12 | 227 | 516105 | 3444.12 | 611 | 592 | 149.7 |
| D | 13 | 249 | 219777 | 1464.37 | 611 | 592 | 149.7 |
| D | 8 | 230 | 164157 | 1092.77 | 611 | 592 | 149.7 |
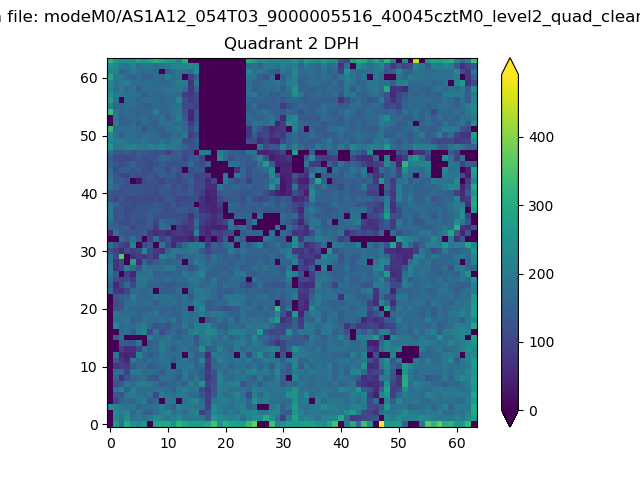
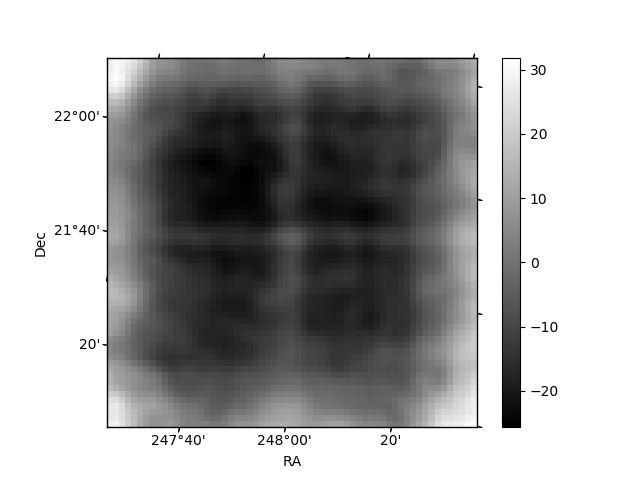
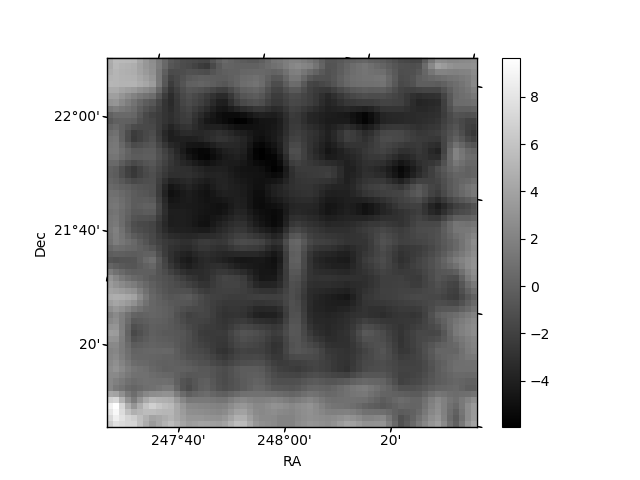
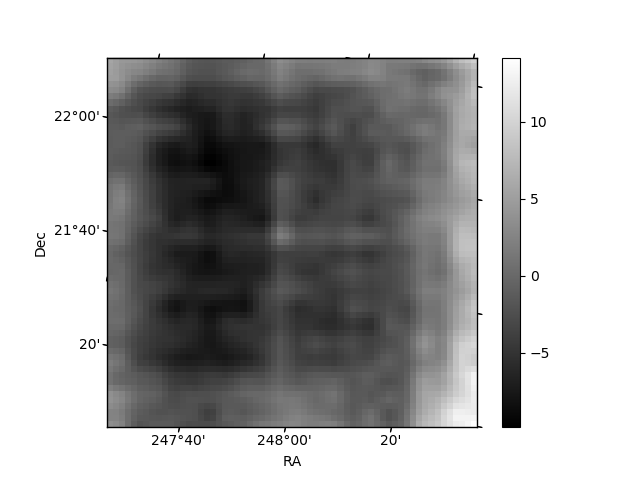
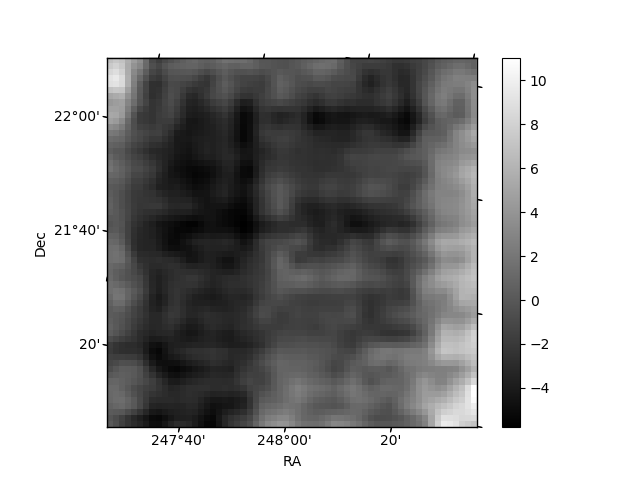
Histogram calculated using DETX and DETY for each event in the final _common_clean file
| Quadrant A | 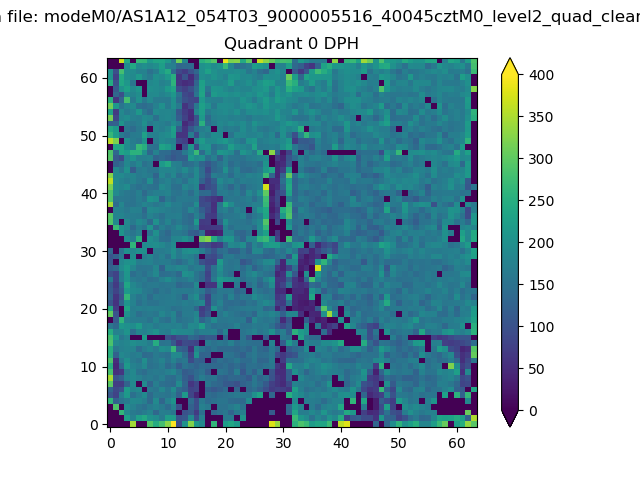 |
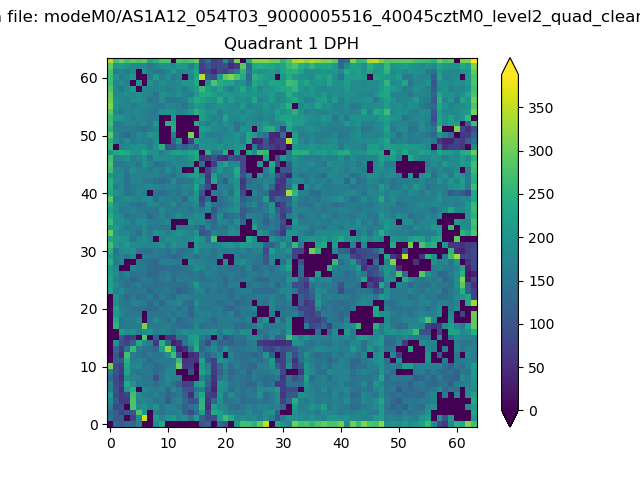 |
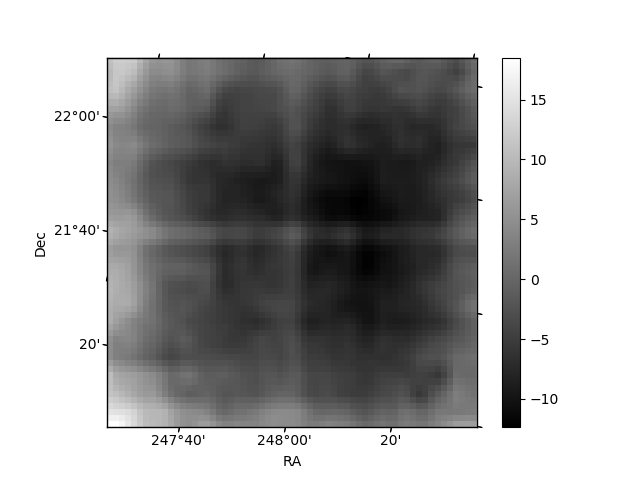
Quadrant B |
|---|---|---|---|
| Quadrant D | 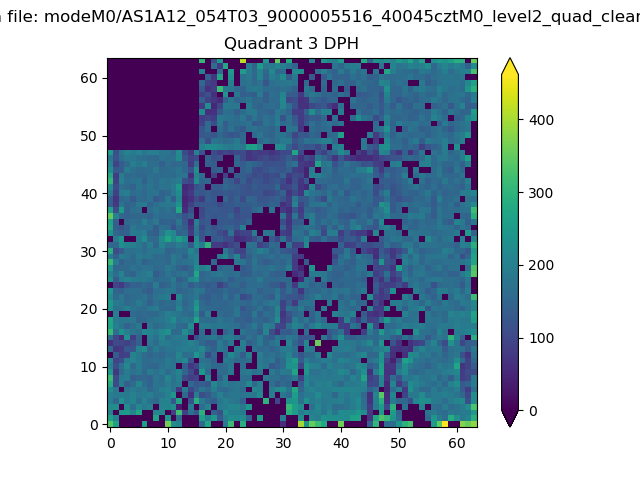 |
 |
Quadrant C |
| Plot type | Count rate plots | Images |
|---|---|---|
| Comparison with Poisson distribution Blue bars denote a histogram of data divided into 1 sec bins. Red curve is a Poisson curve with rate = median count rate of data. |
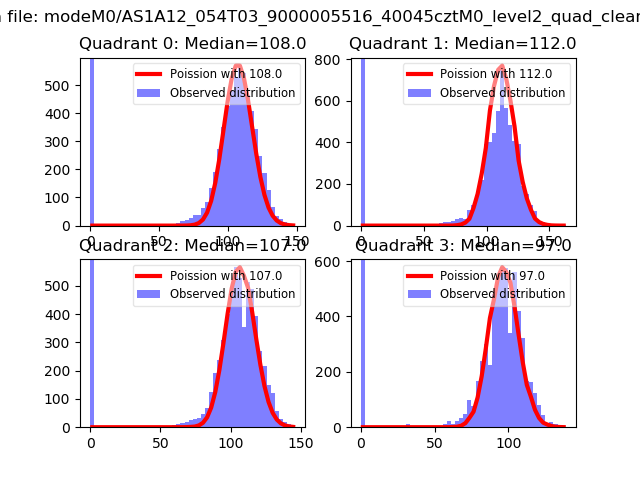 |
 |
| Quadrant-wise count rates Data is divided into 100 sec bins |
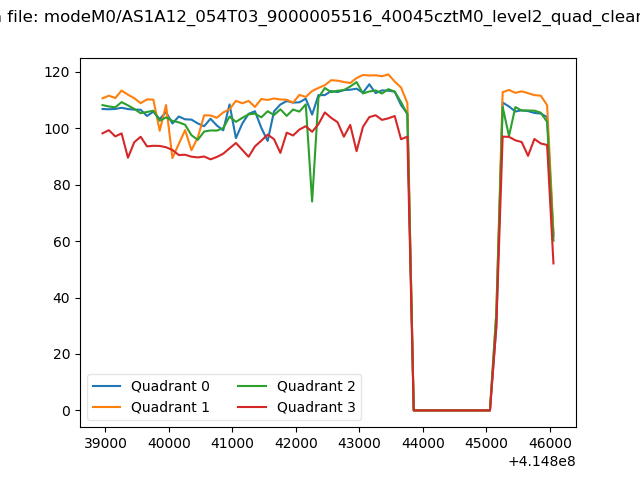 |
|
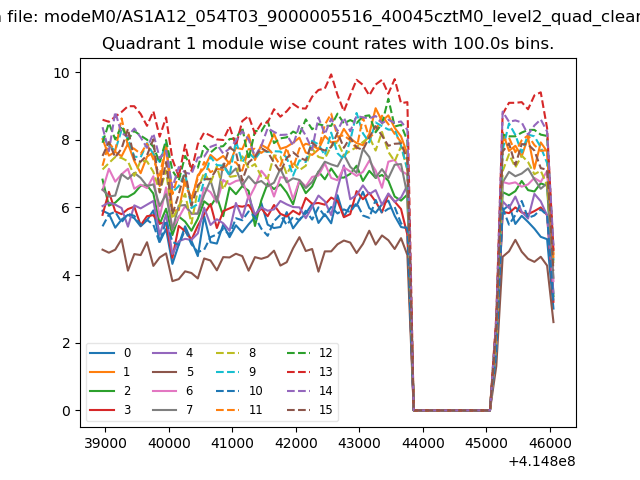
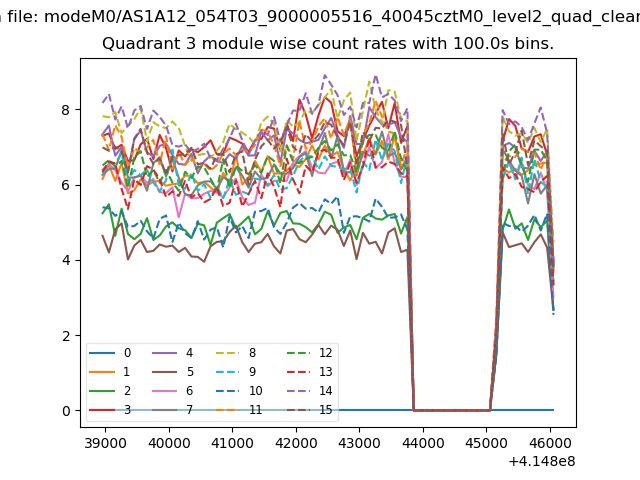
| Module-wise count rates for Quadrant A Data is divided into 100 sec bins |
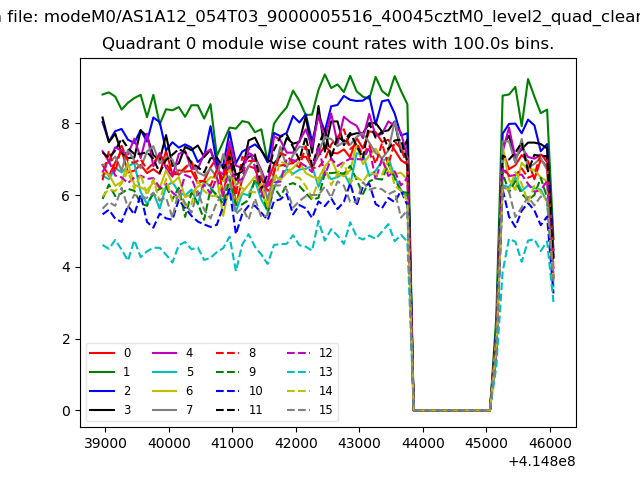 |
 |
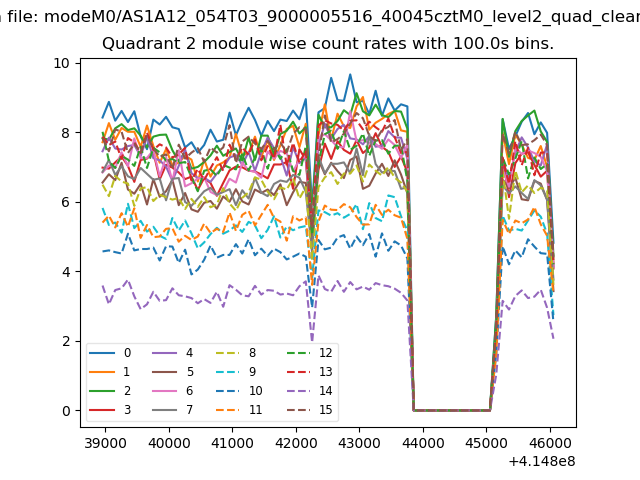
| Module-wise count rates for Quadrant B Data is divided into 100 sec bins |
 |
 |
| Module-wise count rates for Quadrant C Data is divided into 100 sec bins |
 |
 |
| Module-wise count rates for Quadrant D Data is divided into 100 sec bins |
 |
 |
| Parameter | Plot |
|---|---|
| CZT HV Monitor | 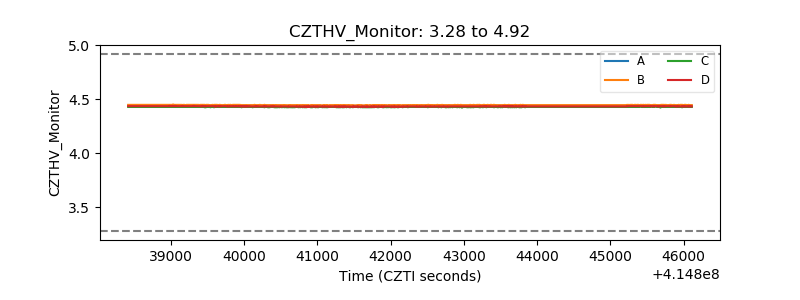 |
| D_VDD | 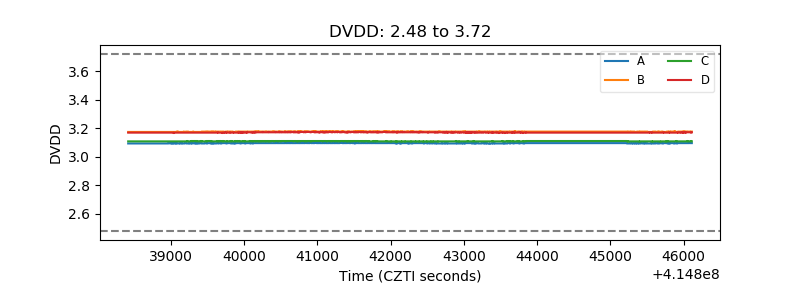 |
| Temperature 1 | 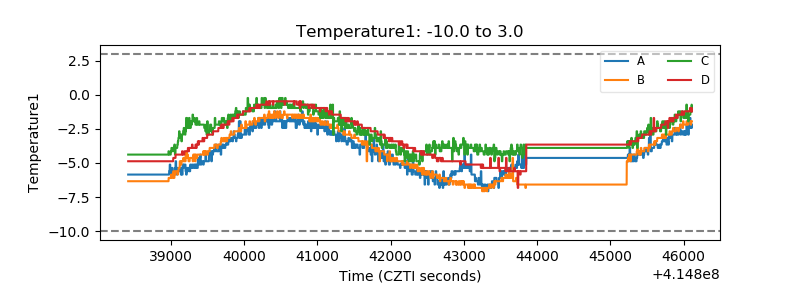 |
| Veto HV Monitor | 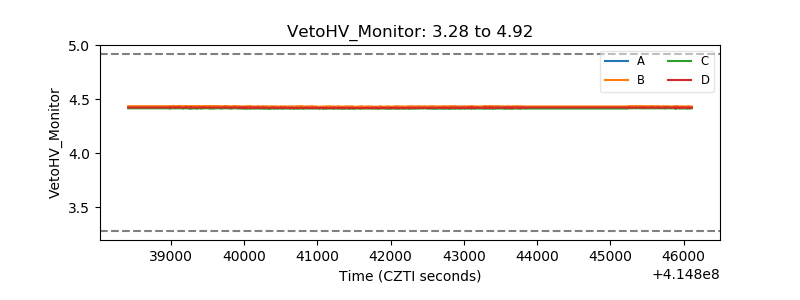 |
| Veto LLD | 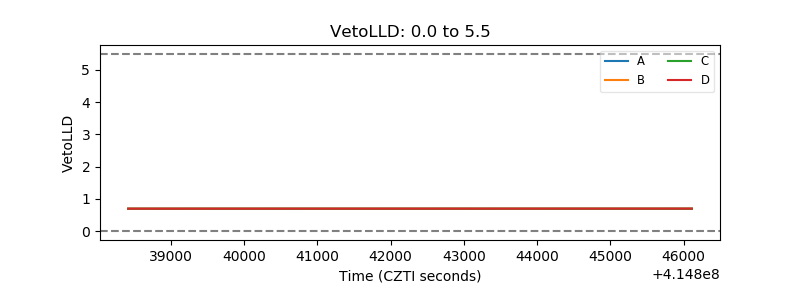 |
| Alpha Counter |  |
| _CPM_Rate | 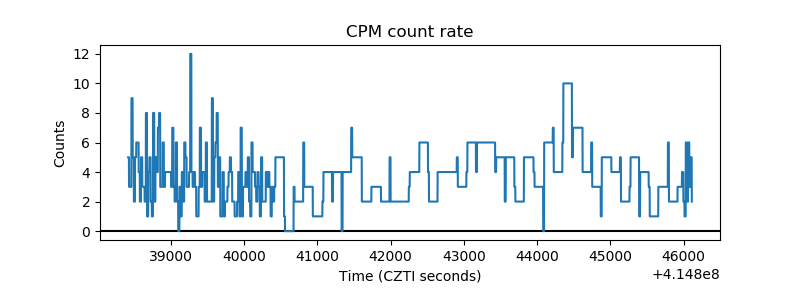 |
| CZT Counter | 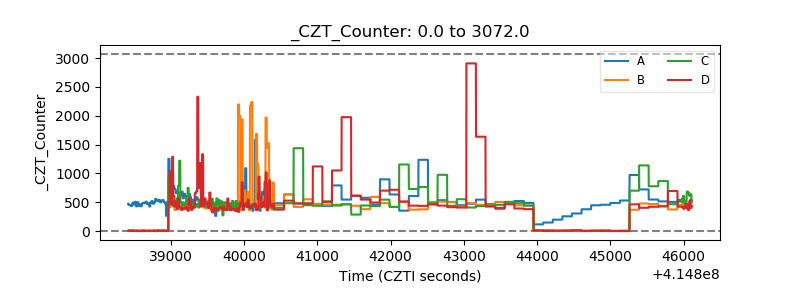 |
| +2.5 Volts monitor | 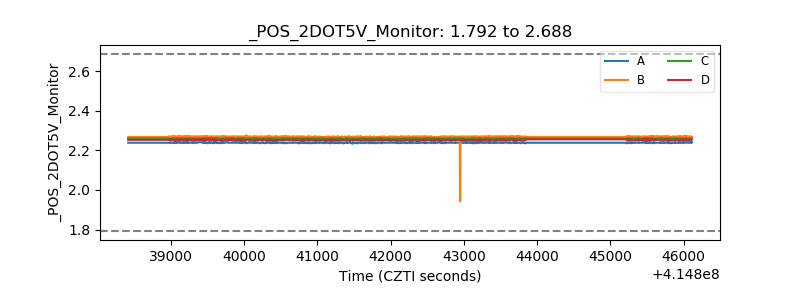 |
| +5 Volts monitor | 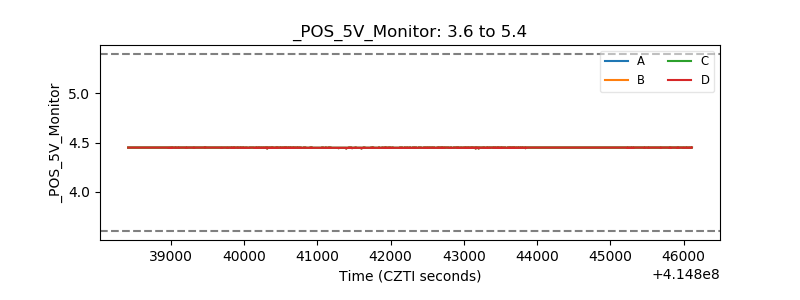 |
| _ROLL_ROT | 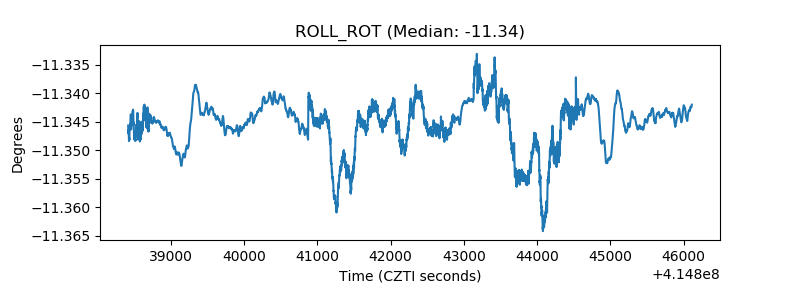 |
| _Roll_DEC | 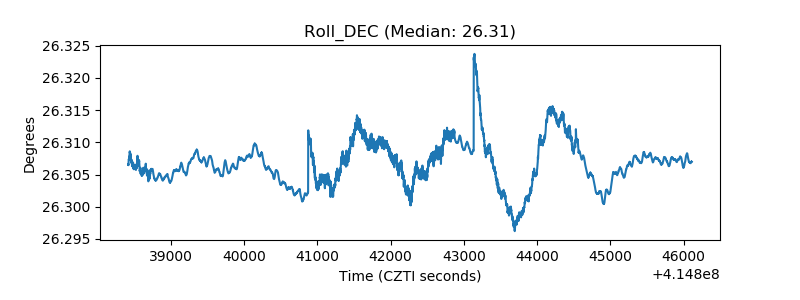 |
| _Roll_RA | 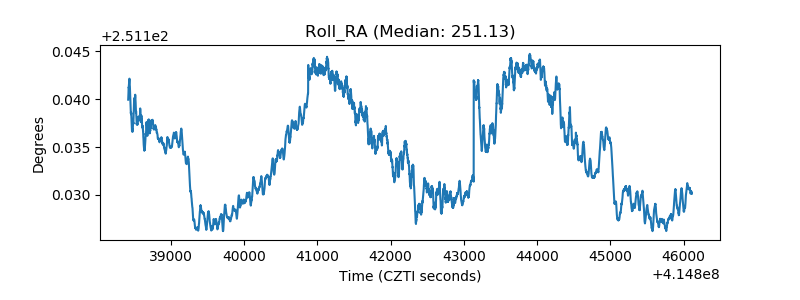 |
| Veto Counter | 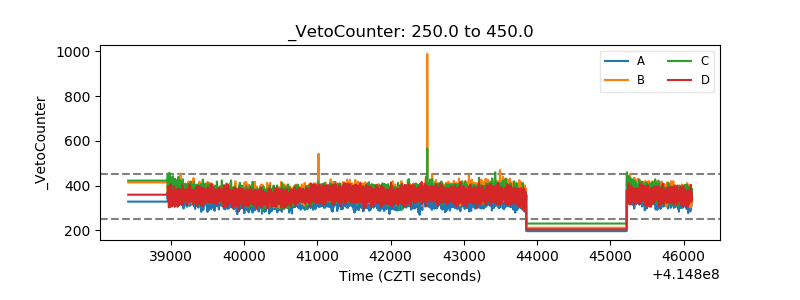 |