| Param | Original file | Final file |
|---|---|---|
| Filename | modeM0/AS1A12_054T03_9000005516_40046cztM0_level2.fits | modeM0/AS1A12_054T03_9000005516_40046cztM0_level2_quad_clean.evt |
| Size (bytes) | 394,053,120 | 95,472,000 |
| Size | 375.8 MB | 91.0 MB |
| Events in quadrant A | 3,421,550 | 634,796 |
| Events in quadrant B | 2,951,439 | 658,688 |
| Events in quadrant C | 3,725,743 | 625,366 |
| Events in quadrant D | 4,024,139 | 555,669 |
| Mode M9 | |||
|---|---|---|---|
| Quadrant | BADHDUFLAG | Total packets | Discarded packets |
| A | 0 | 20 | 0 |
| B | 0 | 20 | 0 |
| C | 0 | 20 | 0 |
| D | 0 | 21 | 0 |
| Mode SS | |||
|---|---|---|---|
| Quadrant | BADHDUFLAG | Total packets | Discarded packets |
| A | 0 | 120 | 0 |
| B | 0 | 120 | 0 |
| C | 0 | 120 | 0 |
| D | 0 | 120 | 0 |
| Mode M0 | |||
|---|---|---|---|
| Quadrant | BADHDUFLAG | Total packets | Discarded packets |
| A | 0 | 13781 | 3 |
| B | 0 | 12722 | 2 |
| C | 0 | 14898 | 2 |
| D | 0 | 16096 | 2 |
| Quadrant | Total seconds | Saturated seconds | Saturation percentage |
|---|---|---|---|
| A | 5962 | 74 | 1.241194% |
| B | 5962 | 50 | 0.838645% |
| C | 5962 | 61 | 1.023147% |
| D | 5962 | 311 | 5.216370% |
Noise dominated data is calculated using 1-second bins in cleaned event files. If a bin has >2000 counts, and if more than 50% of those come from <1% of pixels, then it is considered to be noise-dominated and hence unusable.
| Quadrant | # 1 sec bins | Bins with >0 counts | Bins with >2000 counts | High rate bins dominated by noise | Noise dominated (total time) | Noise dominated (detector-on time) | Marked lightcurve |
|---|---|---|---|---|---|---|---|
| A | 7275 | 5963 | 40 | 40 | 0.55% | 0.67% | 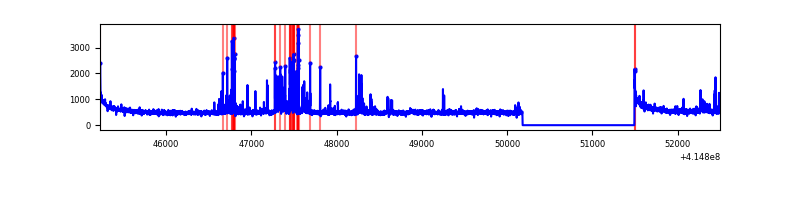 |
| B | 7275 | 5963 | 24 | 24 | 0.33% | 0.40% | 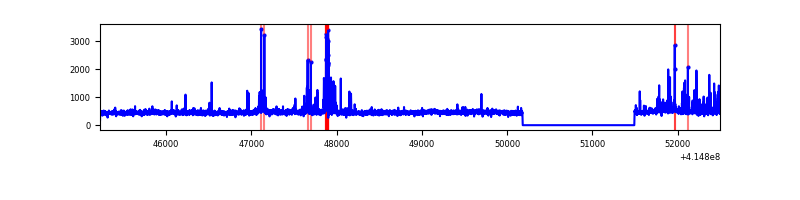 |
| C | 7275 | 5963 | 61 | 61 | 0.84% | 1.02% | 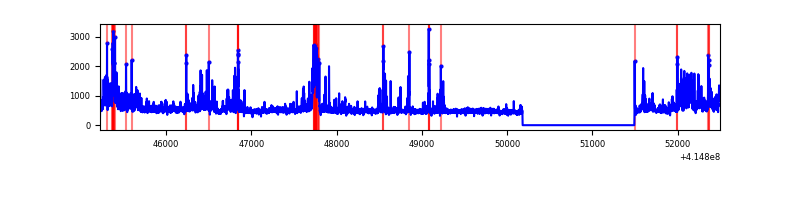 |
| D | 7275 | 5963 | 247 | 247 | 3.40% | 4.14% | 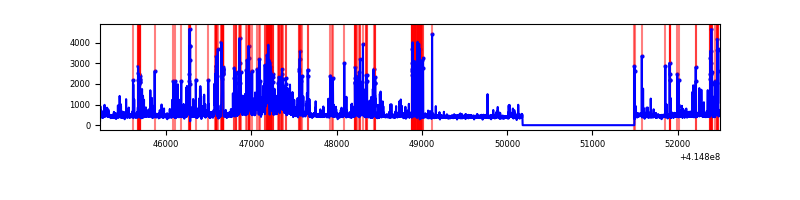 |
Top three noisy pixels from each quadrant. If the there are fewer than three noisy pixels in the level2.evt file, extra rows are filled as -1
| Pixel properties | Quadrant properties | ||||||
|---|---|---|---|---|---|---|---|
| Quadrant | DetID | PixID | Counts | Sigma | Mean | Median | Sigma |
| A | 10 | 83 | 510856 | 3798.72 | 649 | 635 | 134.3 |
| A | 13 | 248 | 302452 | 2247.1 | 649 | 635 | 134.3 |
| A | 2 | 79 | 42510 | 311.77 | 649 | 635 | 134.3 |
| B | 4 | 171 | 263895 | 2092.7 | 647 | 629 | 125.8 |
| B | 0 | 230 | 55884 | 439.22 | 647 | 629 | 125.8 |
| B | 12 | 0 | 31863 | 248.28 | 647 | 629 | 125.8 |
| C | 9 | 187 | 842629 | 5652.64 | 635 | 639 | 149.0 |
| C | 15 | 214 | 247489 | 1657.21 | 635 | 639 | 149.0 |
| C | 14 | 254 | 85848 | 572.04 | 635 | 639 | 149.0 |
| D | 13 | 249 | 486413 | 3180.21 | 620 | 602 | 152.8 |
| D | 12 | 227 | 342110 | 2235.58 | 620 | 602 | 152.8 |
| D | 12 | 233 | 290159 | 1895.49 | 620 | 602 | 152.8 |
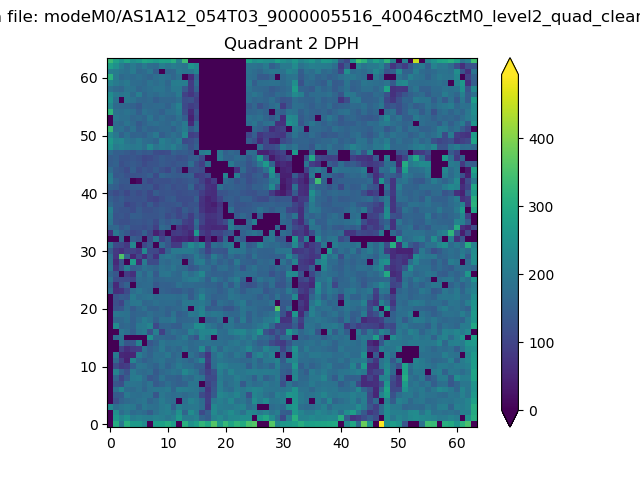
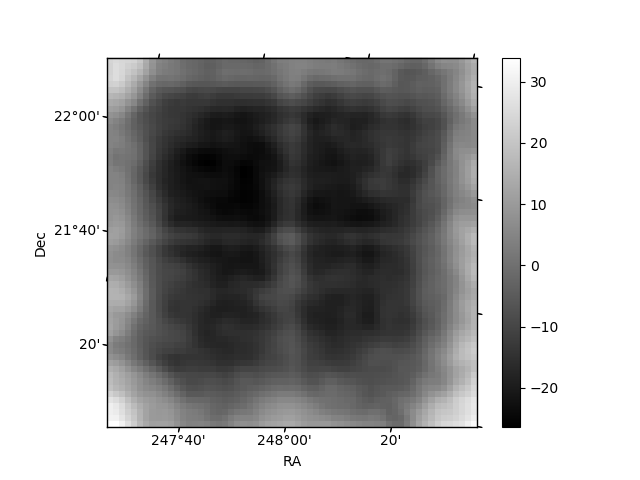
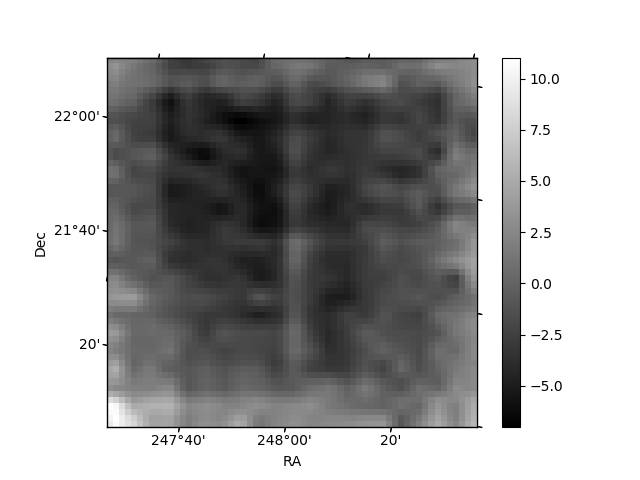
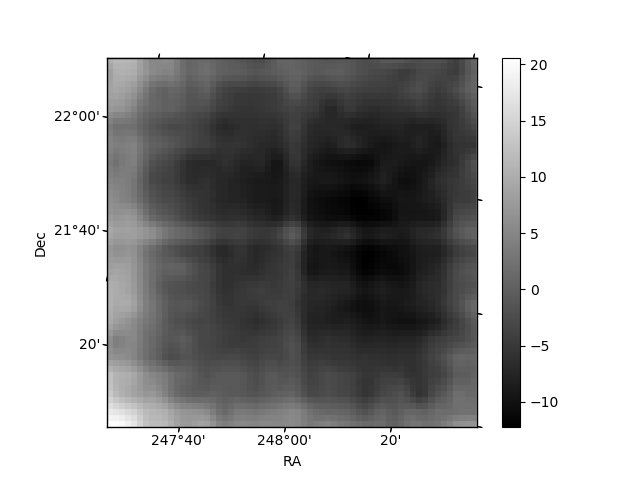
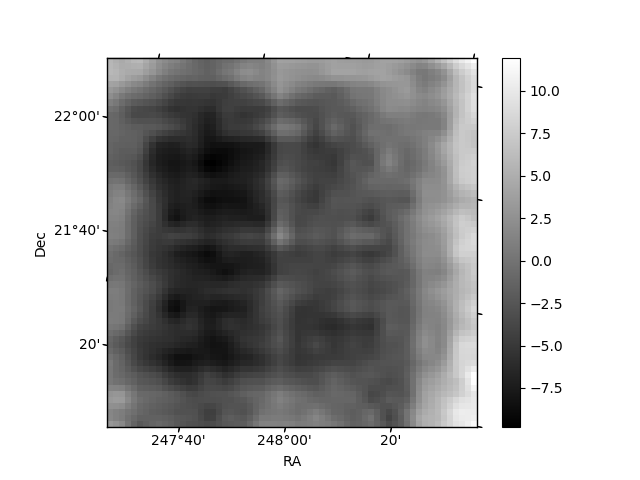
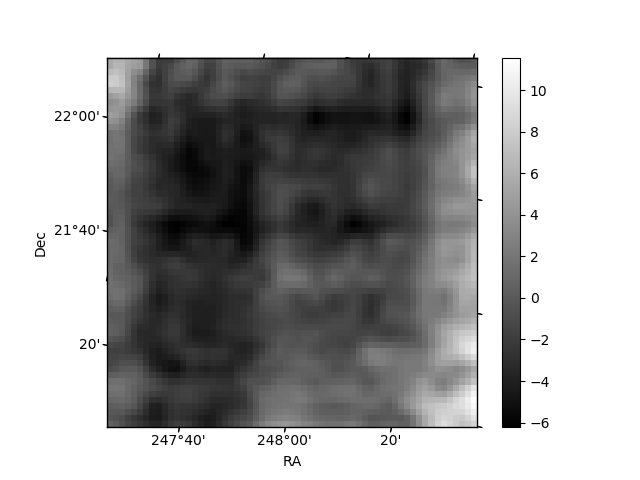
Histogram calculated using DETX and DETY for each event in the final _common_clean file
| Quadrant A | 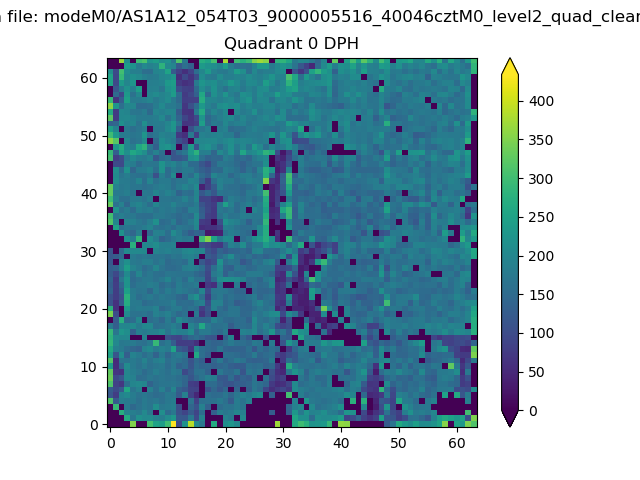 |
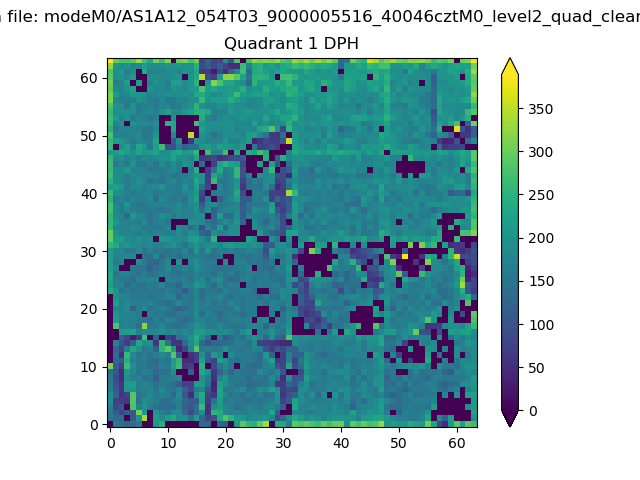 |
Quadrant B |
|---|---|---|---|
| Quadrant D | 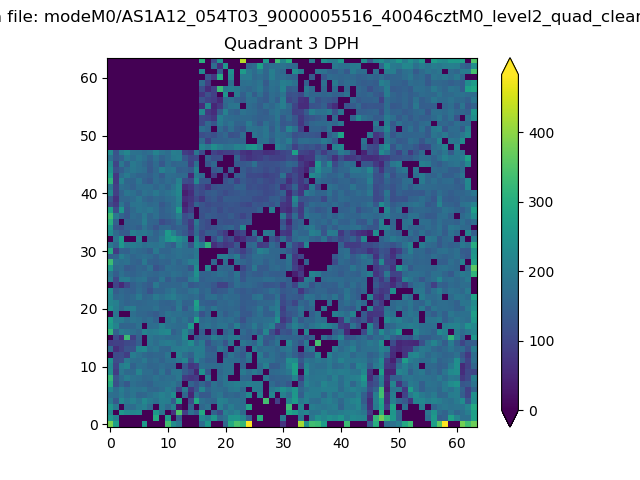 |
 |
Quadrant C |
| Plot type | Count rate plots | Images |
|---|---|---|
| Comparison with Poisson distribution Blue bars denote a histogram of data divided into 1 sec bins. Red curve is a Poisson curve with rate = median count rate of data. |
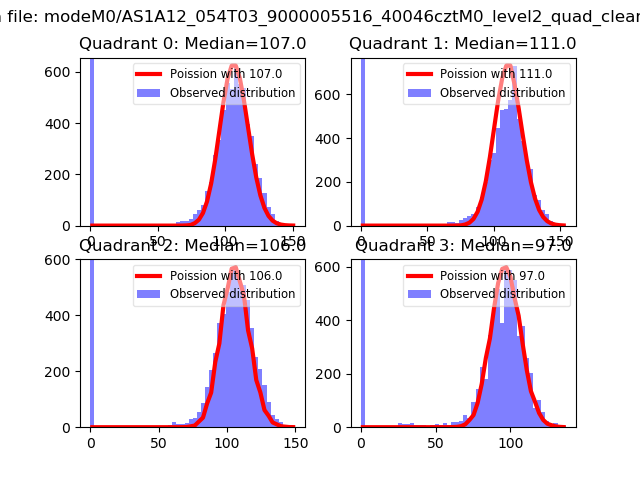 |
 |
| Quadrant-wise count rates Data is divided into 100 sec bins |
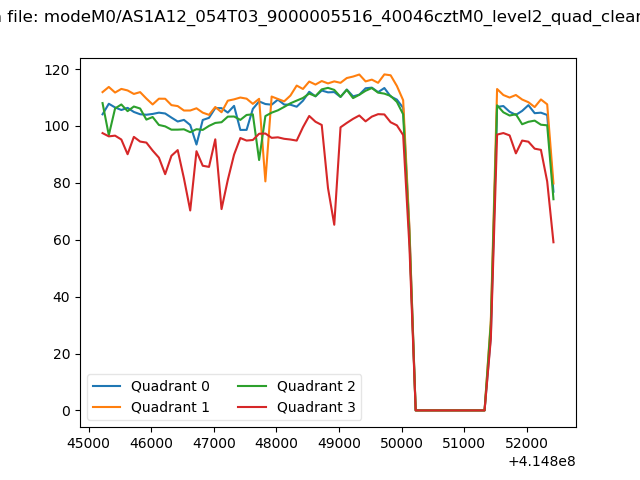 |
|
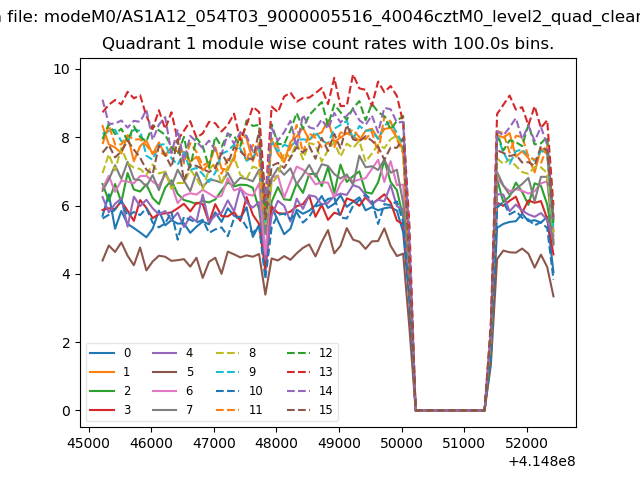
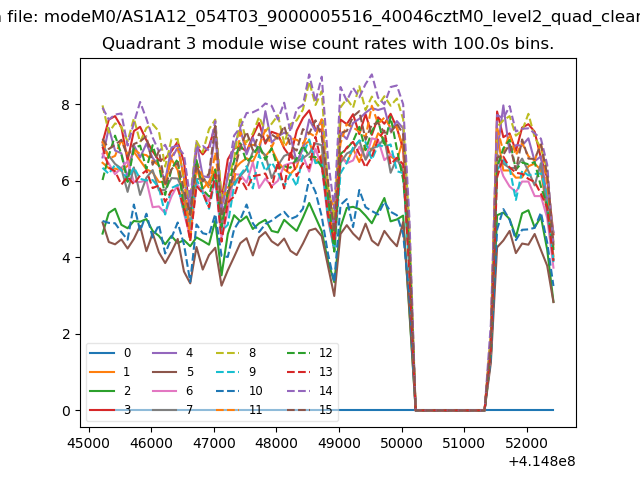
| Module-wise count rates for Quadrant A Data is divided into 100 sec bins |
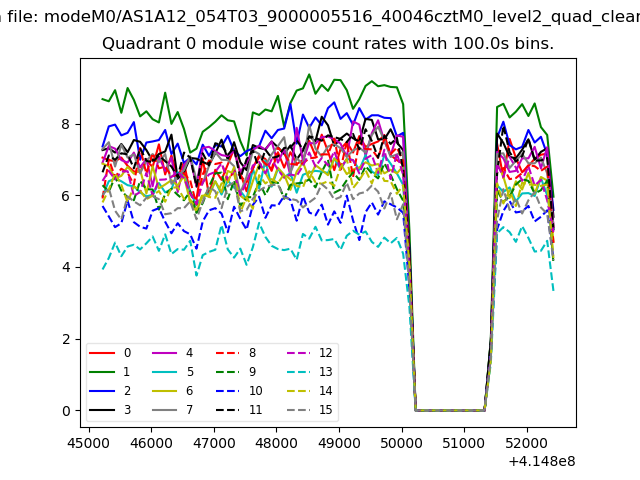 |
 |
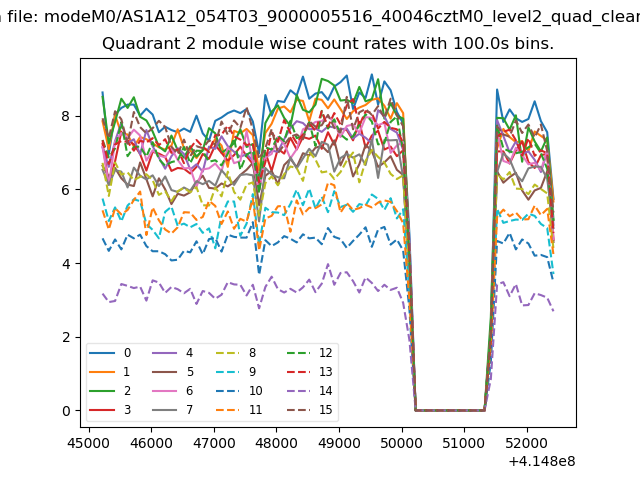
| Module-wise count rates for Quadrant B Data is divided into 100 sec bins |
 |
 |
| Module-wise count rates for Quadrant C Data is divided into 100 sec bins |
 |
 |
| Module-wise count rates for Quadrant D Data is divided into 100 sec bins |
 |
 |
| Parameter | Plot |
|---|---|
| CZT HV Monitor | 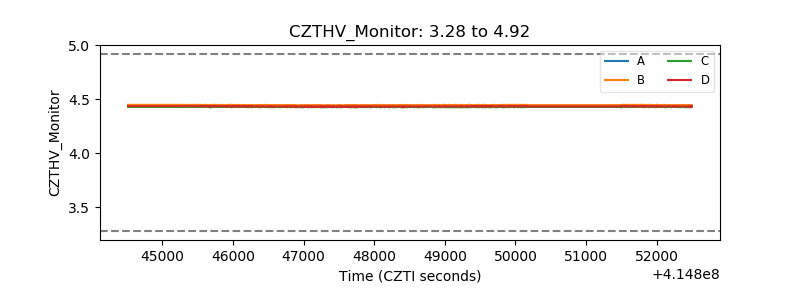 |
| D_VDD | 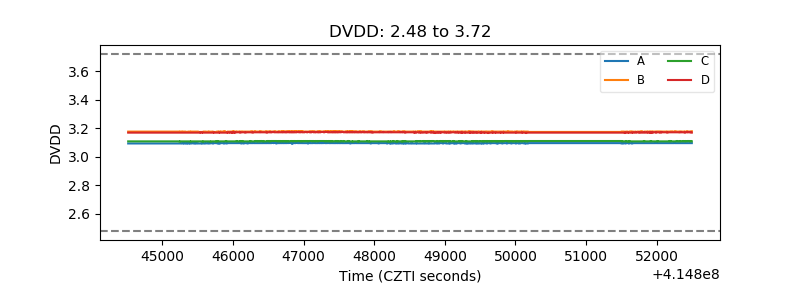 |
| Temperature 1 | 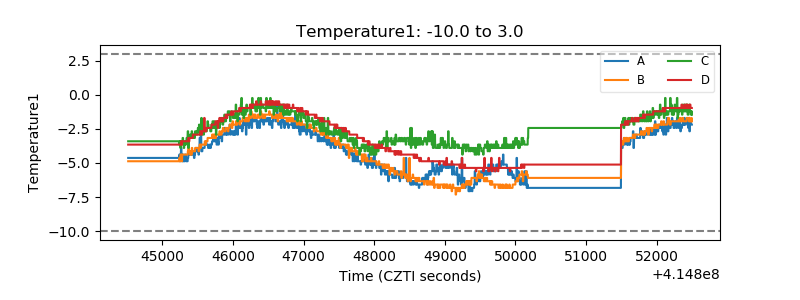 |
| Veto HV Monitor | 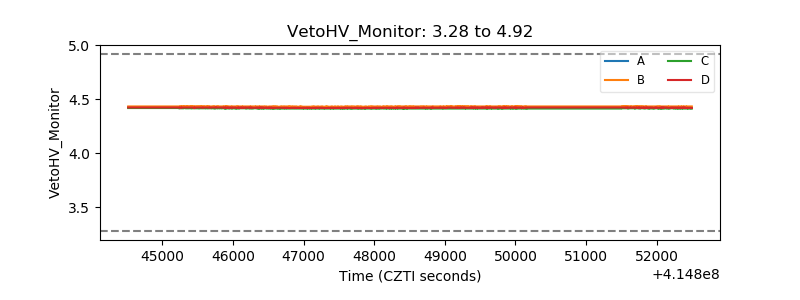 |
| Veto LLD | 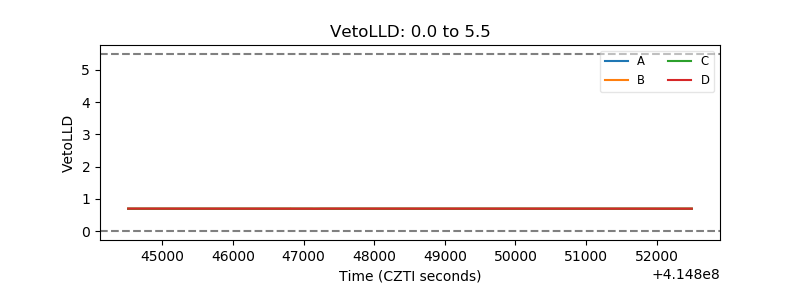 |
| Alpha Counter | 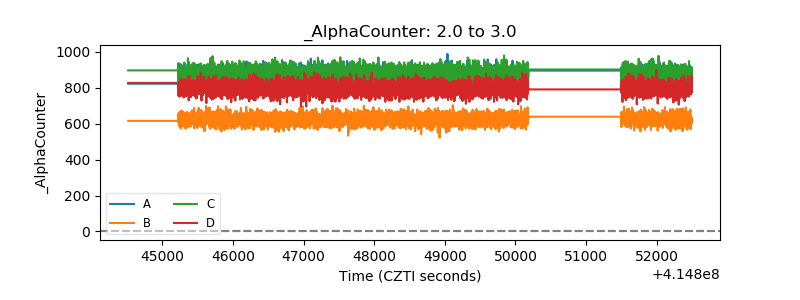 |
| _CPM_Rate | 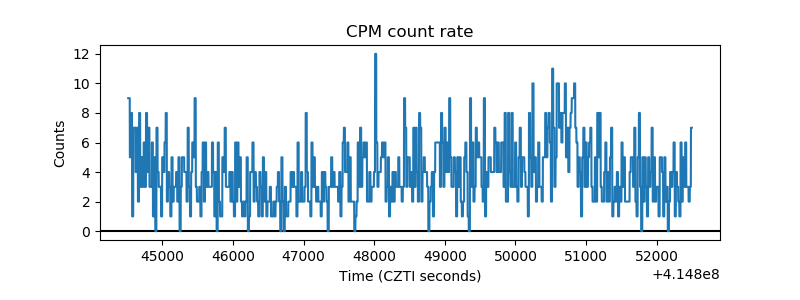 |
| CZT Counter | 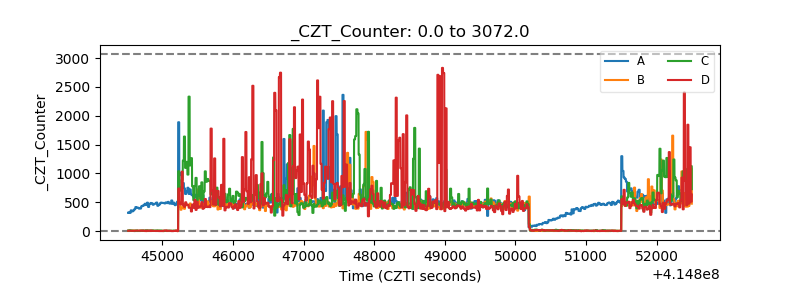 |
| +2.5 Volts monitor | 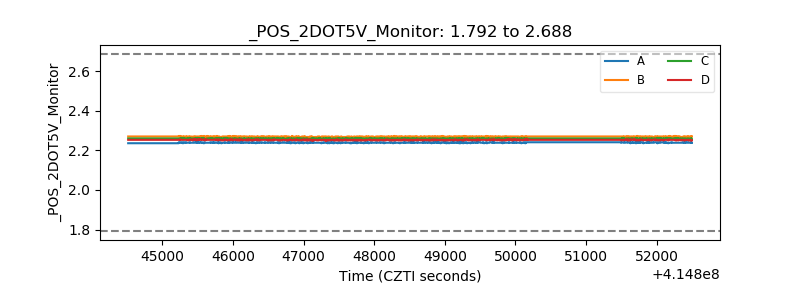 |
| +5 Volts monitor | 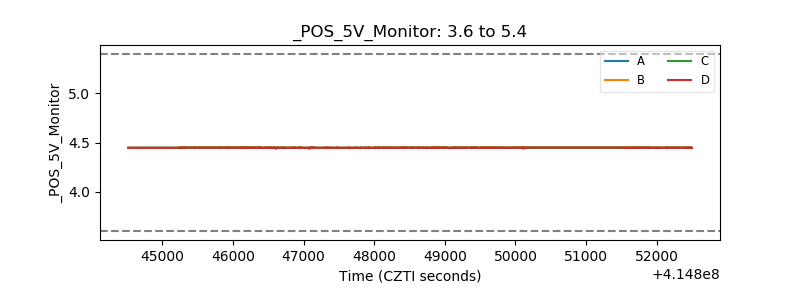 |
| _ROLL_ROT | 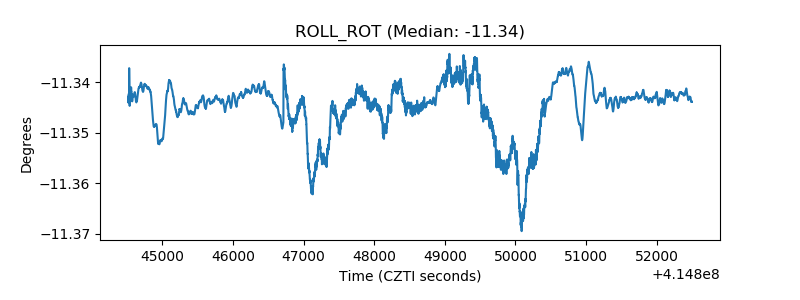 |
| _Roll_DEC | 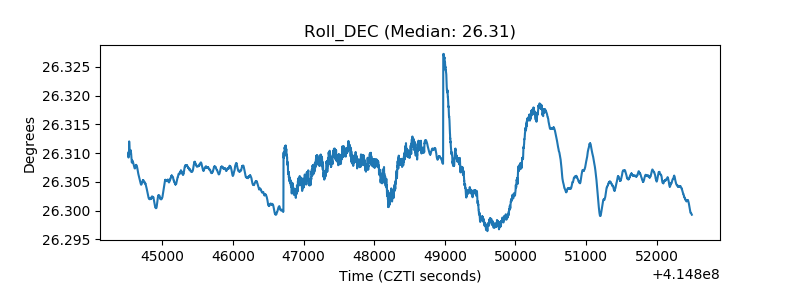 |
| _Roll_RA | 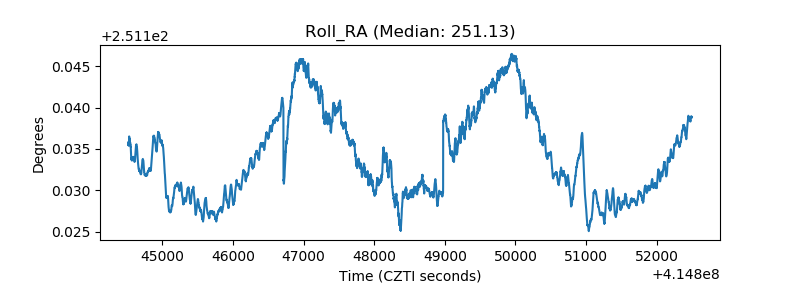 |
| Veto Counter | 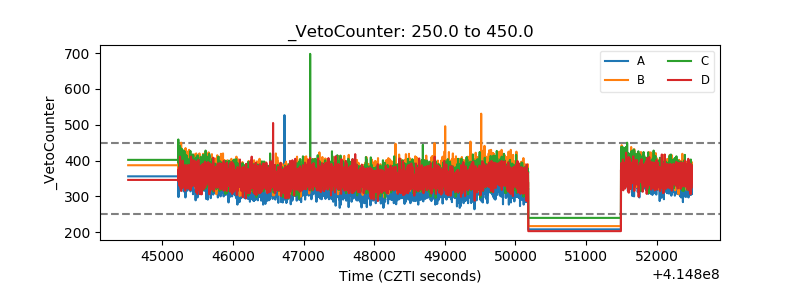 |