| Param | Original file | Final file |
|---|---|---|
| Filename | modeM0/AS1A12_054T03_9000005516_40048cztM0_level2.fits | modeM0/AS1A12_054T03_9000005516_40048cztM0_level2_quad_clean.evt |
| Size (bytes) | 312,791,040 | 79,548,480 |
| Size | 298.3 MB | 75.9 MB |
| Events in quadrant A | 2,951,047 | 526,631 |
| Events in quadrant B | 2,457,658 | 545,383 |
| Events in quadrant C | 2,871,030 | 520,611 |
| Events in quadrant D | 2,914,788 | 469,890 |
| Mode M9 | |||
|---|---|---|---|
| Quadrant | BADHDUFLAG | Total packets | Discarded packets |
| A | 0 | 14 | 0 |
| B | 0 | 13 | 0 |
| C | 0 | 13 | 0 |
| D | 0 | 14 | 0 |
| Mode SS | |||
|---|---|---|---|
| Quadrant | BADHDUFLAG | Total packets | Discarded packets |
| A | 0 | 102 | 0 |
| B | 0 | 102 | 0 |
| C | 0 | 102 | 0 |
| D | 0 | 102 | 0 |
| Mode M0 | |||
|---|---|---|---|
| Quadrant | BADHDUFLAG | Total packets | Discarded packets |
| A | 0 | 11767 | 1 |
| B | 0 | 10562 | 1 |
| C | 0 | 11706 | 1 |
| D | 0 | 12045 | 1 |
| Quadrant | Total seconds | Saturated seconds | Saturation percentage |
|---|---|---|---|
| A | 4927 | 80 | 1.623706% |
| B | 4927 | 14 | 0.284149% |
| C | 4927 | 39 | 0.791557% |
| D | 4927 | 172 | 3.490968% |
Noise dominated data is calculated using 1-second bins in cleaned event files. If a bin has >2000 counts, and if more than 50% of those come from <1% of pixels, then it is considered to be noise-dominated and hence unusable.
| Quadrant | # 1 sec bins | Bins with >0 counts | Bins with >2000 counts | High rate bins dominated by noise | Noise dominated (total time) | Noise dominated (detector-on time) | Marked lightcurve |
|---|---|---|---|---|---|---|---|
| A | 4927 | 4927 | 63 | 63 | 1.28% | 1.28% | 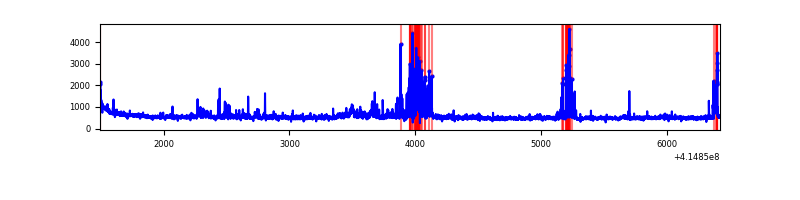 |
| B | 4927 | 4927 | 7 | 7 | 0.14% | 0.14% | 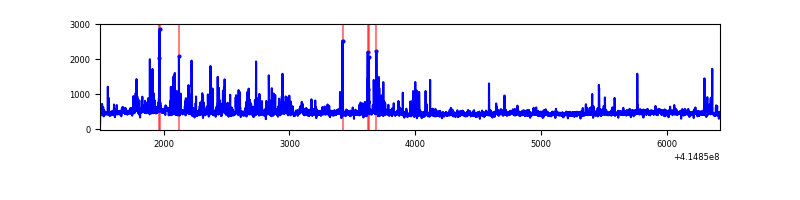 |
| C | 4927 | 4927 | 36 | 36 | 0.73% | 0.73% | 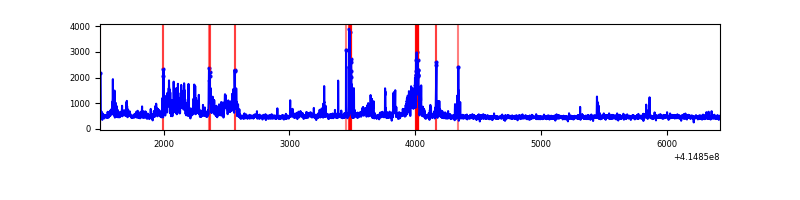 |
| D | 4927 | 4927 | 130 | 130 | 2.64% | 2.64% | 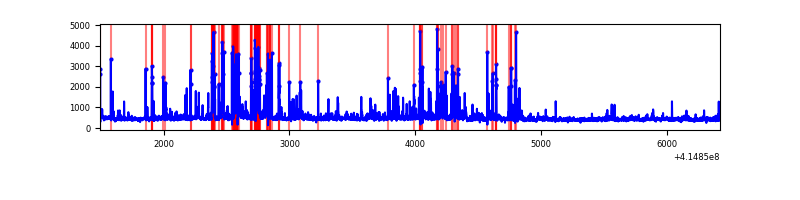 |
Top three noisy pixels from each quadrant. If the there are fewer than three noisy pixels in the level2.evt file, extra rows are filled as -1
| Pixel properties | Quadrant properties | ||||||
|---|---|---|---|---|---|---|---|
| Quadrant | DetID | PixID | Counts | Sigma | Mean | Median | Sigma |
| A | 10 | 83 | 360828 | 3272.4 | 533 | 522 | 110.1 |
| A | 13 | 248 | 182516 | 1652.92 | 533 | 522 | 110.1 |
| A | 9 | 143 | 136036 | 1230.78 | 533 | 522 | 110.1 |
| B | 4 | 171 | 190068 | 1814.06 | 532 | 517 | 104.5 |
| B | 0 | 221 | 83605 | 795.18 | 532 | 517 | 104.5 |
| B | 0 | 230 | 41574 | 392.93 | 532 | 517 | 104.5 |
| C | 9 | 187 | 597271 | 4852.15 | 524 | 527 | 123.0 |
| C | 15 | 214 | 198684 | 1611.22 | 524 | 527 | 123.0 |
| C | 14 | 254 | 18388 | 145.23 | 524 | 527 | 123.0 |
| D | 13 | 249 | 319100 | 2505.5 | 514 | 498 | 127.2 |
| D | 2 | 250 | 300685 | 2360.69 | 514 | 498 | 127.2 |
| D | 12 | 227 | 143002 | 1120.66 | 514 | 498 | 127.2 |
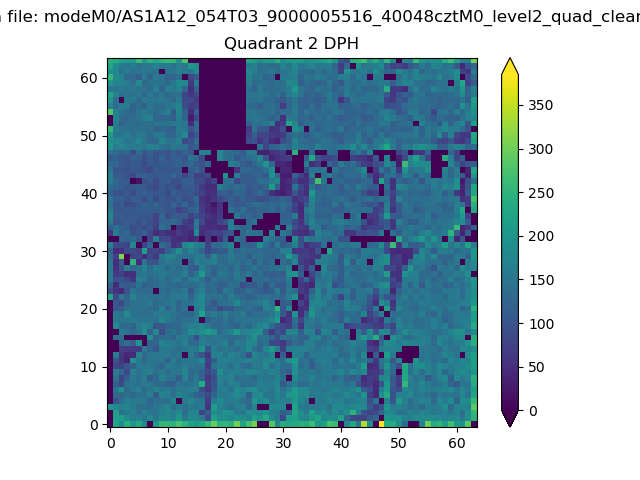
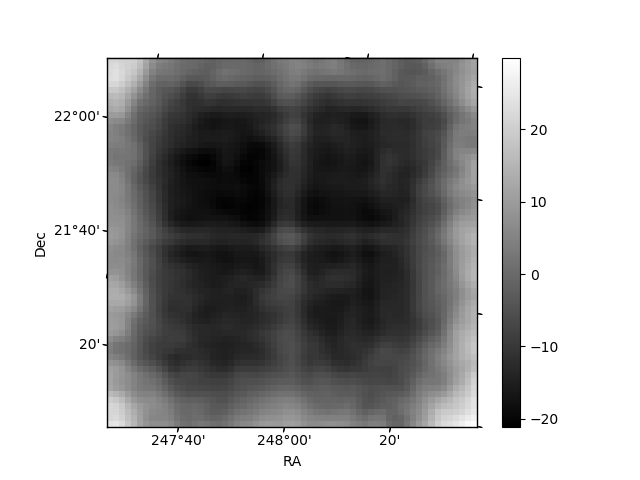
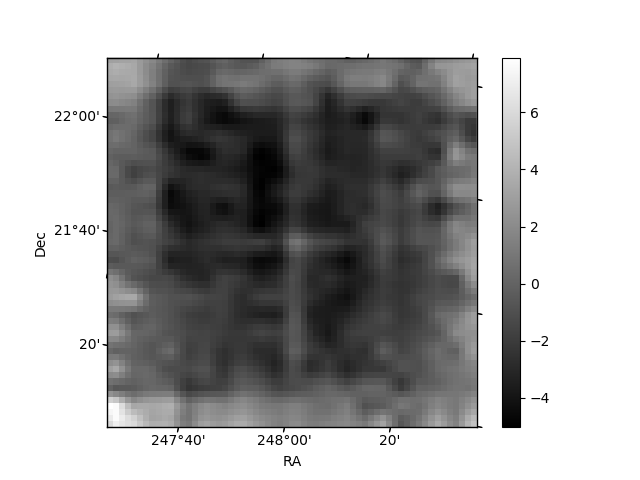
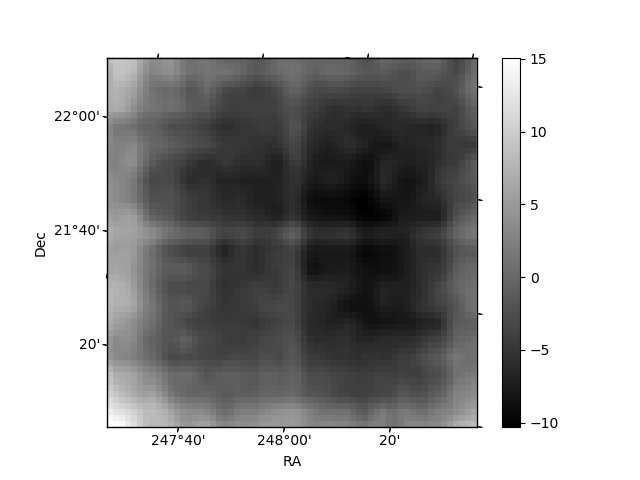
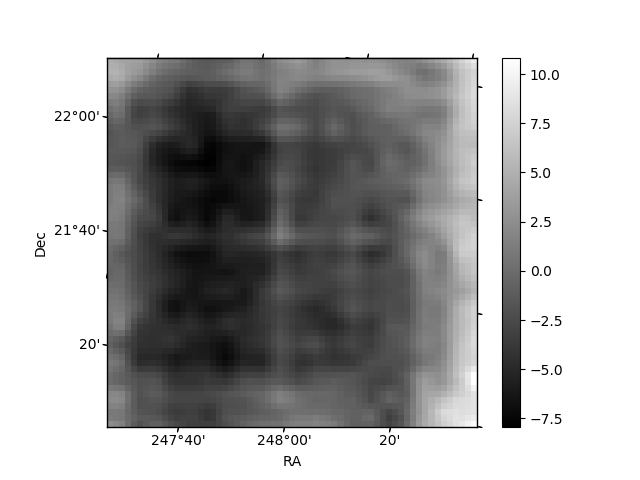
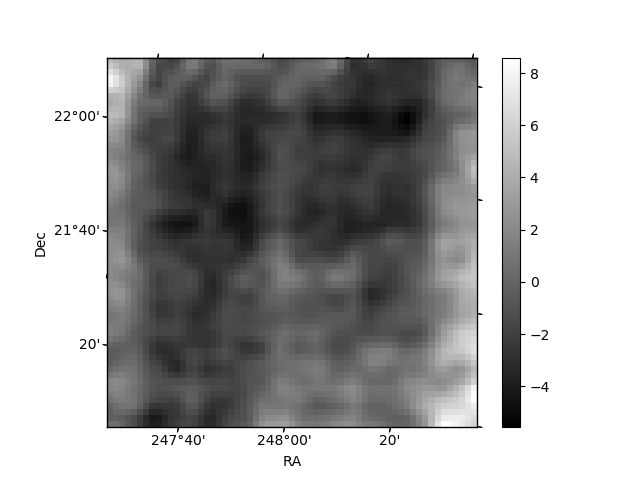
Histogram calculated using DETX and DETY for each event in the final _common_clean file
| Quadrant A | 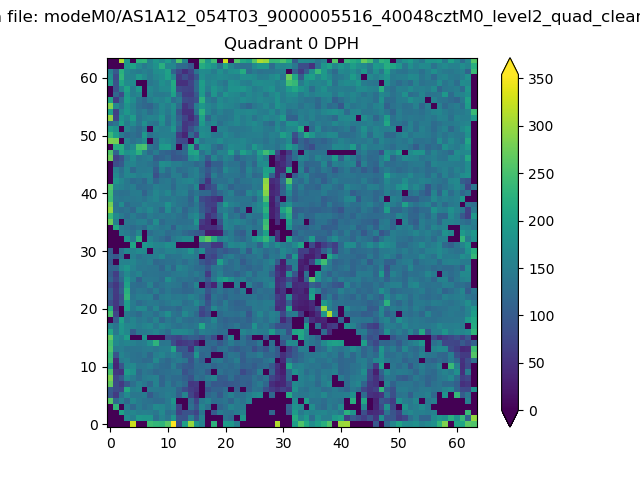 |
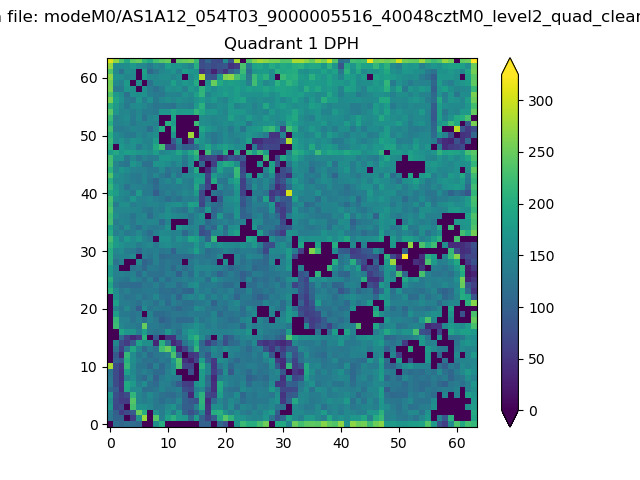 |
Quadrant B |
|---|---|---|---|
| Quadrant D | 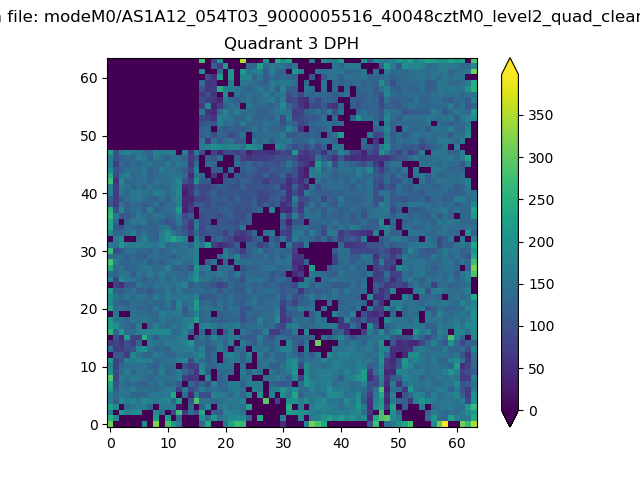 |
 |
Quadrant C |
| Plot type | Count rate plots | Images |
|---|---|---|
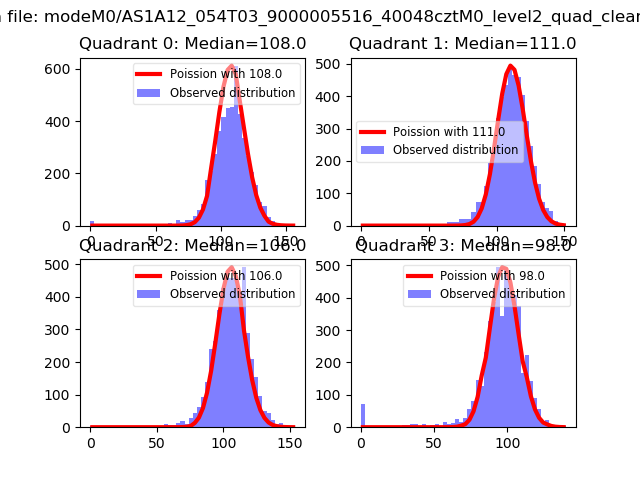
| Comparison with Poisson distribution Blue bars denote a histogram of data divided into 1 sec bins. Red curve is a Poisson curve with rate = median count rate of data. |
 |
 |
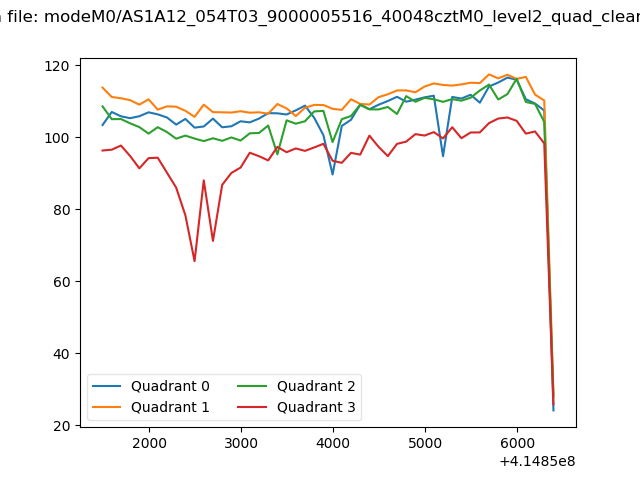
| Quadrant-wise count rates Data is divided into 100 sec bins |
 |
|
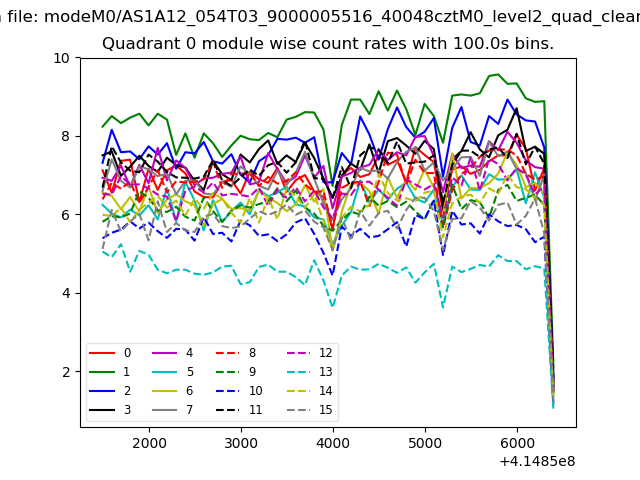
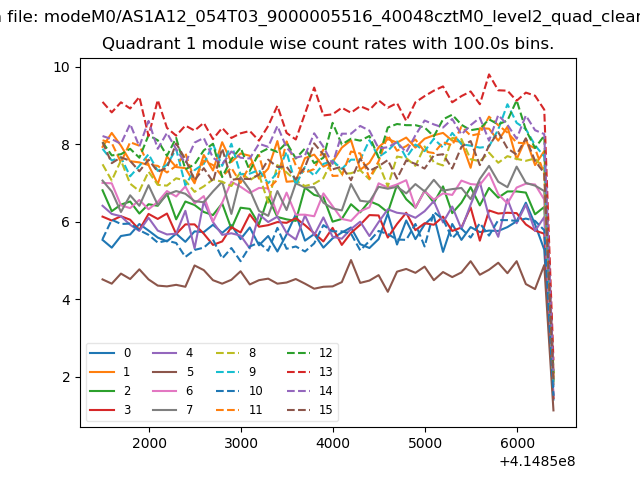
| Module-wise count rates for Quadrant A Data is divided into 100 sec bins |
 |
 |
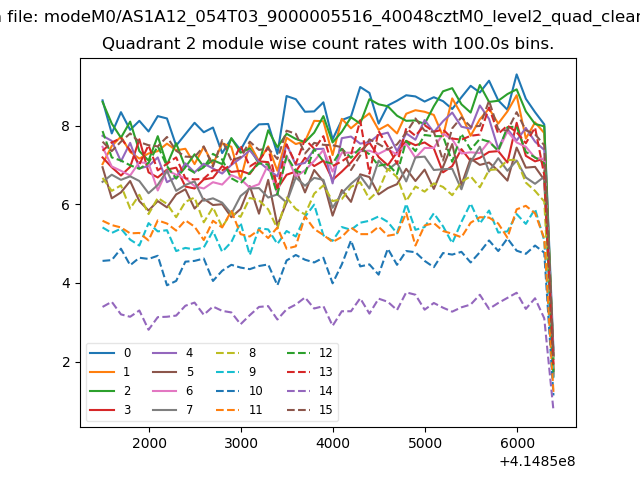
| Module-wise count rates for Quadrant B Data is divided into 100 sec bins |
 |
 |
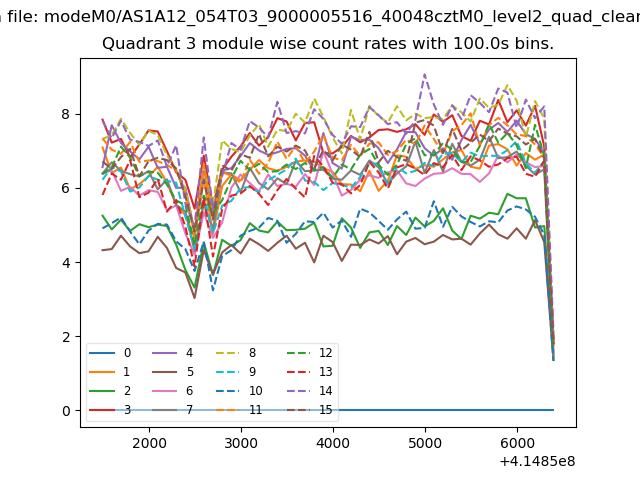
| Module-wise count rates for Quadrant C Data is divided into 100 sec bins |
 |
 |
| Module-wise count rates for Quadrant D Data is divided into 100 sec bins |
 |
 |
| Parameter | Plot |
|---|---|
| CZT HV Monitor | 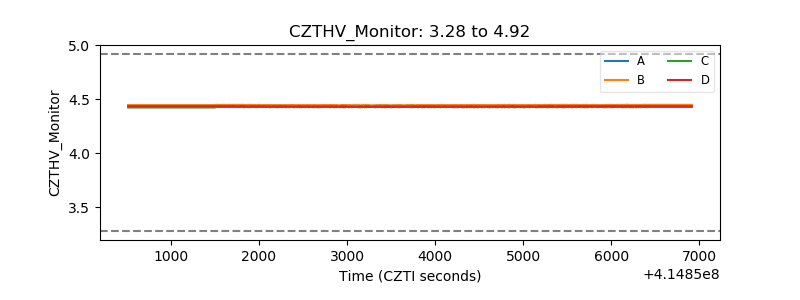 |
| D_VDD | 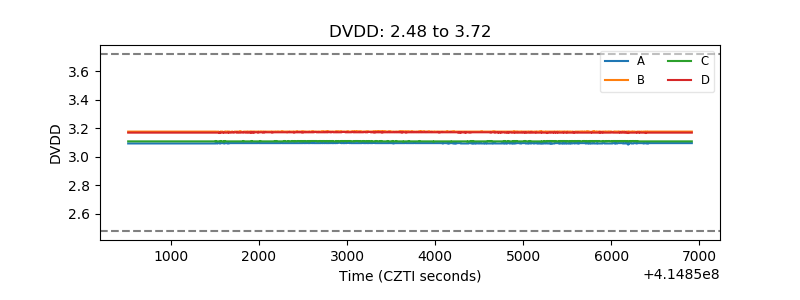 |
| Temperature 1 | 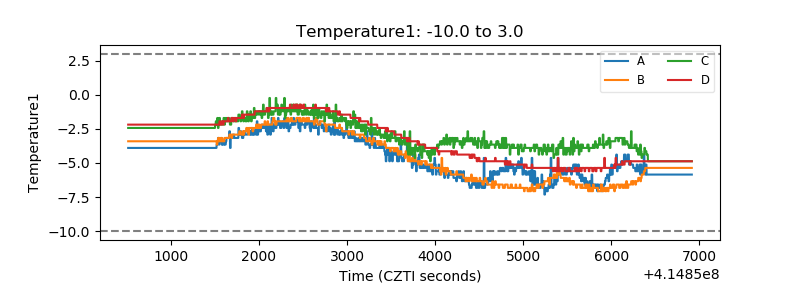 |
| Veto HV Monitor | 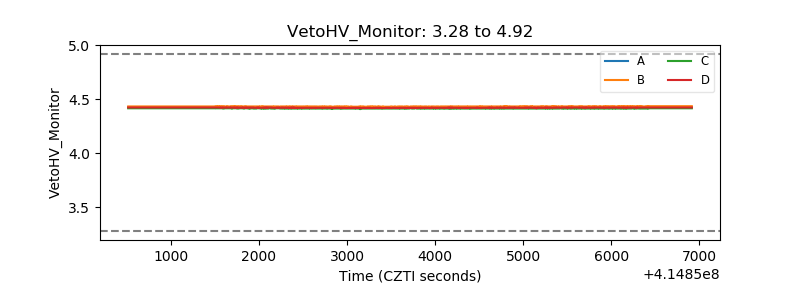 |
| Veto LLD | 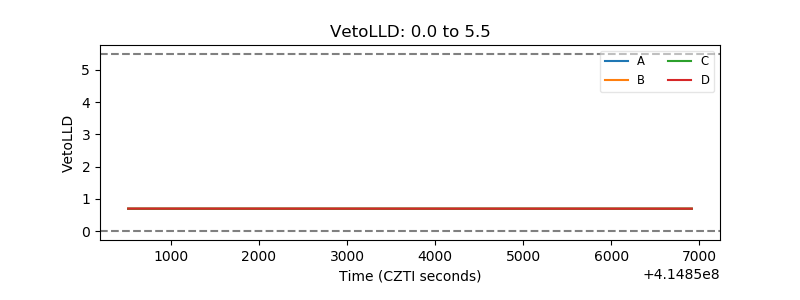 |
| Alpha Counter | 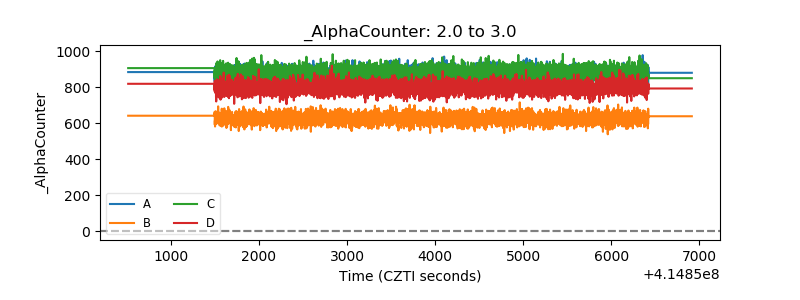 |
| _CPM_Rate | 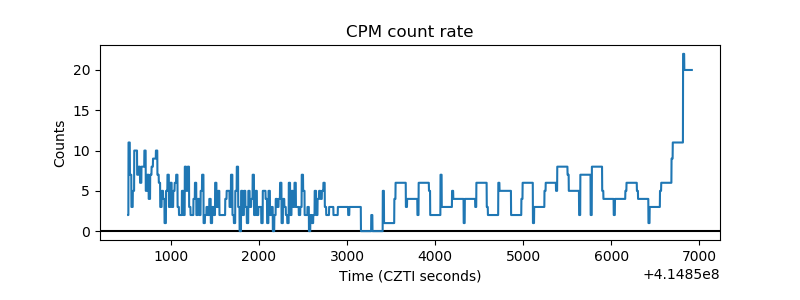 |
| CZT Counter | 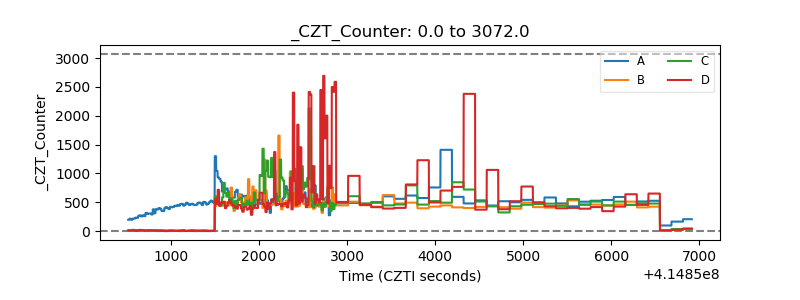 |
| +2.5 Volts monitor | 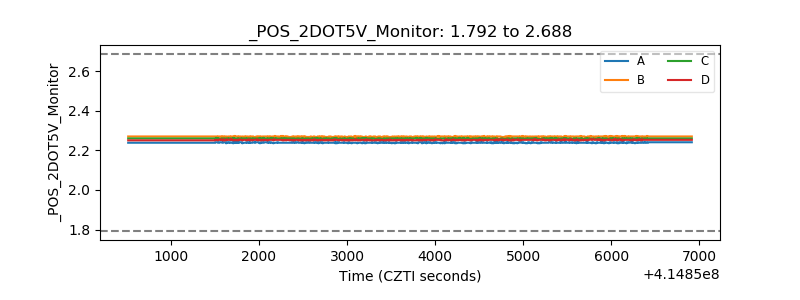 |
| +5 Volts monitor | 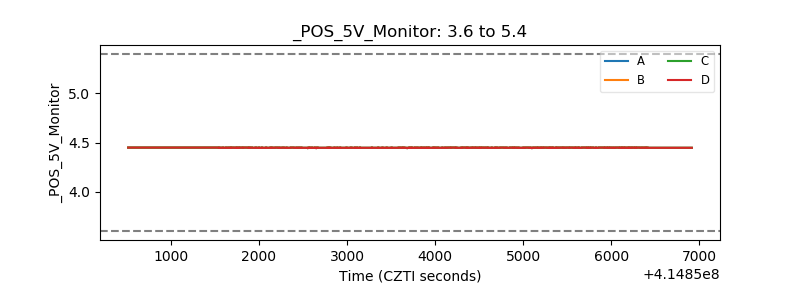 |
| _ROLL_ROT | 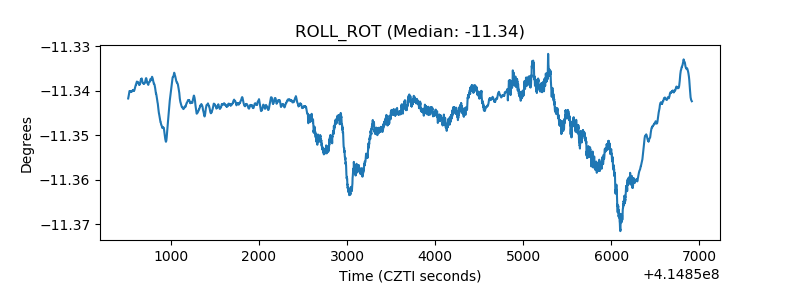 |
| _Roll_DEC | 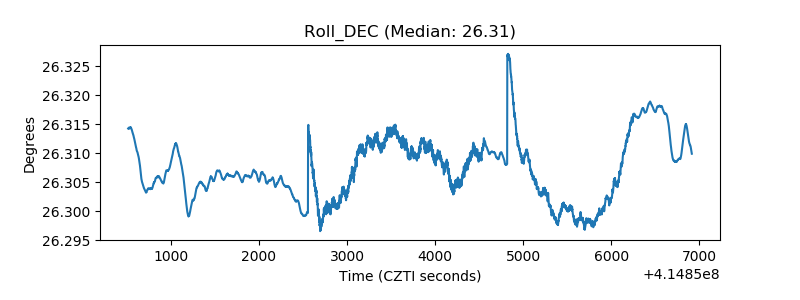 |
| _Roll_RA | 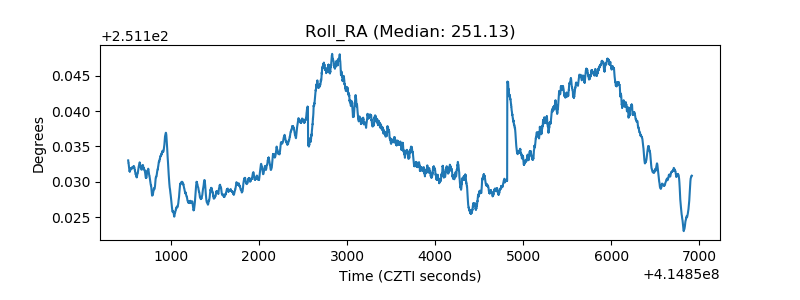 |
| Veto Counter | 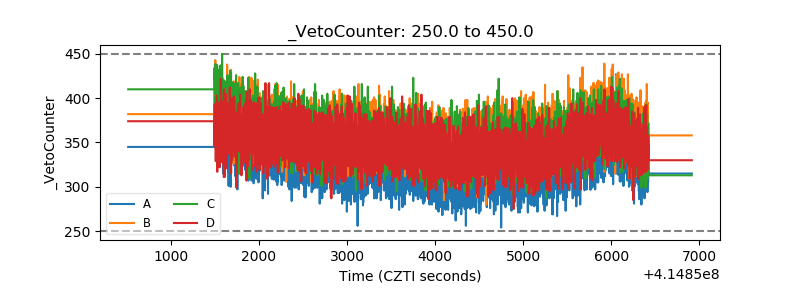 |