| Param | Original file | Final file |
|---|---|---|
| Filename | modeM0/AS1A12_054T03_9000005516_40049cztM0_level2.fits | modeM0/AS1A12_054T03_9000005516_40049cztM0_level2_quad_clean.evt |
| Size (bytes) | 731,557,440 | 166,193,280 |
| Size | 697.7 MB | 158.5 MB |
| Events in quadrant A | 5,772,063 | 1,134,413 |
| Events in quadrant B | 5,032,044 | 1,160,367 |
| Events in quadrant C | 5,534,018 | 1,114,872 |
| Events in quadrant D | 9,924,382 | 892,481 |
| Mode M9 | |||
|---|---|---|---|
| Quadrant | BADHDUFLAG | Total packets | Discarded packets |
| A | 0 | 41 | 0 |
| B | 0 | 41 | 0 |
| C | 0 | 41 | 0 |
| D | 0 | 42 | 0 |
| Mode SS | |||
|---|---|---|---|
| Quadrant | BADHDUFLAG | Total packets | Discarded packets |
| A | 0 | 214 | 0 |
| B | 0 | 214 | 0 |
| C | 0 | 214 | 0 |
| D | 0 | 214 | 0 |
| Mode M0 | |||
|---|---|---|---|
| Quadrant | BADHDUFLAG | Total packets | Discarded packets |
| A | 0 | 23659 | 4 |
| B | 0 | 22300 | 3 |
| C | 0 | 23190 | 3 |
| D | 0 | 36795 | 3 |
| Quadrant | Total seconds | Saturated seconds | Saturation percentage |
|---|---|---|---|
| A | 10541 | 38 | 0.360497% |
| B | 10541 | 107 | 1.015084% |
| C | 10541 | 31 | 0.294090% |
| D | 10541 | 1547 | 14.676027% |
Noise dominated data is calculated using 1-second bins in cleaned event files. If a bin has >2000 counts, and if more than 50% of those come from <1% of pixels, then it is considered to be noise-dominated and hence unusable.
| Quadrant | # 1 sec bins | Bins with >0 counts | Bins with >2000 counts | High rate bins dominated by noise | Noise dominated (total time) | Noise dominated (detector-on time) | Marked lightcurve |
|---|---|---|---|---|---|---|---|
| A | 13496 | 10543 | 11 | 11 | 0.08% | 0.10% | 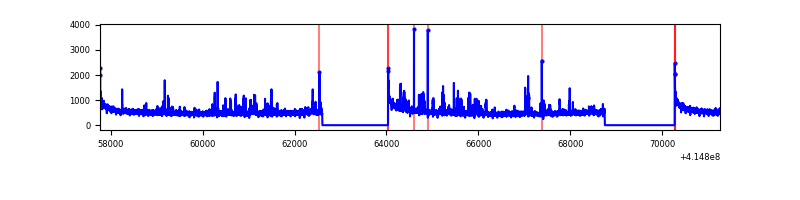 |
| B | 13496 | 10543 | 67 | 67 | 0.50% | 0.64% | 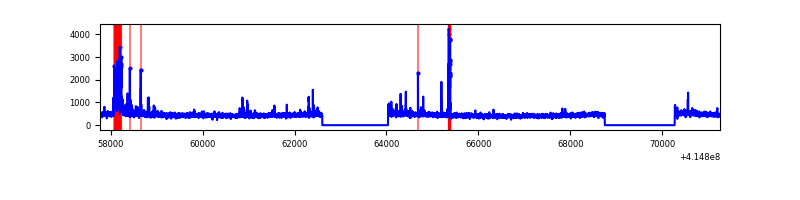 |
| C | 13496 | 10543 | 21 | 21 | 0.16% | 0.20% | 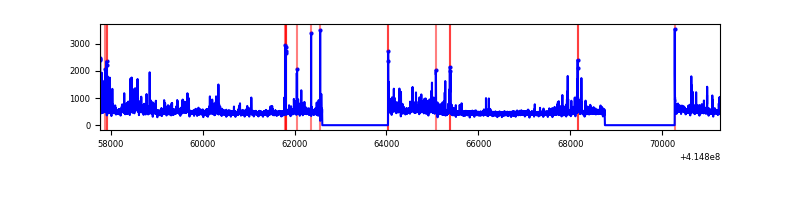 |
| D | 13496 | 10543 | 1305 | 1305 | 9.67% | 12.38% | 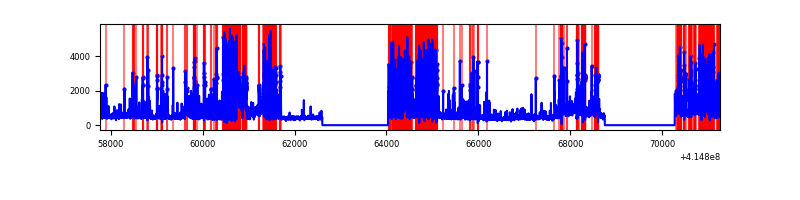 |
Top three noisy pixels from each quadrant. If the there are fewer than three noisy pixels in the level2.evt file, extra rows are filled as -1
| Pixel properties | Quadrant properties | ||||||
|---|---|---|---|---|---|---|---|
| Quadrant | DetID | PixID | Counts | Sigma | Mean | Median | Sigma |
| A | 10 | 83 | 845427 | 3599.59 | 1153 | 1131 | 234.6 |
| A | 6 | 10 | 397424 | 1689.56 | 1153 | 1131 | 234.6 |
| A | 2 | 79 | 26545 | 108.35 | 1153 | 1131 | 234.6 |
| B | 5 | 255 | 233112 | 1029.34 | 1148 | 1113 | 225.4 |
| B | 0 | 221 | 79136 | 346.18 | 1148 | 1113 | 225.4 |
| B | 4 | 171 | 75795 | 331.35 | 1148 | 1113 | 225.4 |
| C | 9 | 187 | 489130 | 1848.08 | 1132 | 1141 | 264.1 |
| C | 15 | 214 | 431870 | 1631.23 | 1132 | 1141 | 264.1 |
| C | 14 | 254 | 124506 | 467.2 | 1132 | 1141 | 264.1 |
| D | 12 | 227 | 4549411 | 18075.44 | 1036 | 1008 | 251.6 |
| D | 13 | 249 | 869480 | 3451.32 | 1036 | 1008 | 251.6 |
| D | 2 | 250 | 243903 | 965.27 | 1036 | 1008 | 251.6 |
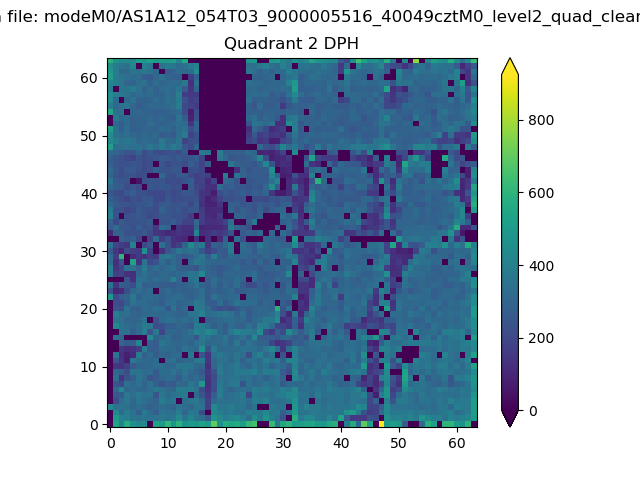
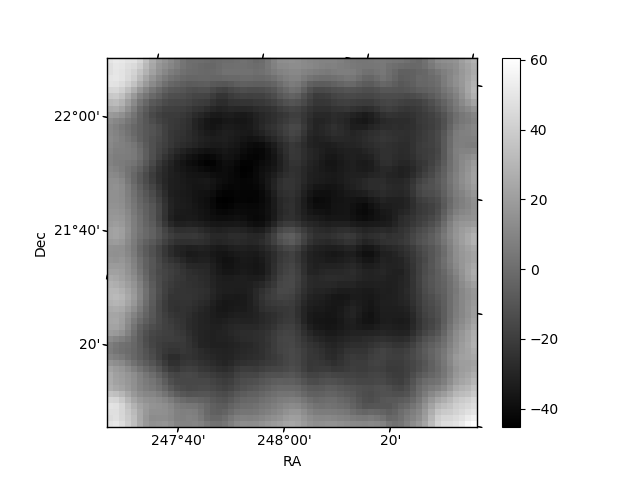
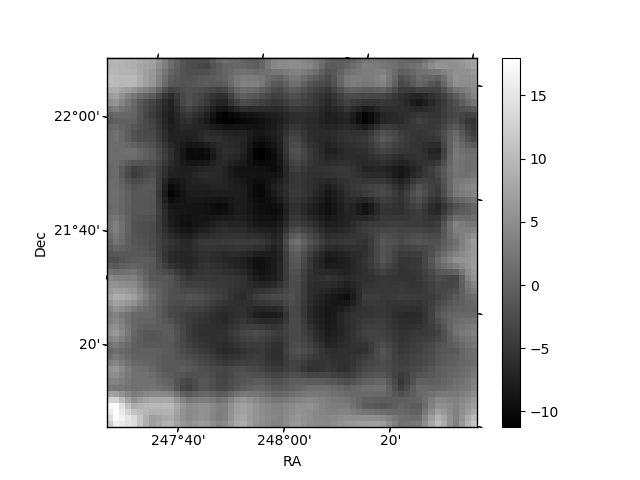
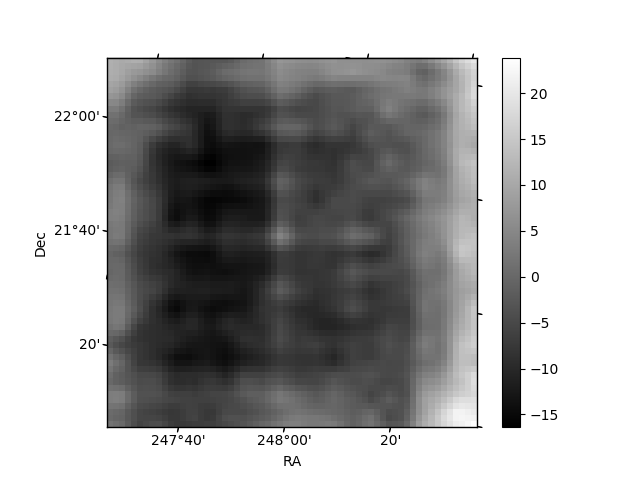
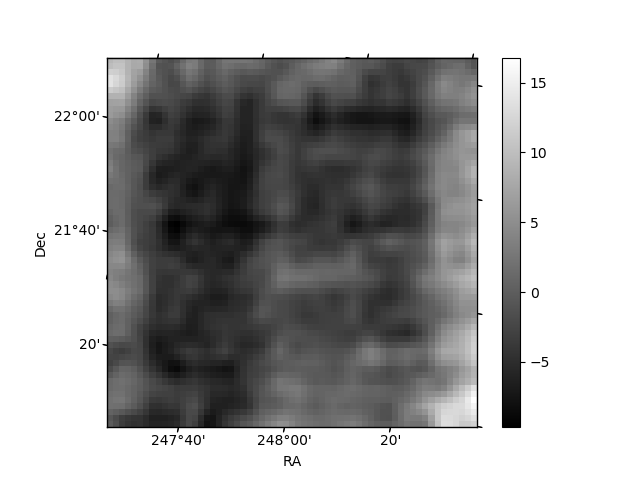
Histogram calculated using DETX and DETY for each event in the final _common_clean file
| Quadrant A | 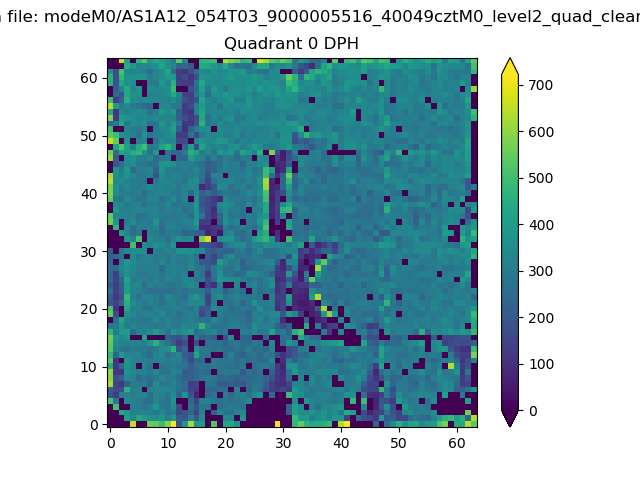 |
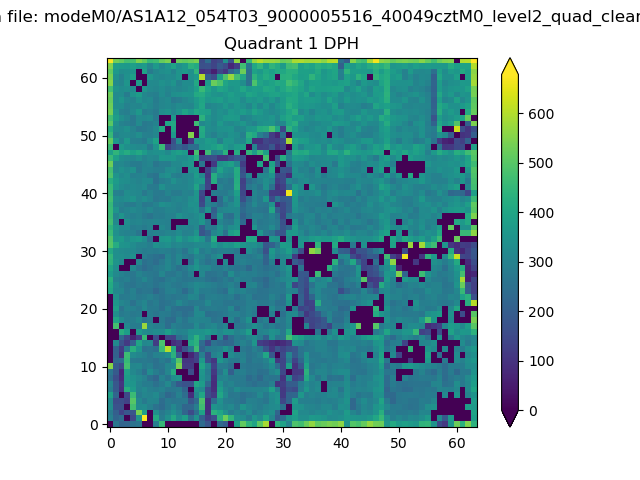 |
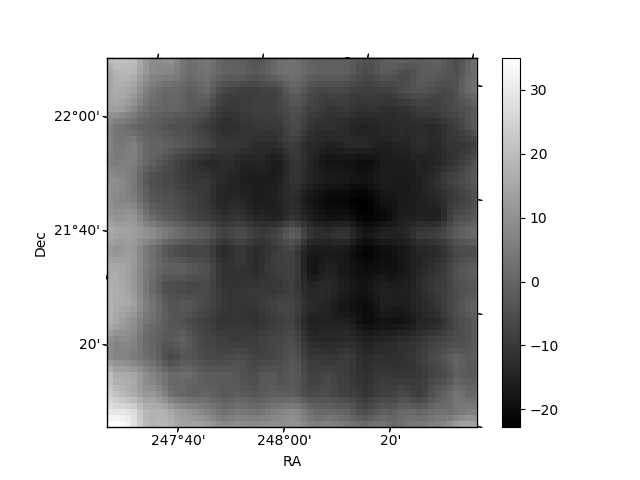
Quadrant B |
|---|---|---|---|
| Quadrant D | 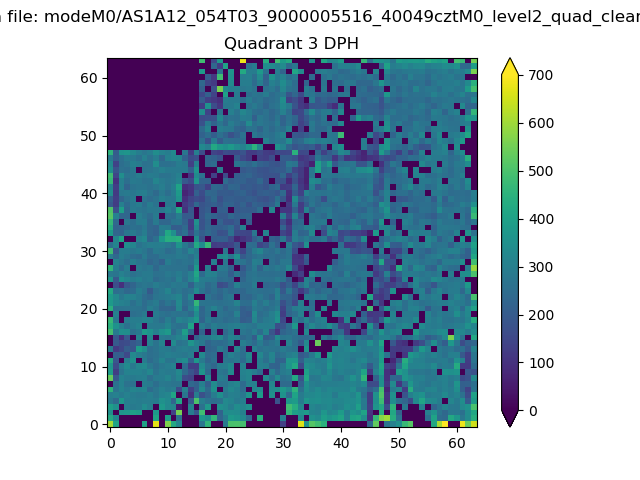 |
 |
Quadrant C |
| Plot type | Count rate plots | Images |
|---|---|---|
| Comparison with Poisson distribution Blue bars denote a histogram of data divided into 1 sec bins. Red curve is a Poisson curve with rate = median count rate of data. |
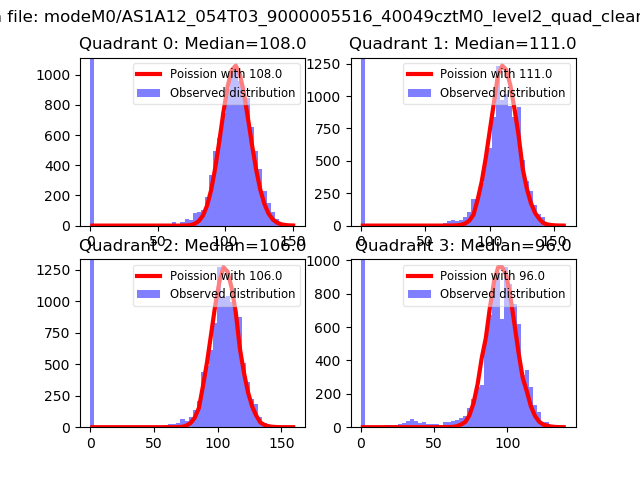 |
 |
| Quadrant-wise count rates Data is divided into 100 sec bins |
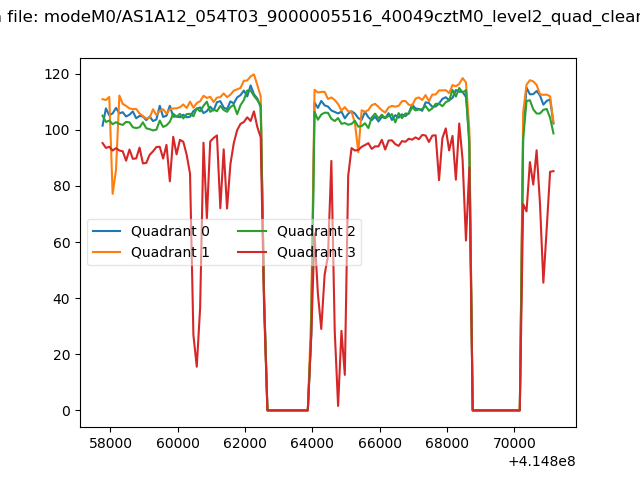 |
|
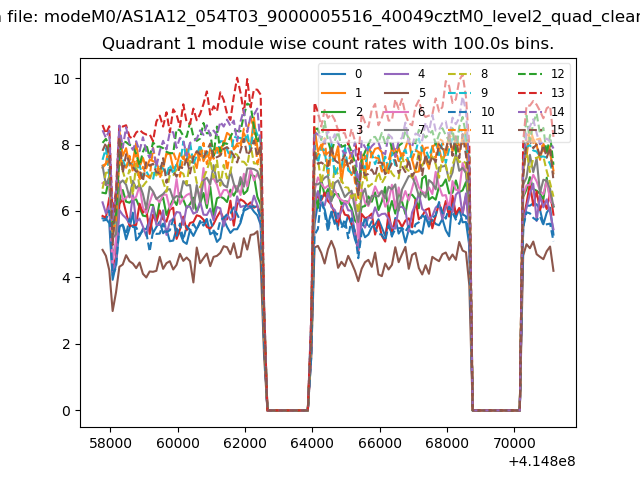
| Module-wise count rates for Quadrant A Data is divided into 100 sec bins |
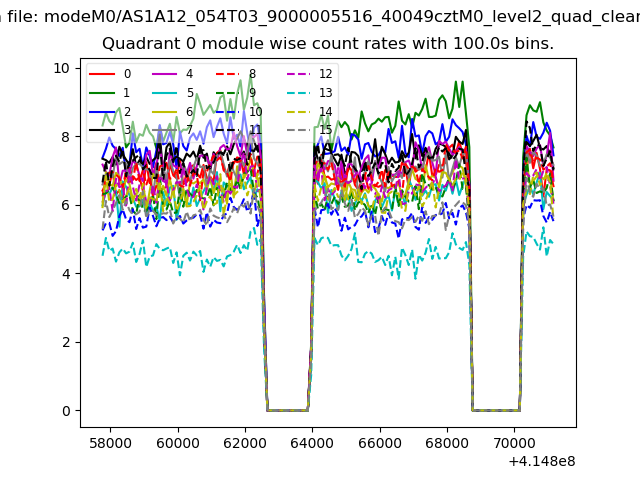 |
 |
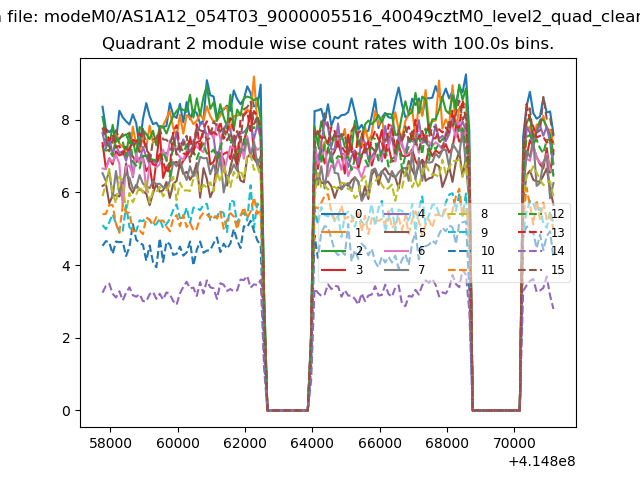
| Module-wise count rates for Quadrant B Data is divided into 100 sec bins |
 |
 |
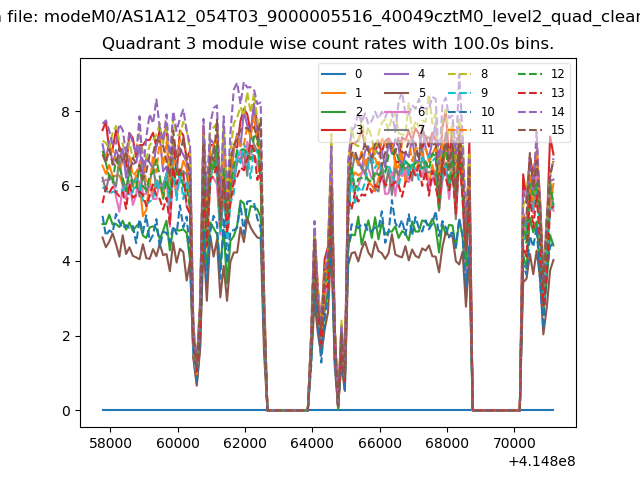
| Module-wise count rates for Quadrant C Data is divided into 100 sec bins |
 |
 |
| Module-wise count rates for Quadrant D Data is divided into 100 sec bins |
 |
 |
| Parameter | Plot |
|---|---|
| CZT HV Monitor | 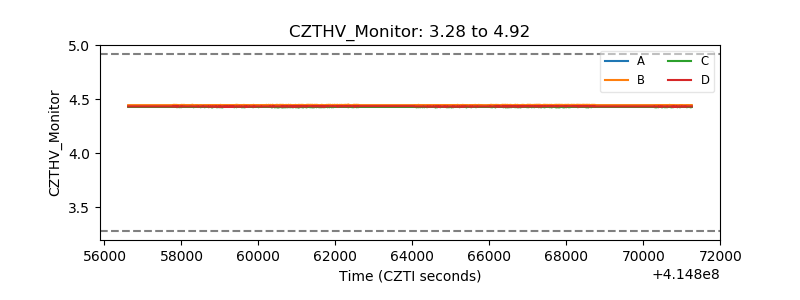 |
| D_VDD | 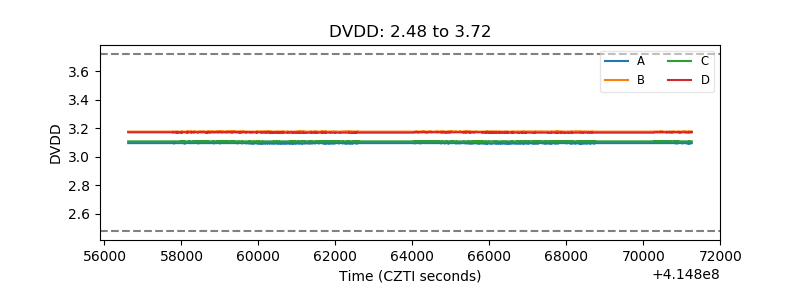 |
| Temperature 1 | 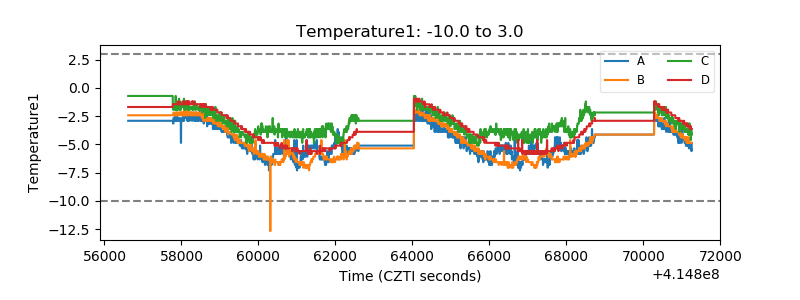 |
| Veto HV Monitor | 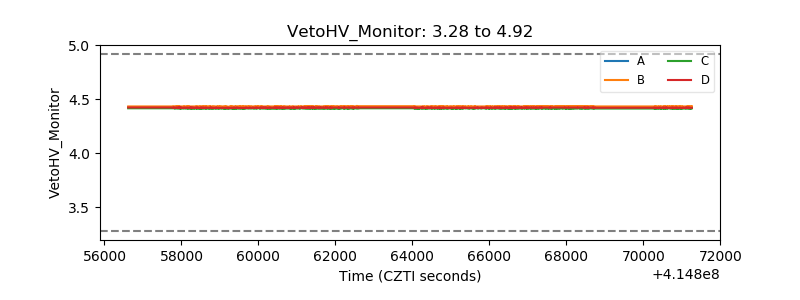 |
| Veto LLD | 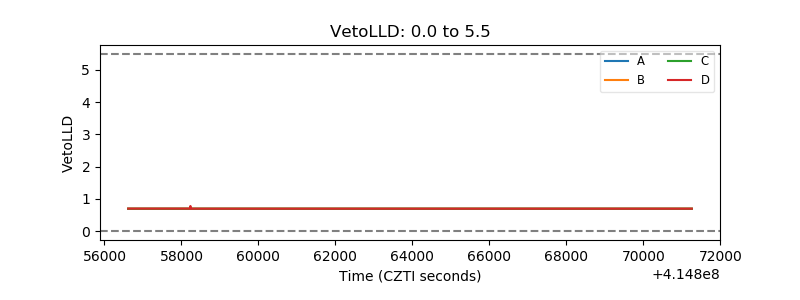 |
| Alpha Counter | 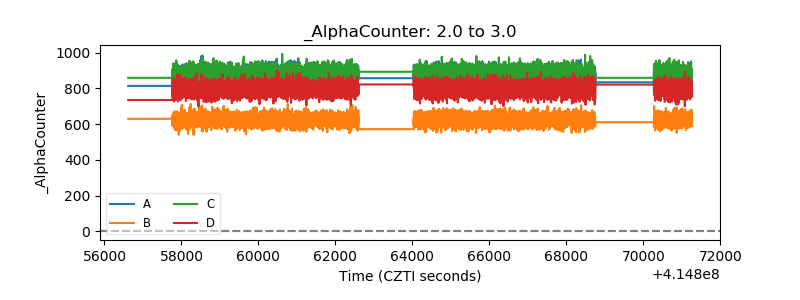 |
| _CPM_Rate | 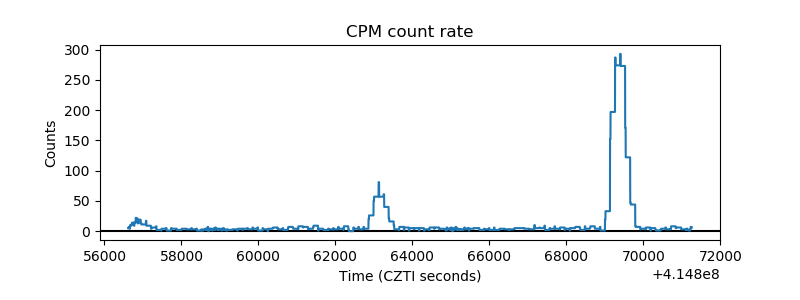 |
| CZT Counter | 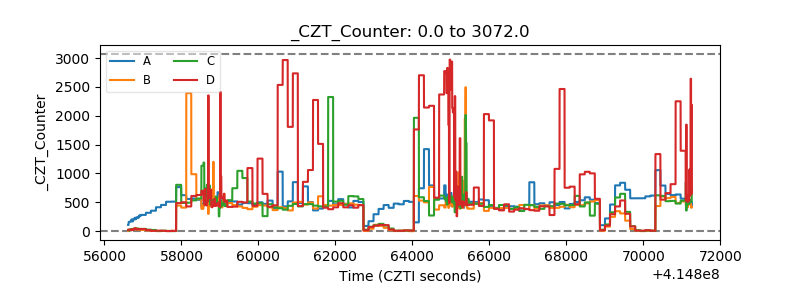 |
| +2.5 Volts monitor | 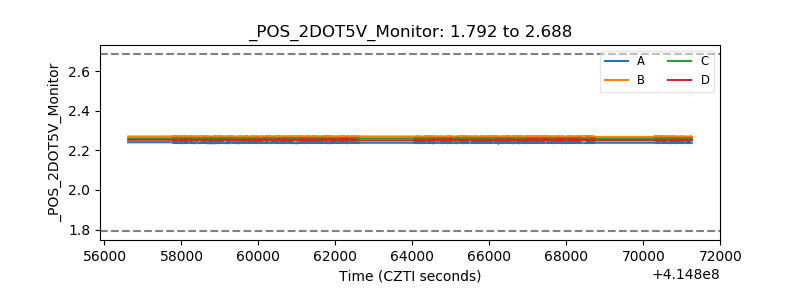 |
| +5 Volts monitor | 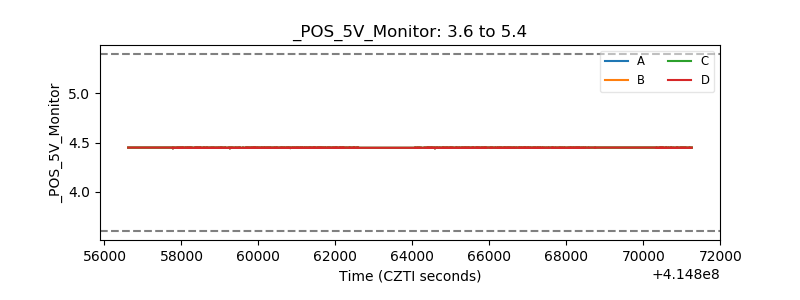 |
| _ROLL_ROT | 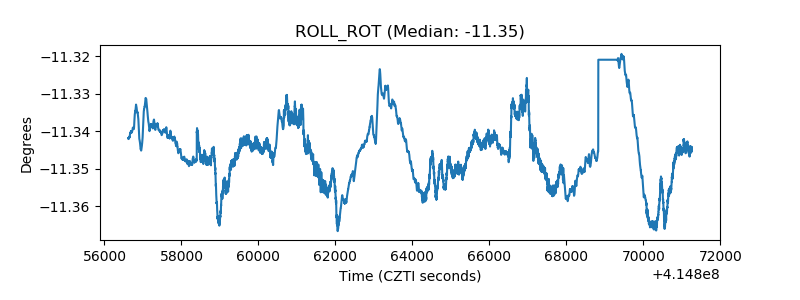 |
| _Roll_DEC | 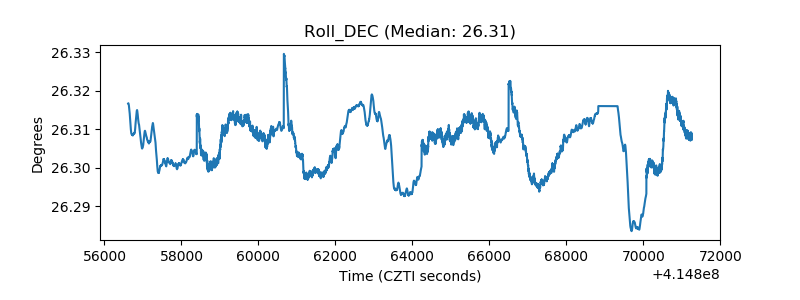 |
| _Roll_RA | 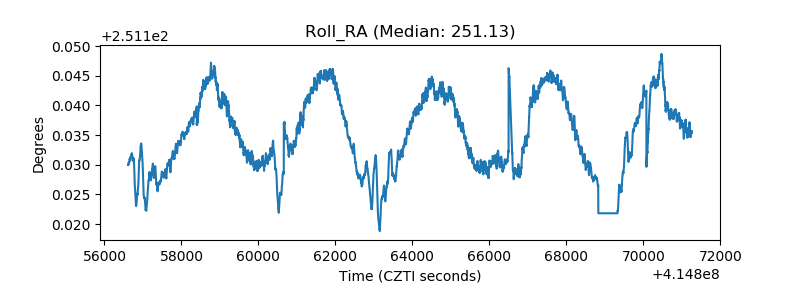 |
| Veto Counter | 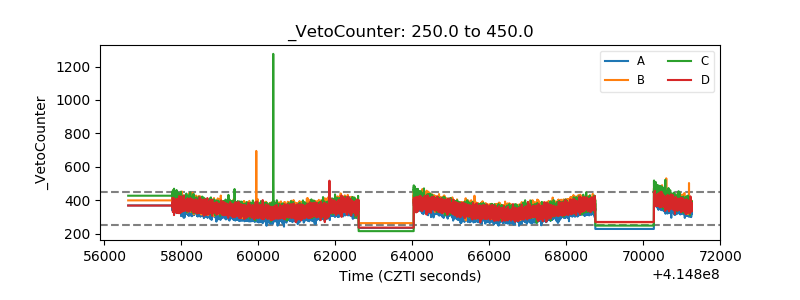 |