| Param | Original file | Final file |
|---|---|---|
| Filename | modeM0/AS1A12_054T03_9000005516_40050cztM0_level2.fits | modeM0/AS1A12_054T03_9000005516_40050cztM0_level2_quad_clean.evt |
| Size (bytes) | 380,609,280 | 92,753,280 |
| Size | 363.0 MB | 88.5 MB |
| Events in quadrant A | 2,970,226 | 628,624 |
| Events in quadrant B | 2,540,837 | 647,096 |
| Events in quadrant C | 3,401,338 | 616,357 |
| Events in quadrant D | 4,734,337 | 519,593 |
| Mode M9 | |||
|---|---|---|---|
| Quadrant | BADHDUFLAG | Total packets | Discarded packets |
| A | 0 | 32 | 0 |
| B | 0 | 32 | 0 |
| C | 0 | 32 | 0 |
| D | 0 | 32 | 0 |
| Mode SS | |||
|---|---|---|---|
| Quadrant | BADHDUFLAG | Total packets | Discarded packets |
| A | 0 | 116 | 0 |
| B | 0 | 116 | 0 |
| C | 0 | 116 | 0 |
| D | 0 | 116 | 0 |
| Mode M0 | |||
|---|---|---|---|
| Quadrant | BADHDUFLAG | Total packets | Discarded packets |
| A | 0 | 12456 | 3 |
| B | 0 | 11483 | 2 |
| C | 0 | 13822 | 2 |
| D | 0 | 18304 | 2 |
| Quadrant | Total seconds | Saturated seconds | Saturation percentage |
|---|---|---|---|
| A | 5681 | 16 | 0.281641% |
| B | 5681 | 8 | 0.140820% |
| C | 5681 | 80 | 1.408203% |
| D | 5681 | 657 | 11.564865% |
Noise dominated data is calculated using 1-second bins in cleaned event files. If a bin has >2000 counts, and if more than 50% of those come from <1% of pixels, then it is considered to be noise-dominated and hence unusable.
| Quadrant | # 1 sec bins | Bins with >0 counts | Bins with >2000 counts | High rate bins dominated by noise | Noise dominated (total time) | Noise dominated (detector-on time) | Marked lightcurve |
|---|---|---|---|---|---|---|---|
| A | 8847 | 5683 | 7 | 7 | 0.08% | 0.12% | 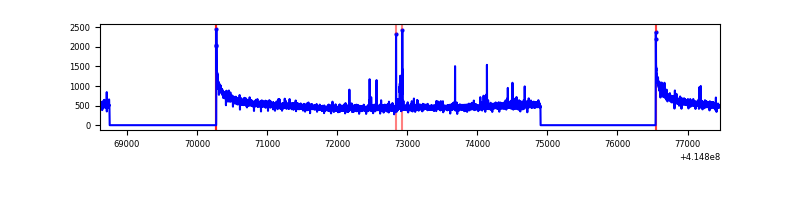 |
| B | 8847 | 5683 | 0 | 0 | 0.00% | 0.00% | 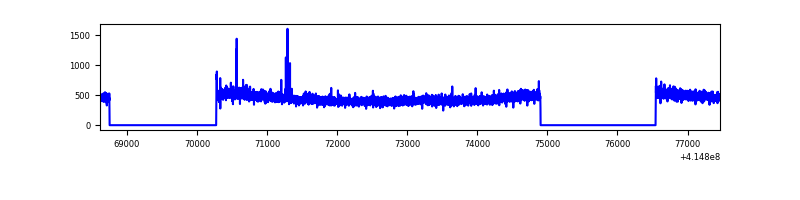 |
| C | 8847 | 5683 | 65 | 65 | 0.73% | 1.14% | 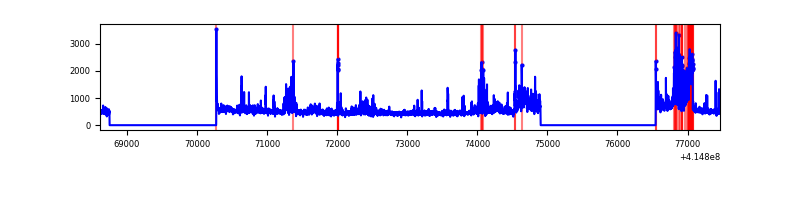 |
| D | 8847 | 5683 | 541 | 541 | 6.12% | 9.52% | 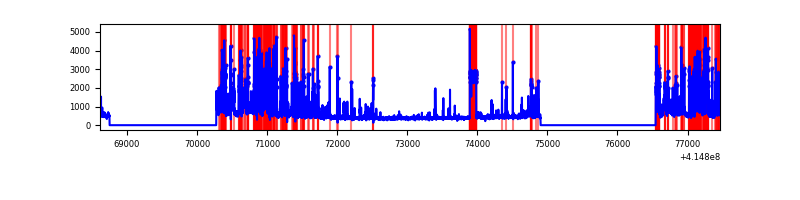 |
Top three noisy pixels from each quadrant. If the there are fewer than three noisy pixels in the level2.evt file, extra rows are filled as -1
| Pixel properties | Quadrant properties | ||||||
|---|---|---|---|---|---|---|---|
| Quadrant | DetID | PixID | Counts | Sigma | Mean | Median | Sigma |
| A | 10 | 83 | 483668 | 3739.24 | 627 | 614 | 129.2 |
| A | 6 | 10 | 31428 | 238.53 | 627 | 614 | 129.2 |
| A | 9 | 143 | 23123 | 174.24 | 627 | 614 | 129.2 |
| B | 4 | 171 | 26036 | 208.76 | 626 | 606 | 121.8 |
| B | 0 | 230 | 22063 | 176.15 | 626 | 606 | 121.8 |
| B | 0 | 221 | 17753 | 140.76 | 626 | 606 | 121.8 |
| C | 9 | 187 | 659095 | 4523.34 | 616 | 620 | 145.6 |
| C | 15 | 214 | 233263 | 1598.12 | 616 | 620 | 145.6 |
| C | 14 | 254 | 77027 | 524.87 | 616 | 620 | 145.6 |
| D | 12 | 227 | 845544 | 5978.88 | 578 | 560 | 141.3 |
| D | 13 | 249 | 707213 | 5000.08 | 578 | 560 | 141.3 |
| D | 2 | 250 | 401194 | 2834.78 | 578 | 560 | 141.3 |
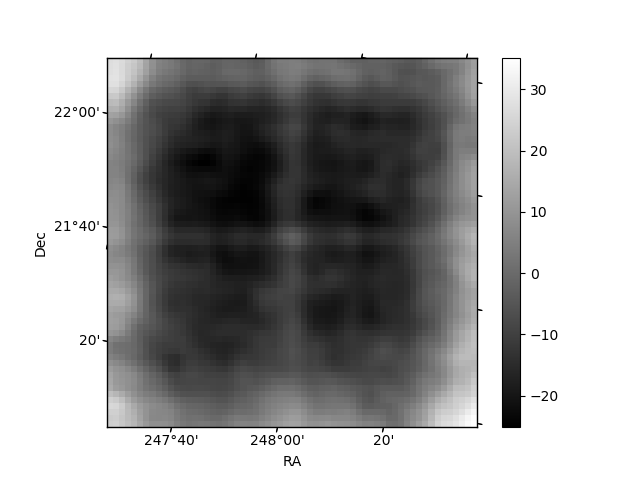
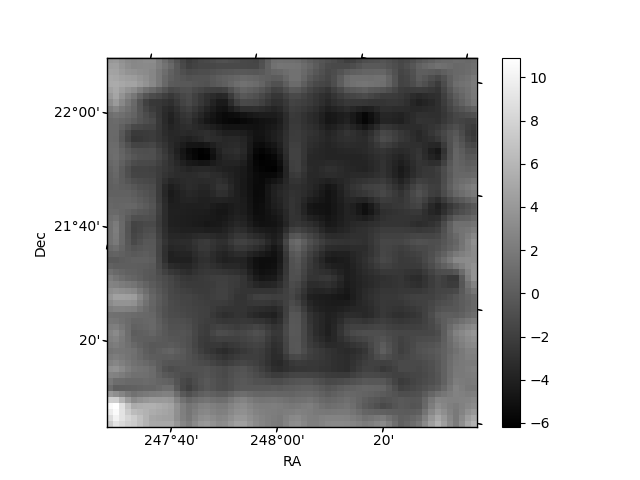
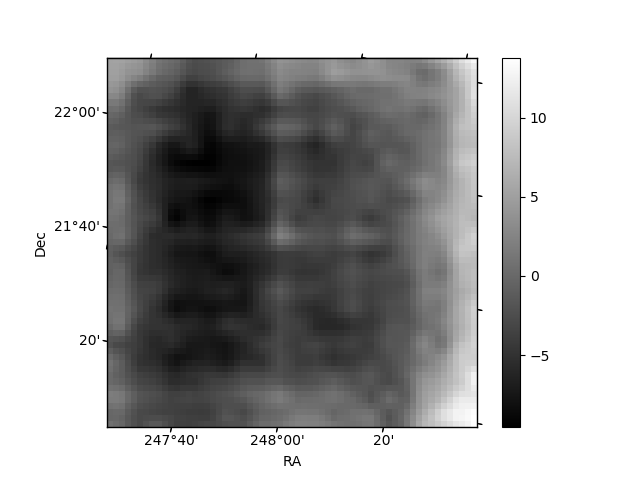
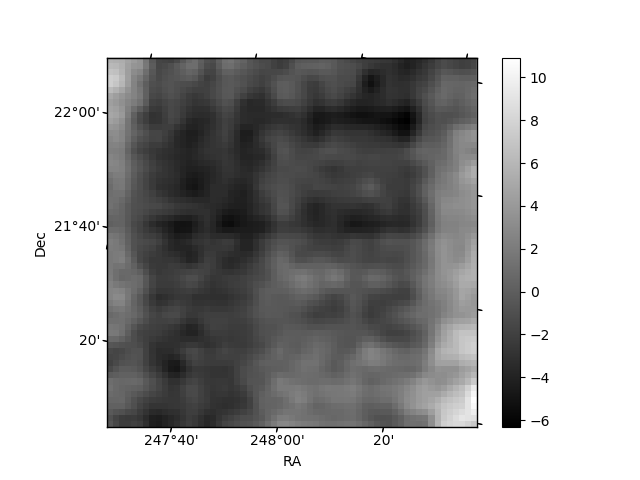
Histogram calculated using DETX and DETY for each event in the final _common_clean file
| Quadrant A | 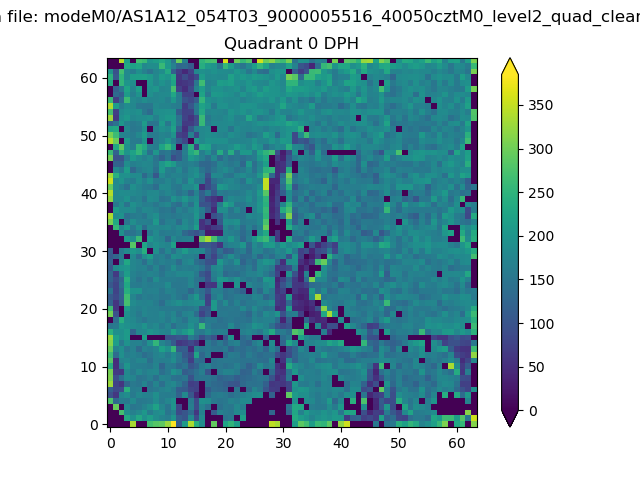 |
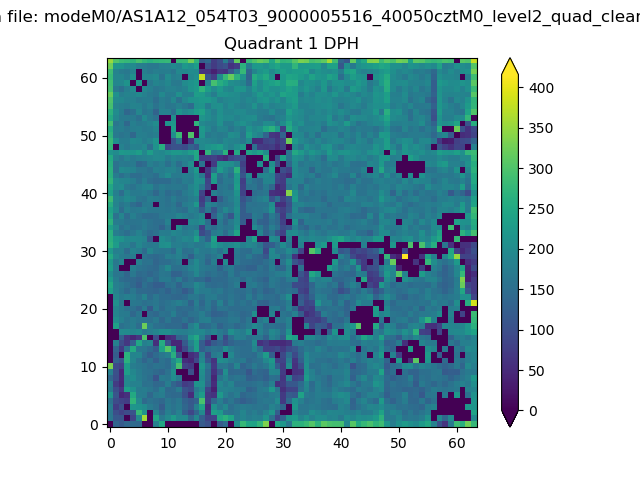 |
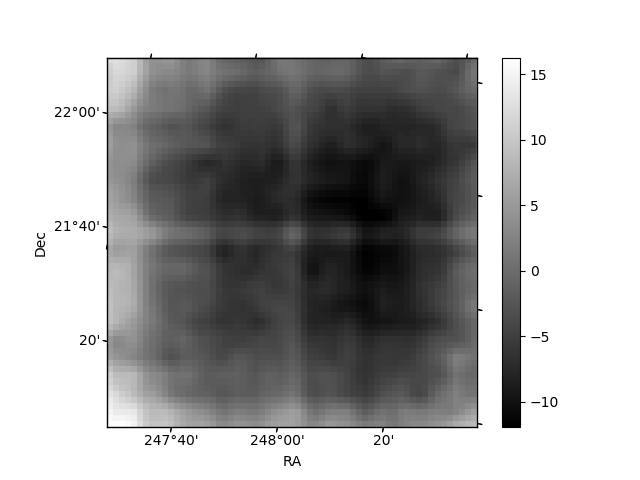
Quadrant B |
|---|---|---|---|
| Quadrant D | 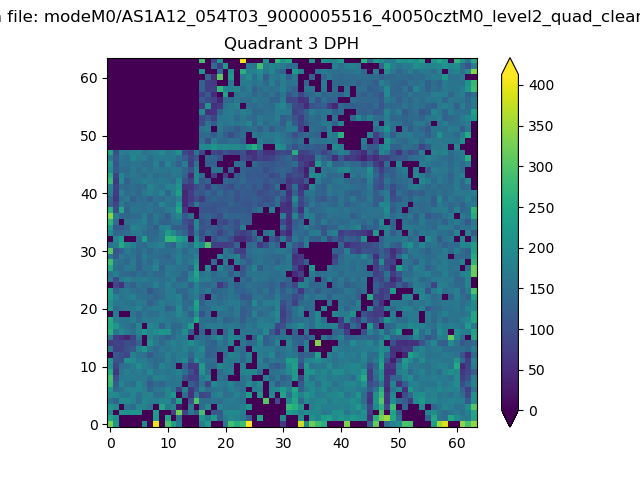 |
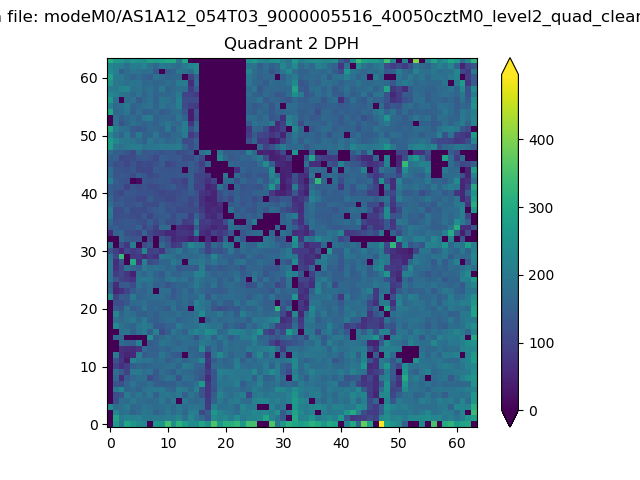 |
Quadrant C |
| Plot type | Count rate plots | Images |
|---|---|---|
| Comparison with Poisson distribution Blue bars denote a histogram of data divided into 1 sec bins. Red curve is a Poisson curve with rate = median count rate of data. |
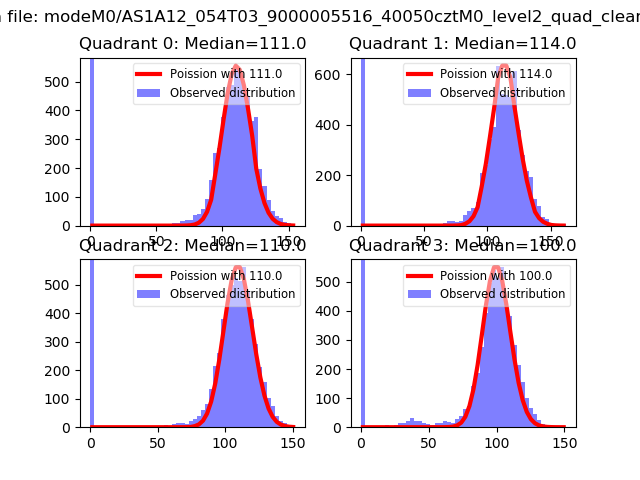 |
 |
| Quadrant-wise count rates Data is divided into 100 sec bins |
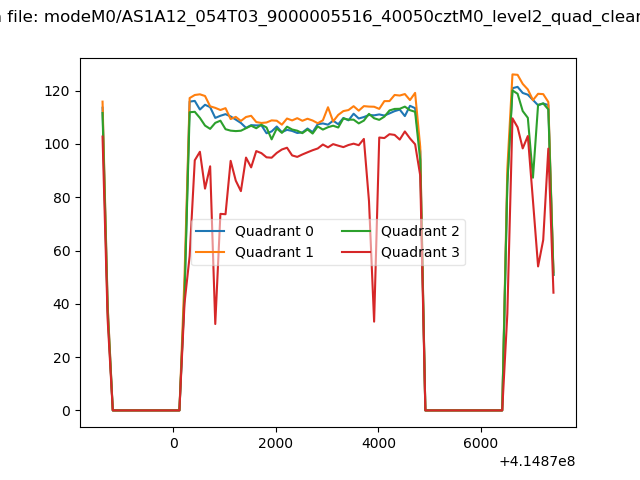 |
|
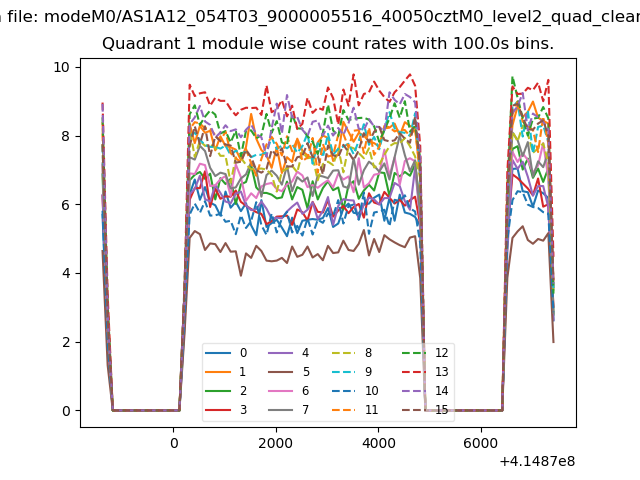
| Module-wise count rates for Quadrant A Data is divided into 100 sec bins |
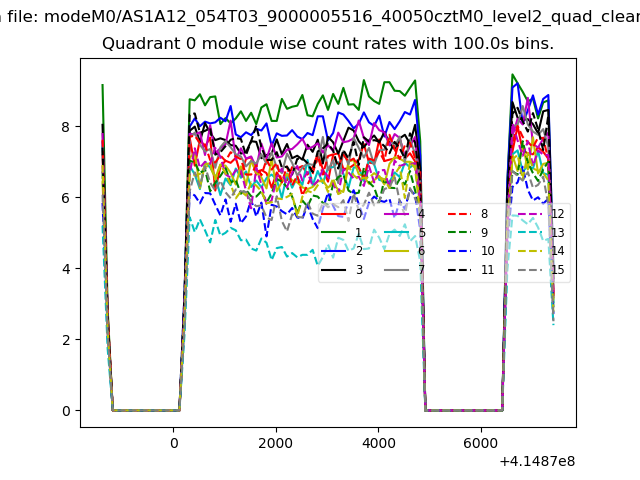 |
 |
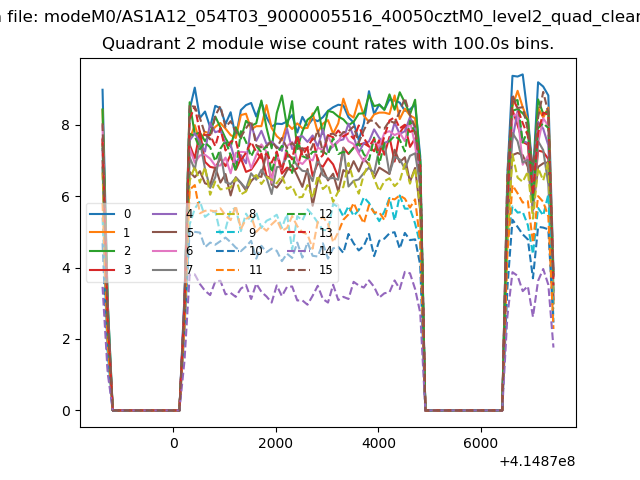
| Module-wise count rates for Quadrant B Data is divided into 100 sec bins |
 |
 |
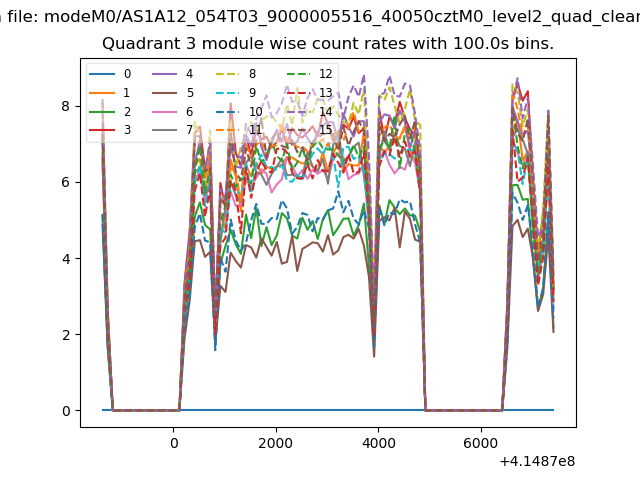
| Module-wise count rates for Quadrant C Data is divided into 100 sec bins |
 |
 |
| Module-wise count rates for Quadrant D Data is divided into 100 sec bins |
 |
 |
| Parameter | Plot |
|---|---|
| CZT HV Monitor | 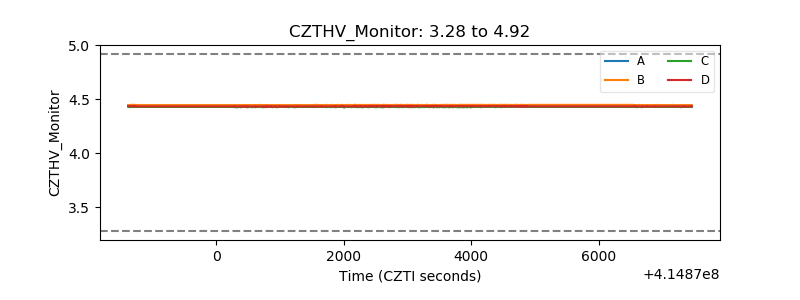 |
| D_VDD | 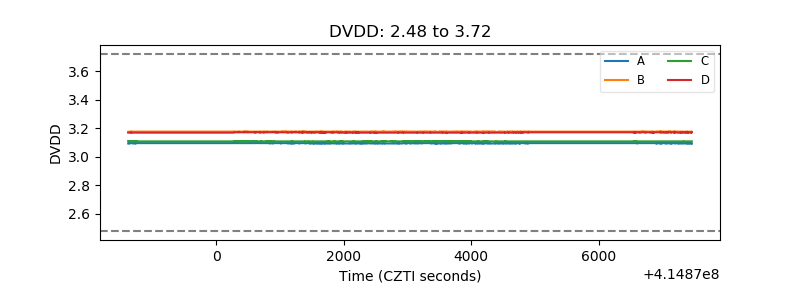 |
| Temperature 1 | 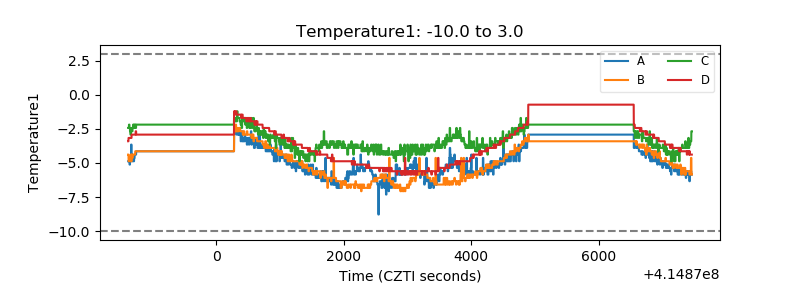 |
| Veto HV Monitor | 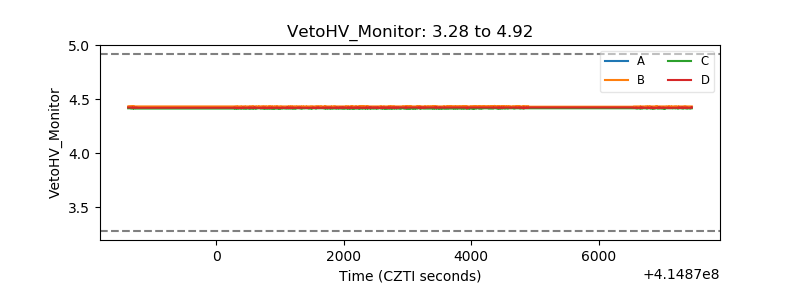 |
| Veto LLD | 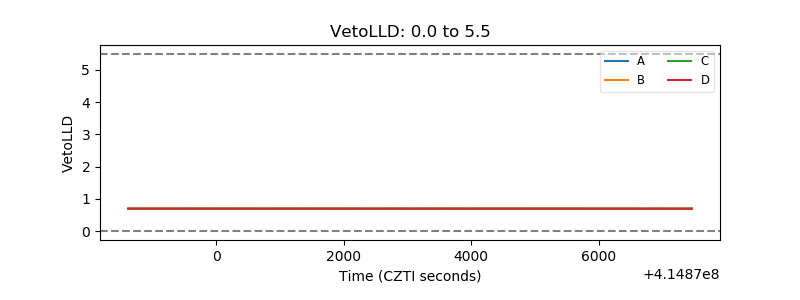 |
| Alpha Counter |  |
| _CPM_Rate | 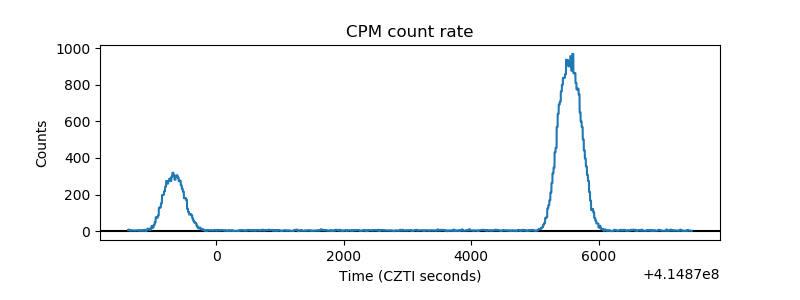 |
| CZT Counter | 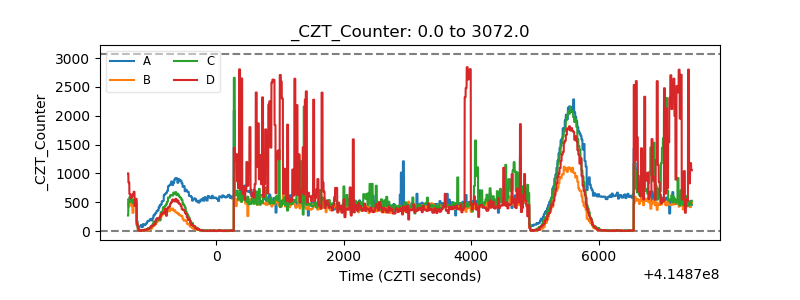 |
| +2.5 Volts monitor | 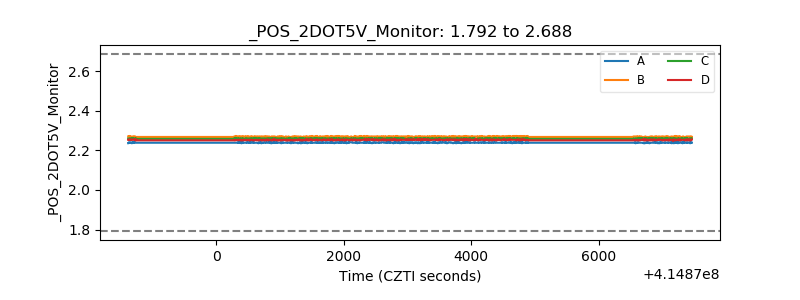 |
| +5 Volts monitor | 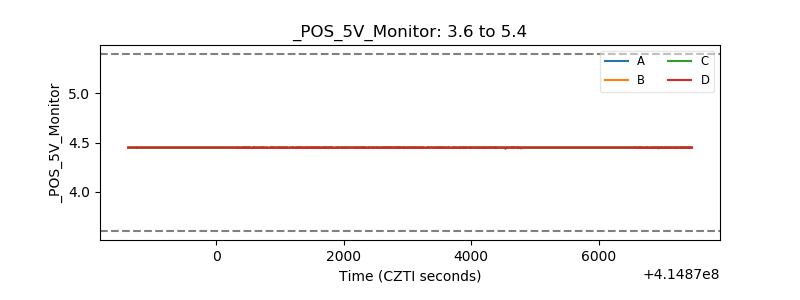 |
| _ROLL_ROT | 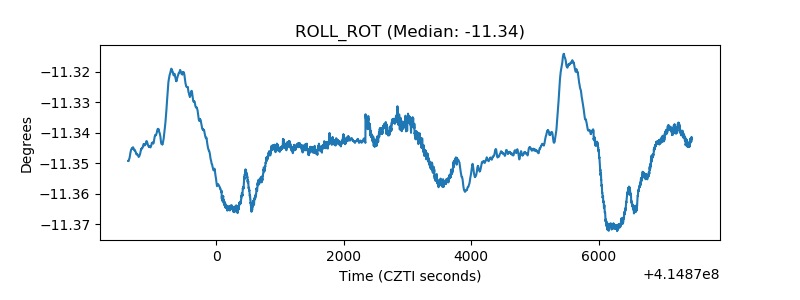 |
| _Roll_DEC | 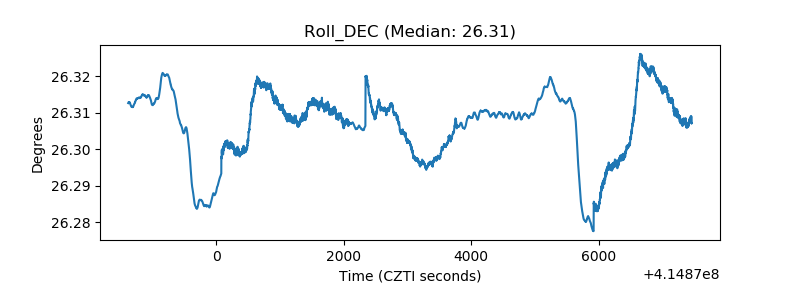 |
| _Roll_RA | 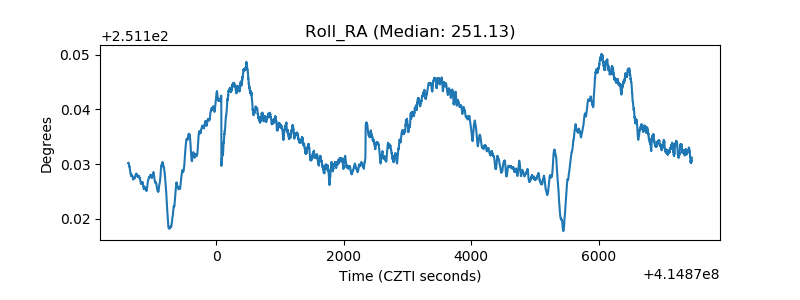 |
| Veto Counter | 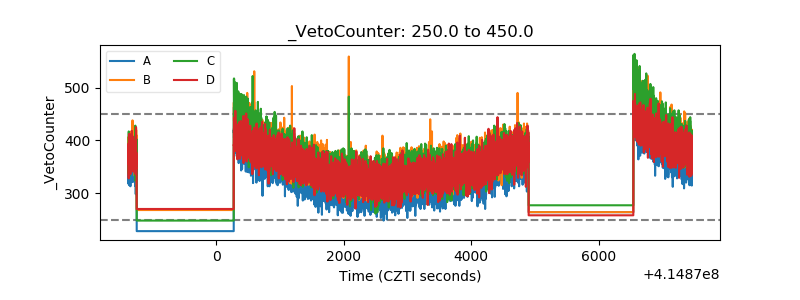 |