| Param | Original file | Final file |
|---|---|---|
| Filename | modeM0/AS1A12_054T03_9000005516_40052cztM0_level2.fits | modeM0/AS1A12_054T03_9000005516_40052cztM0_level2_quad_clean.evt |
| Size (bytes) | 387,673,920 | 89,277,120 |
| Size | 369.7 MB | 85.1 MB |
| Events in quadrant A | 3,158,035 | 591,051 |
| Events in quadrant B | 2,374,395 | 631,052 |
| Events in quadrant C | 3,369,145 | 597,908 |
| Events in quadrant D | 5,032,562 | 508,971 |
| Mode M9 | |||
|---|---|---|---|
| Quadrant | BADHDUFLAG | Total packets | Discarded packets |
| A | 0 | 35 | 0 |
| B | 0 | 35 | 0 |
| C | 0 | 35 | 0 |
| D | 0 | 35 | 0 |
| Mode SS | |||
|---|---|---|---|
| Quadrant | BADHDUFLAG | Total packets | Discarded packets |
| A | 0 | 110 | 0 |
| B | 0 | 110 | 0 |
| C | 0 | 110 | 0 |
| D | 0 | 110 | 0 |
| Mode M0 | |||
|---|---|---|---|
| Quadrant | BADHDUFLAG | Total packets | Discarded packets |
| A | 0 | 12753 | 2 |
| B | 0 | 10751 | 1 |
| C | 0 | 13610 | 1 |
| D | 0 | 18815 | 1 |
| Quadrant | Total seconds | Saturated seconds | Saturation percentage |
|---|---|---|---|
| A | 5349 | 191 | 3.570761% |
| B | 5349 | 7 | 0.130866% |
| C | 5349 | 151 | 2.822958% |
| D | 5349 | 582 | 10.880538% |
Noise dominated data is calculated using 1-second bins in cleaned event files. If a bin has >2000 counts, and if more than 50% of those come from <1% of pixels, then it is considered to be noise-dominated and hence unusable.
| Quadrant | # 1 sec bins | Bins with >0 counts | Bins with >2000 counts | High rate bins dominated by noise | Noise dominated (total time) | Noise dominated (detector-on time) | Marked lightcurve |
|---|---|---|---|---|---|---|---|
| A | 8785 | 5351 | 127 | 127 | 1.45% | 2.37% | 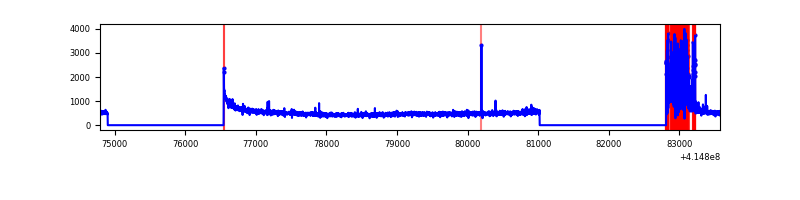 |
| B | 8785 | 5351 | 0 | 0 | 0.00% | 0.00% | 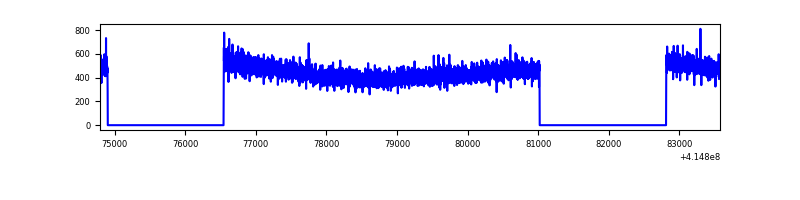 |
| C | 8785 | 5351 | 117 | 117 | 1.33% | 2.19% | 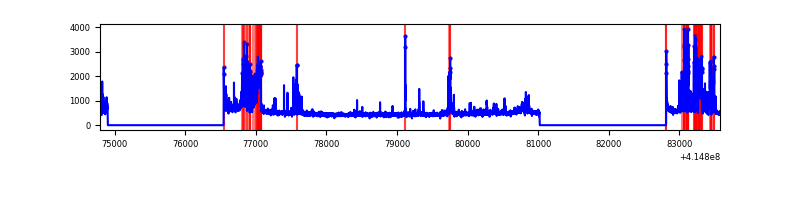 |
| D | 8785 | 5351 | 532 | 532 | 6.06% | 9.94% |  |
Top three noisy pixels from each quadrant. If the there are fewer than three noisy pixels in the level2.evt file, extra rows are filled as -1
| Pixel properties | Quadrant properties | ||||||
|---|---|---|---|---|---|---|---|
| Quadrant | DetID | PixID | Counts | Sigma | Mean | Median | Sigma |
| A | 10 | 83 | 439620 | 3684.77 | 585 | 574 | 119.2 |
| A | 13 | 248 | 402073 | 3369.65 | 585 | 574 | 119.2 |
| A | 9 | 143 | 27518 | 226.13 | 585 | 574 | 119.2 |
| B | 0 | 230 | 17569 | 145.95 | 595 | 578 | 116.4 |
| B | 12 | 111 | 14614 | 120.57 | 595 | 578 | 116.4 |
| B | 11 | 111 | 13275 | 109.07 | 595 | 578 | 116.4 |
| C | 9 | 187 | 778363 | 5645.76 | 583 | 586 | 137.8 |
| C | 15 | 214 | 222215 | 1608.77 | 583 | 586 | 137.8 |
| C | 14 | 254 | 65973 | 474.63 | 583 | 586 | 137.8 |
| D | 12 | 227 | 1851560 | 13678.34 | 553 | 537 | 135.3 |
| D | 2 | 250 | 356352 | 2629.33 | 553 | 537 | 135.3 |
| D | 1 | 47 | 310304 | 2289.06 | 553 | 537 | 135.3 |
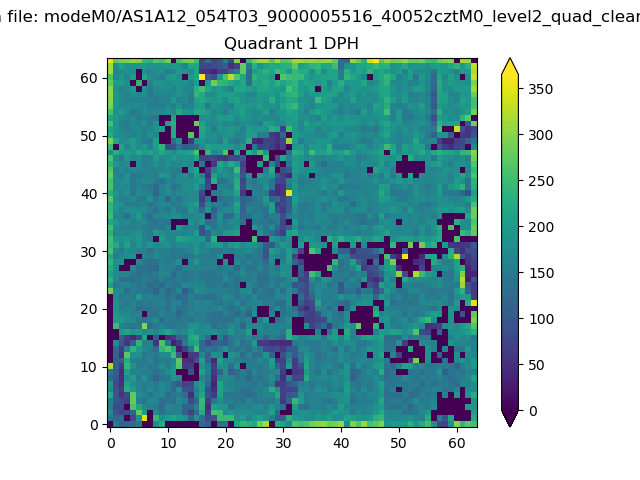
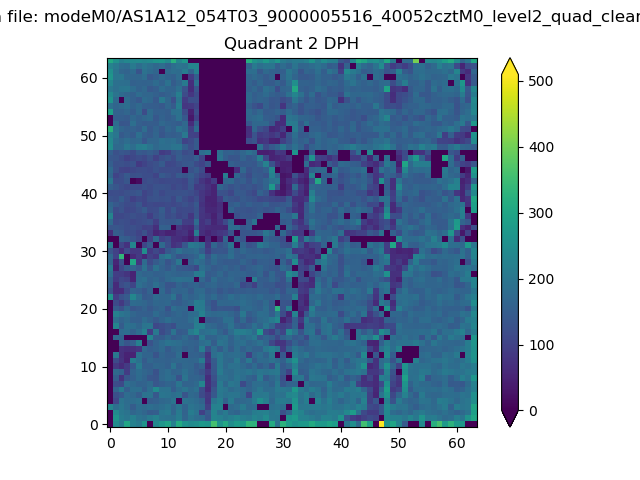
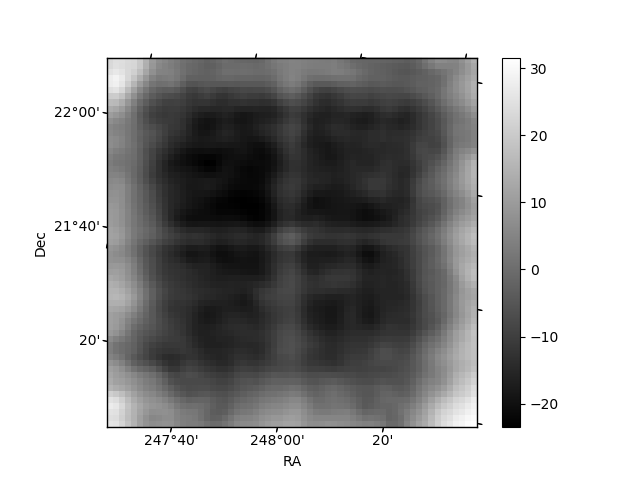
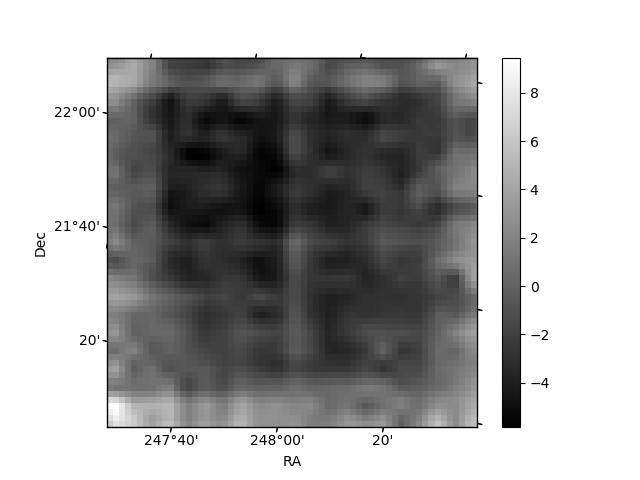
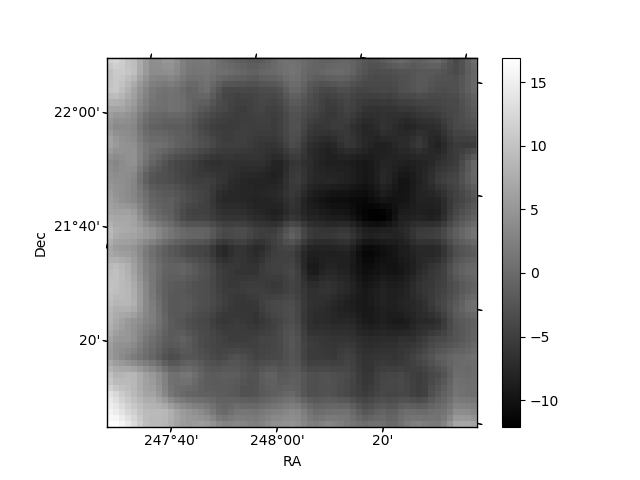
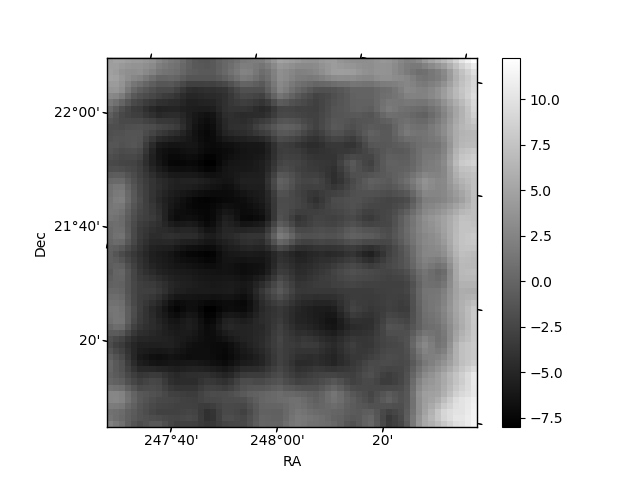
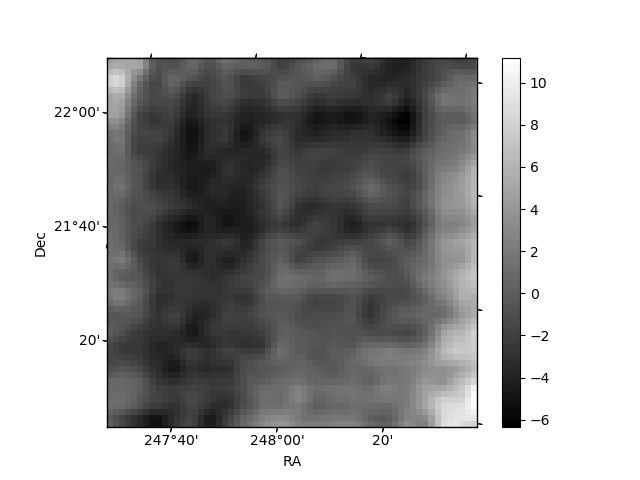
Histogram calculated using DETX and DETY for each event in the final _common_clean file
| Quadrant A | 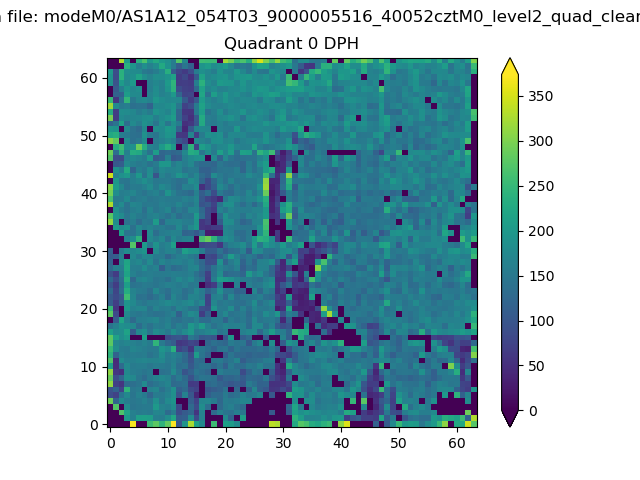 |
 |
Quadrant B |
|---|---|---|---|
| Quadrant D | 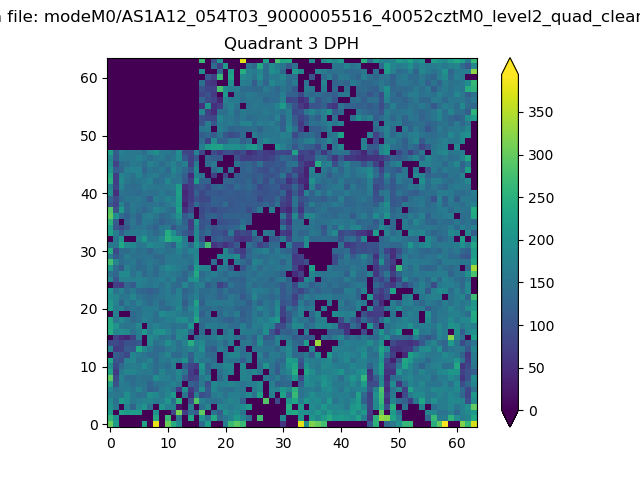 |
 |
Quadrant C |
| Plot type | Count rate plots | Images |
|---|---|---|
| Comparison with Poisson distribution Blue bars denote a histogram of data divided into 1 sec bins. Red curve is a Poisson curve with rate = median count rate of data. |
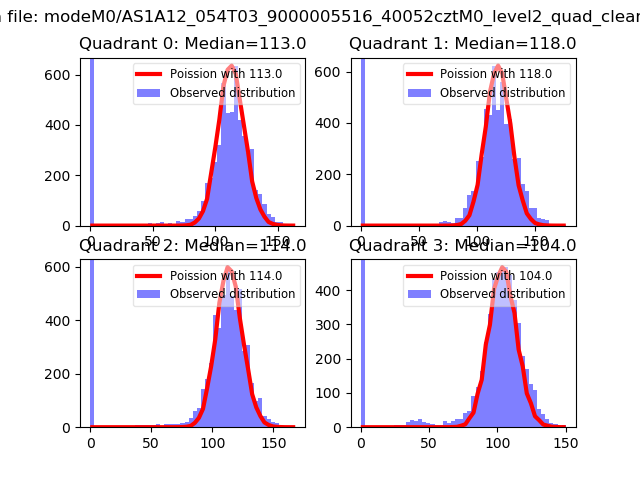 |
 |
| Quadrant-wise count rates Data is divided into 100 sec bins |
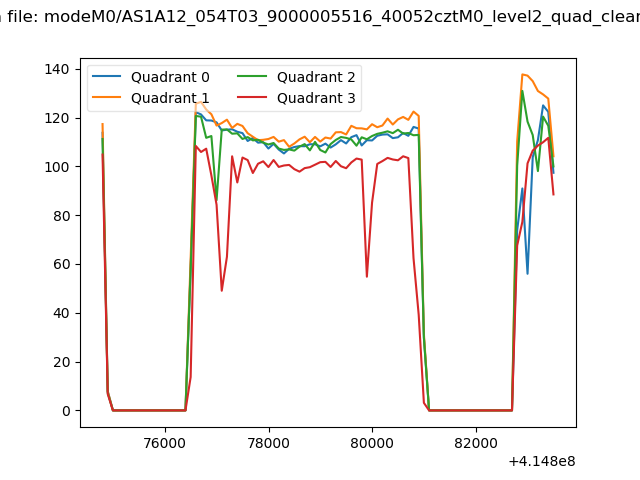 |
|
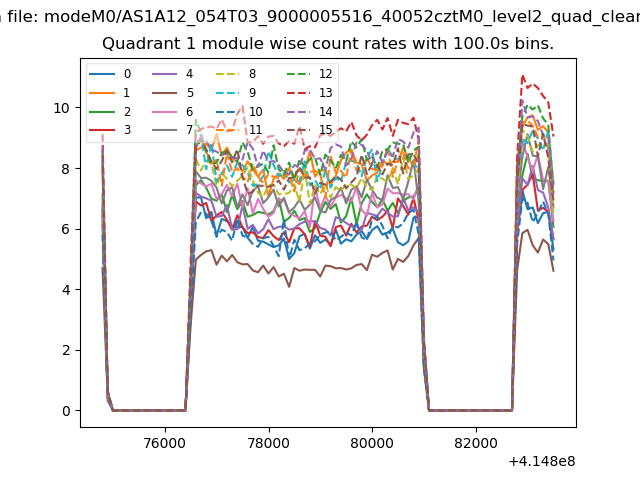
| Module-wise count rates for Quadrant A Data is divided into 100 sec bins |
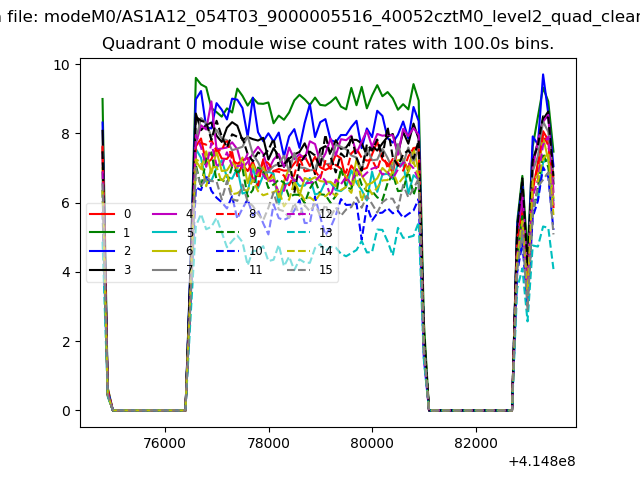 |
 |
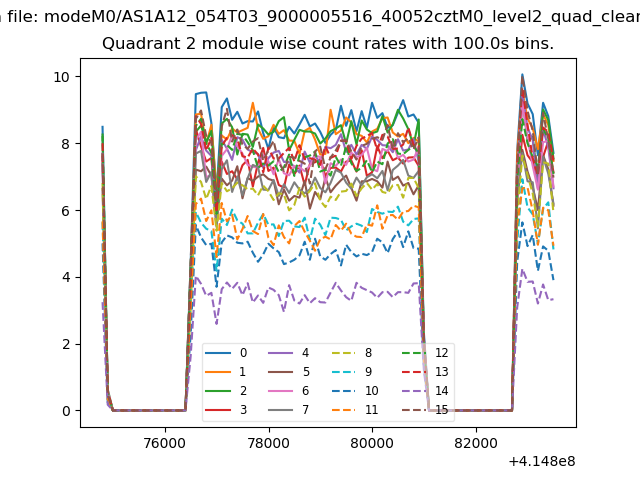
| Module-wise count rates for Quadrant B Data is divided into 100 sec bins |
 |
 |
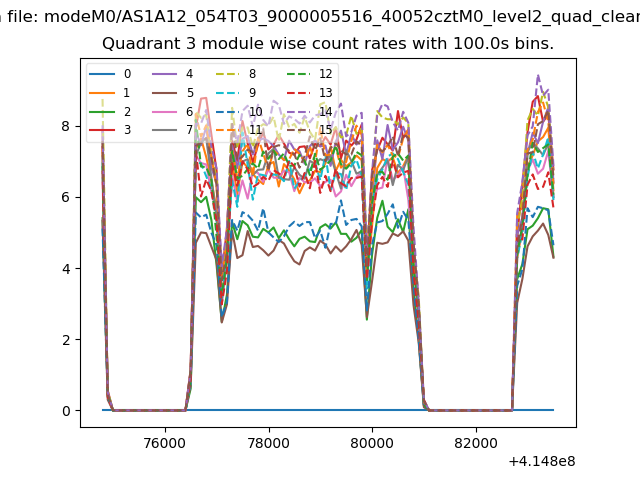
| Module-wise count rates for Quadrant C Data is divided into 100 sec bins |
 |
 |
| Module-wise count rates for Quadrant D Data is divided into 100 sec bins |
 |
 |
| Parameter | Plot |
|---|---|
| CZT HV Monitor | 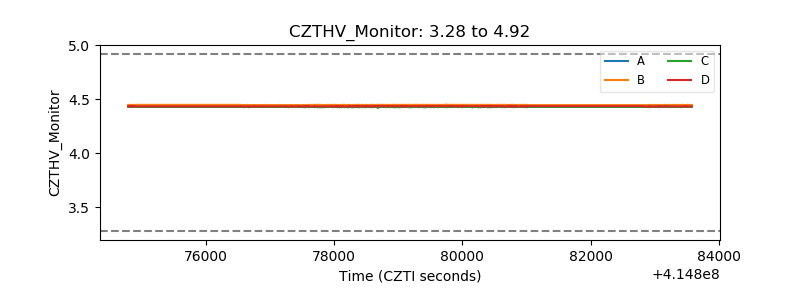 |
| D_VDD | 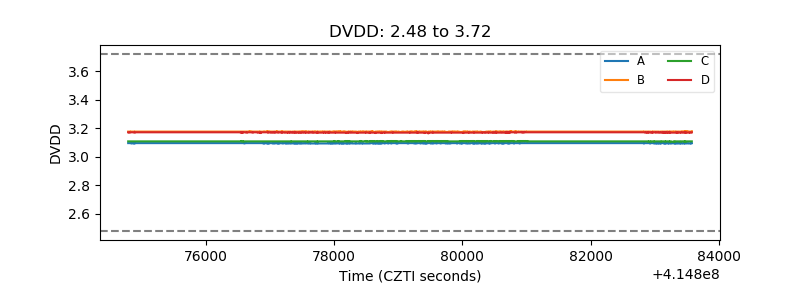 |
| Temperature 1 | 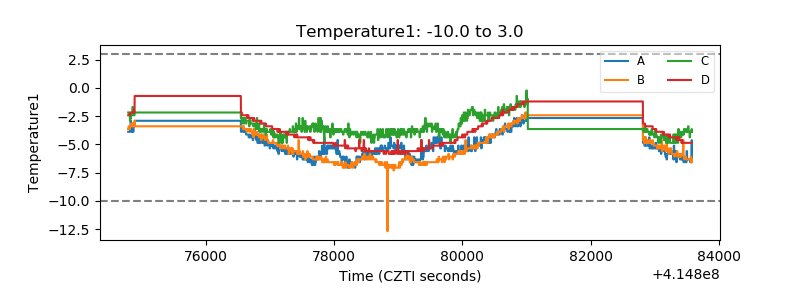 |
| Veto HV Monitor | 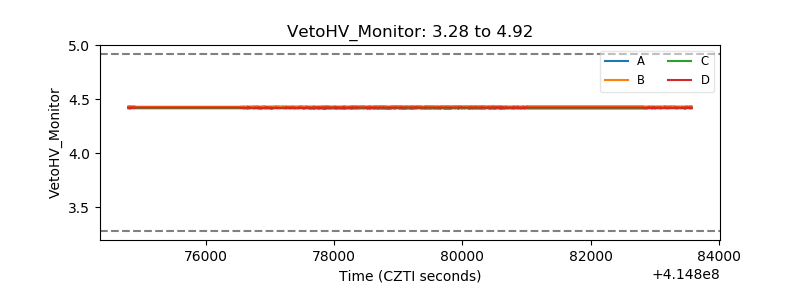 |
| Veto LLD | 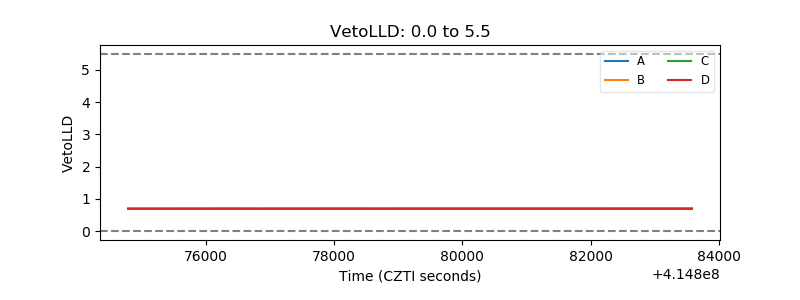 |
| Alpha Counter | 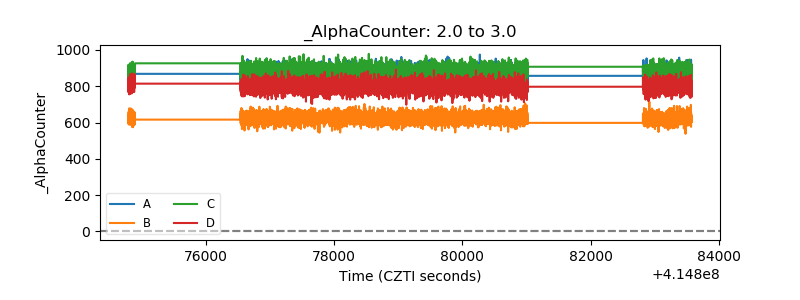 |
| _CPM_Rate | 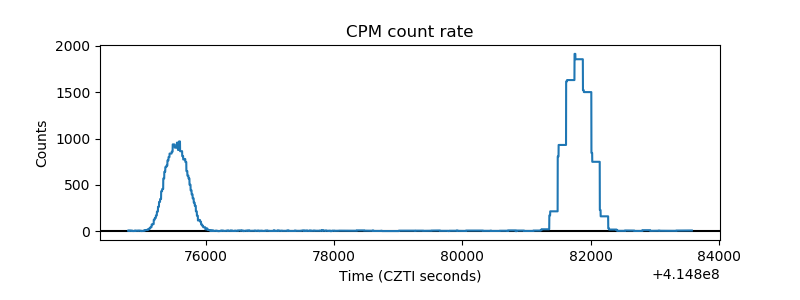 |
| CZT Counter | 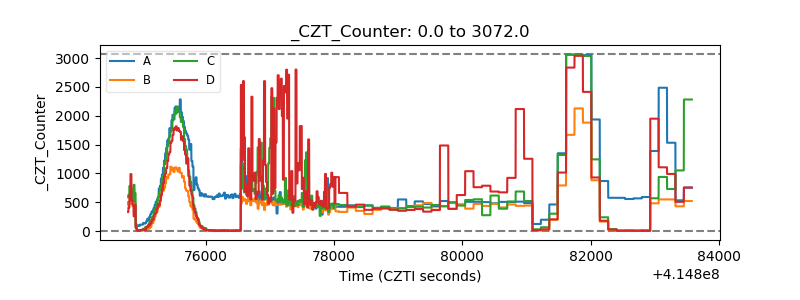 |
| +2.5 Volts monitor | 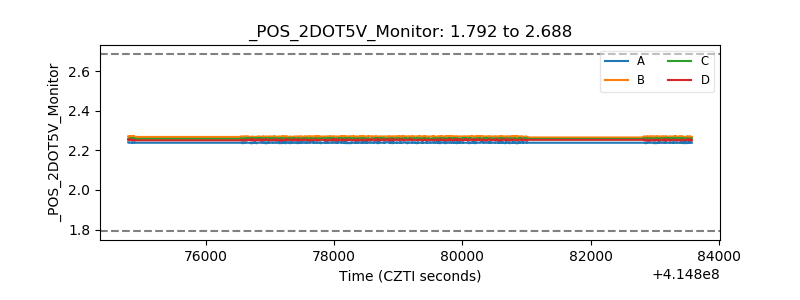 |
| +5 Volts monitor | 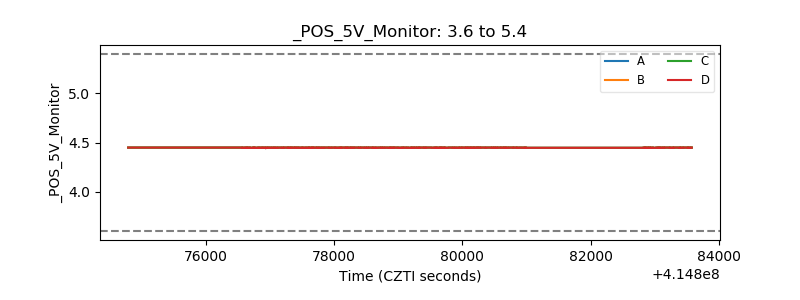 |
| _ROLL_ROT | 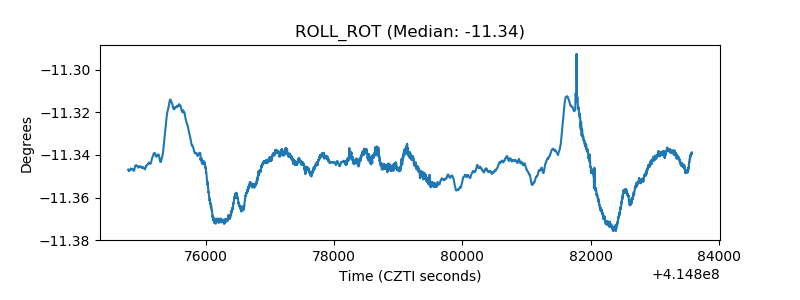 |
| _Roll_DEC | 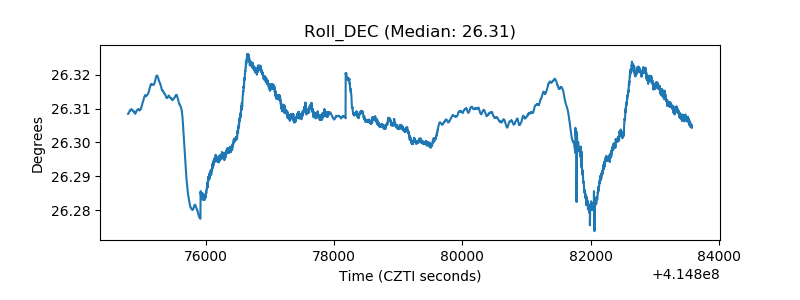 |
| _Roll_RA | 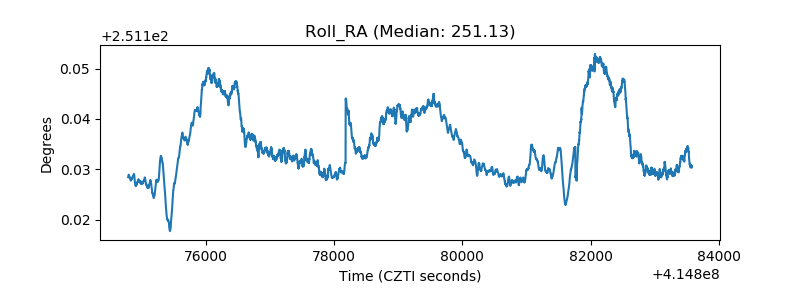 |
| Veto Counter | 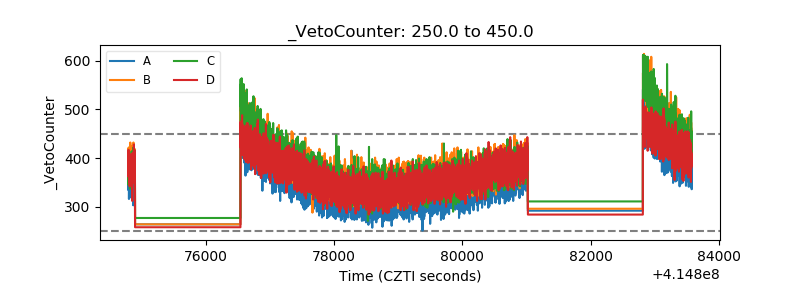 |