| Param | Original file | Final file |
|---|---|---|
| Filename | modeM0/AS1A12_054T03_9000005516_40053cztM0_level2.fits | modeM0/AS1A12_054T03_9000005516_40053cztM0_level2_quad_clean.evt |
| Size (bytes) | 373,688,640 | 93,427,200 |
| Size | 356.4 MB | 89.1 MB |
| Events in quadrant A | 3,201,720 | 617,727 |
| Events in quadrant B | 2,427,342 | 665,069 |
| Events in quadrant C | 4,064,119 | 614,648 |
| Events in quadrant D | 3,723,828 | 557,848 |
| Mode M9 | |||
|---|---|---|---|
| Quadrant | BADHDUFLAG | Total packets | Discarded packets |
| A | 0 | 37 | 0 |
| B | 0 | 37 | 0 |
| C | 0 | 37 | 0 |
| D | 0 | 37 | 0 |
| Mode SS | |||
|---|---|---|---|
| Quadrant | BADHDUFLAG | Total packets | Discarded packets |
| A | 0 | 110 | 0 |
| B | 0 | 110 | 0 |
| C | 0 | 110 | 0 |
| D | 0 | 110 | 0 |
| Mode M0 | |||
|---|---|---|---|
| Quadrant | BADHDUFLAG | Total packets | Discarded packets |
| A | 0 | 12818 | 2 |
| B | 0 | 10778 | 1 |
| C | 0 | 15655 | 1 |
| D | 0 | 14904 | 1 |
| Quadrant | Total seconds | Saturated seconds | Saturation percentage |
|---|---|---|---|
| A | 5341 | 192 | 3.594832% |
| B | 5341 | 7 | 0.131062% |
| C | 5341 | 252 | 4.718218% |
| D | 5341 | 275 | 5.148849% |
Noise dominated data is calculated using 1-second bins in cleaned event files. If a bin has >2000 counts, and if more than 50% of those come from <1% of pixels, then it is considered to be noise-dominated and hence unusable.
| Quadrant | # 1 sec bins | Bins with >0 counts | Bins with >2000 counts | High rate bins dominated by noise | Noise dominated (total time) | Noise dominated (detector-on time) | Marked lightcurve |
|---|---|---|---|---|---|---|---|
| A | 9047 | 5343 | 129 | 129 | 1.43% | 2.41% | 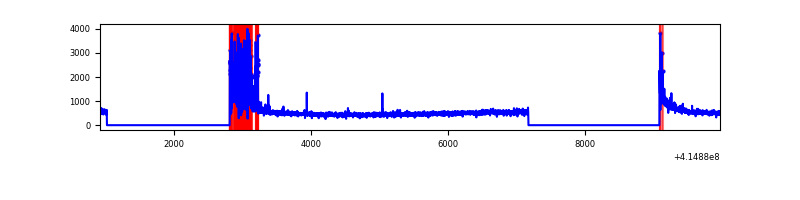 |
| B | 9047 | 5343 | 0 | 0 | 0.00% | 0.00% | 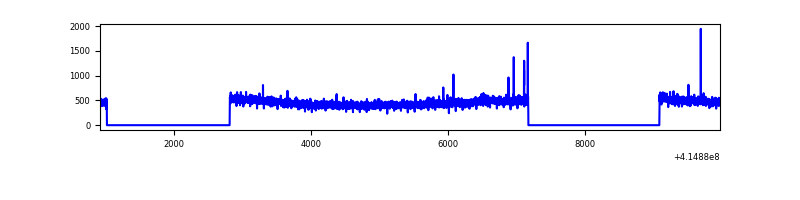 |
| C | 9047 | 5343 | 209 | 209 | 2.31% | 3.91% | 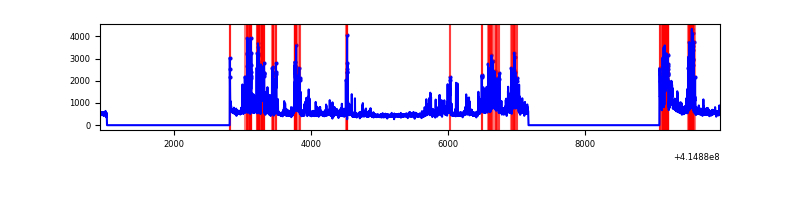 |
| D | 9047 | 5343 | 271 | 271 | 3.00% | 5.07% | 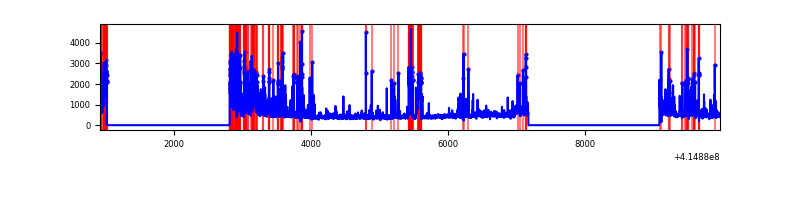 |
Top three noisy pixels from each quadrant. If the there are fewer than three noisy pixels in the level2.evt file, extra rows are filled as -1
| Pixel properties | Quadrant properties | ||||||
|---|---|---|---|---|---|---|---|
| Quadrant | DetID | PixID | Counts | Sigma | Mean | Median | Sigma |
| A | 13 | 248 | 433583 | 3598.42 | 592 | 582 | 120.3 |
| A | 10 | 83 | 431666 | 3582.49 | 592 | 582 | 120.3 |
| A | 9 | 143 | 24849 | 201.67 | 592 | 582 | 120.3 |
| B | 0 | 230 | 31738 | 265.26 | 606 | 589 | 117.4 |
| B | 12 | 111 | 14525 | 118.68 | 606 | 589 | 117.4 |
| B | 11 | 111 | 13249 | 107.81 | 606 | 589 | 117.4 |
| C | 9 | 187 | 1493972 | 10898.44 | 586 | 592 | 137.0 |
| C | 15 | 214 | 217923 | 1586.05 | 586 | 592 | 137.0 |
| C | 14 | 254 | 32165 | 230.41 | 586 | 592 | 137.0 |
| D | 12 | 227 | 761900 | 5405.73 | 576 | 560 | 140.8 |
| D | 13 | 249 | 364555 | 2584.47 | 576 | 560 | 140.8 |
| D | 2 | 250 | 195417 | 1383.54 | 576 | 560 | 140.8 |
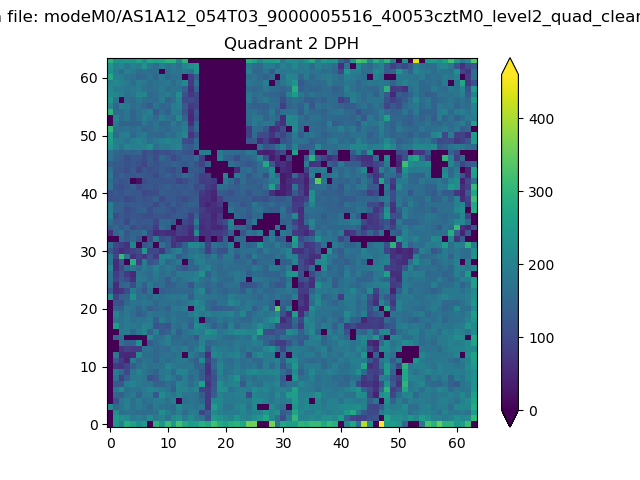
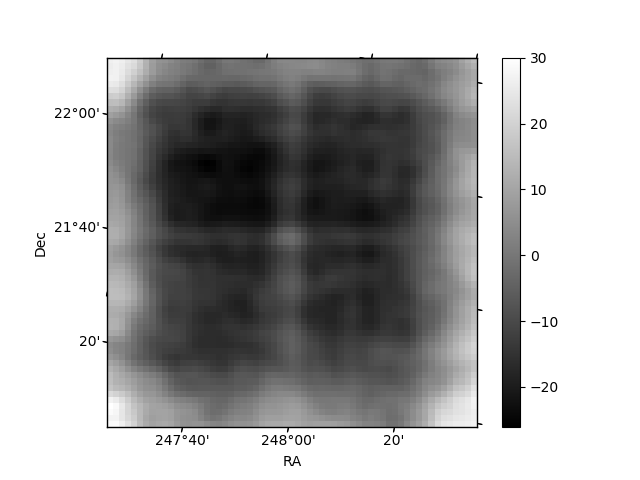
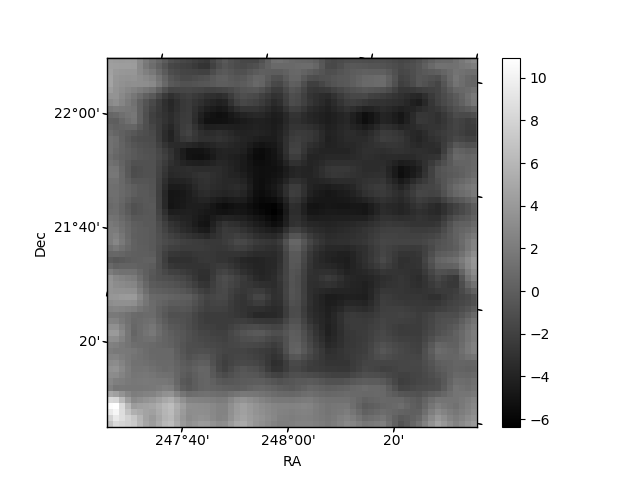
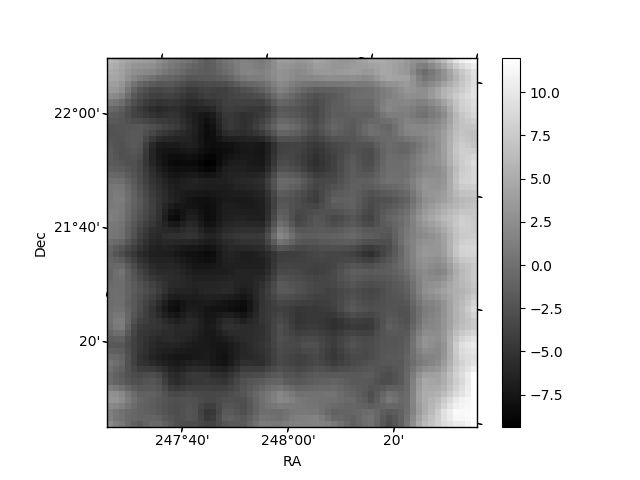
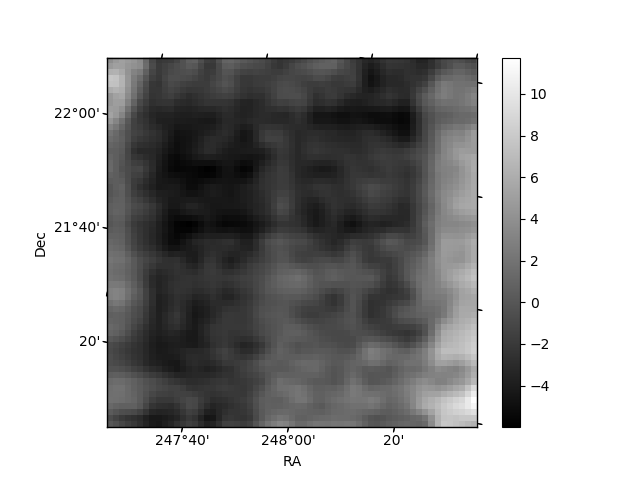
Histogram calculated using DETX and DETY for each event in the final _common_clean file
| Quadrant A | 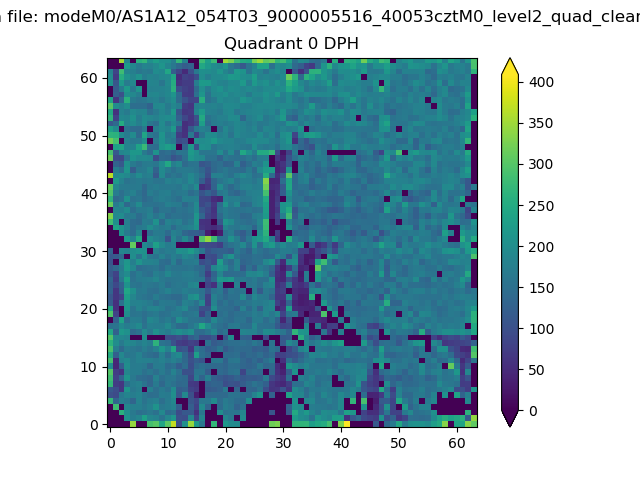 |
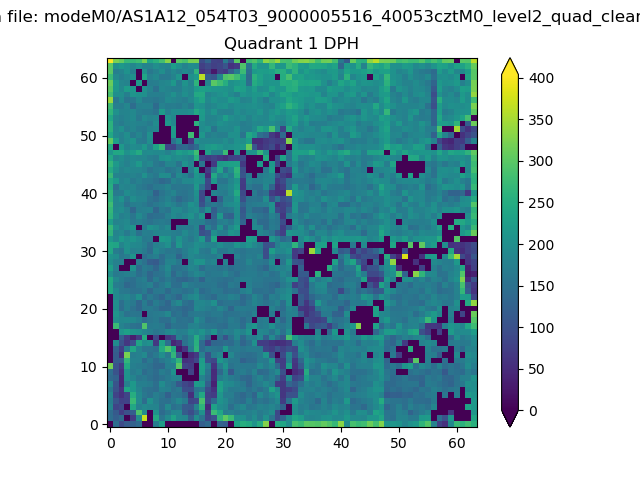 |
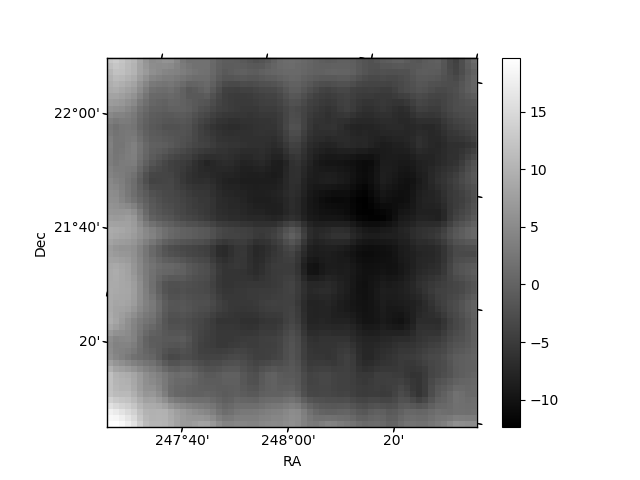
Quadrant B |
|---|---|---|---|
| Quadrant D | 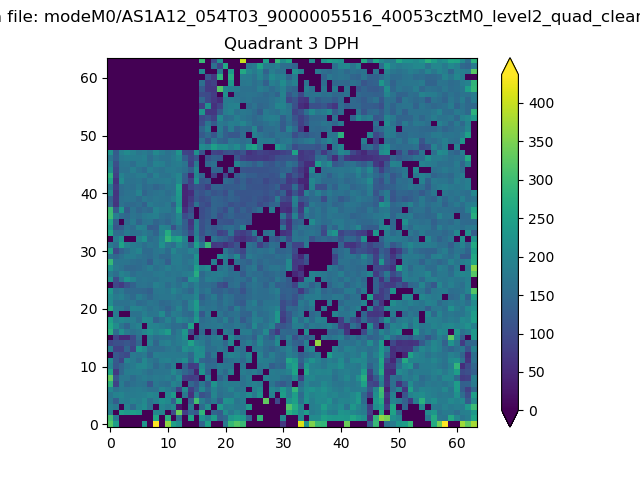 |
 |
Quadrant C |
| Plot type | Count rate plots | Images |
|---|---|---|
| Comparison with Poisson distribution Blue bars denote a histogram of data divided into 1 sec bins. Red curve is a Poisson curve with rate = median count rate of data. |
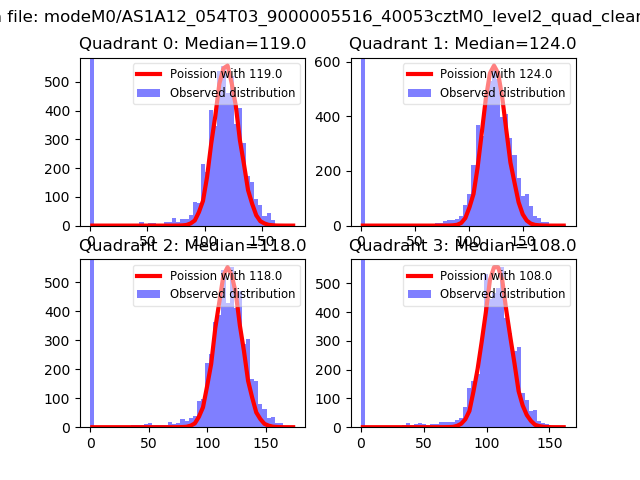 |
 |
| Quadrant-wise count rates Data is divided into 100 sec bins |
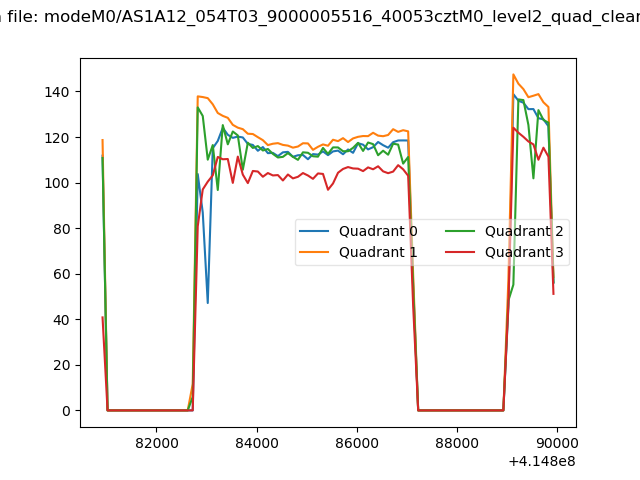 |
|
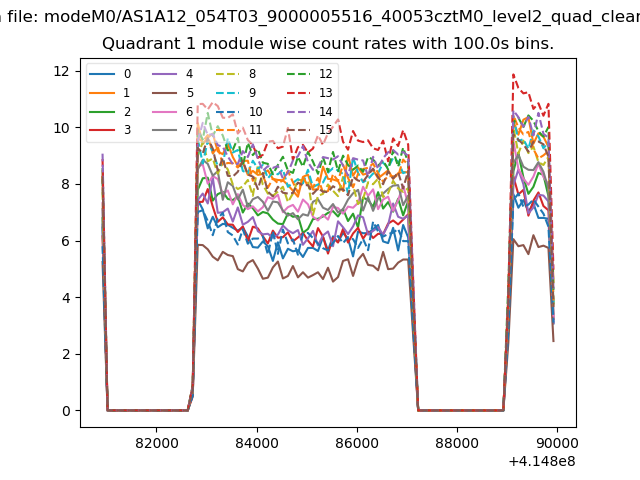
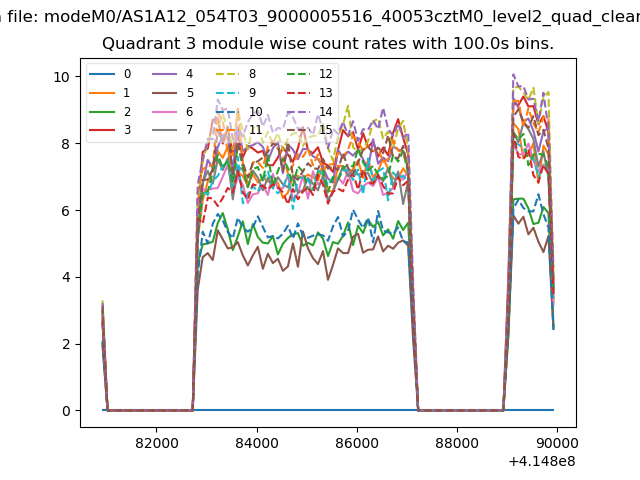
| Module-wise count rates for Quadrant A Data is divided into 100 sec bins |
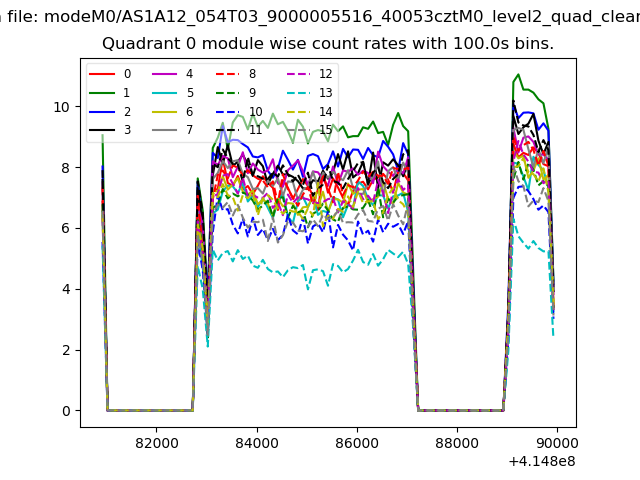 |
 |
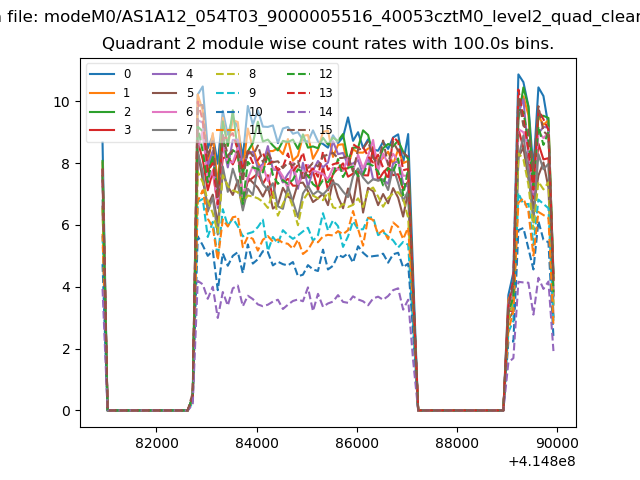
| Module-wise count rates for Quadrant B Data is divided into 100 sec bins |
 |
 |
| Module-wise count rates for Quadrant C Data is divided into 100 sec bins |
 |
 |
| Module-wise count rates for Quadrant D Data is divided into 100 sec bins |
 |
 |
| Parameter | Plot |
|---|---|
| CZT HV Monitor | 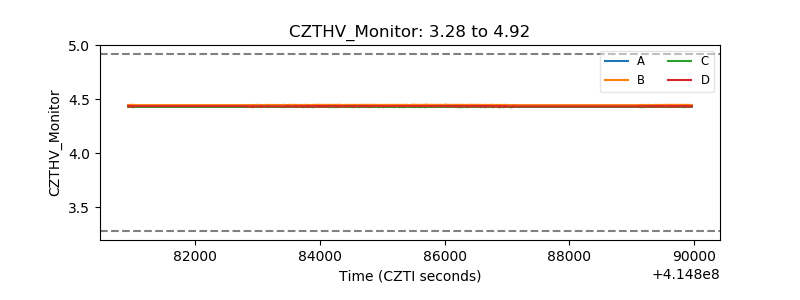 |
| D_VDD | 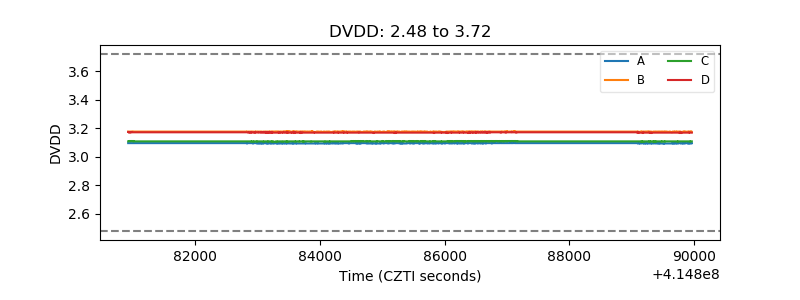 |
| Temperature 1 | 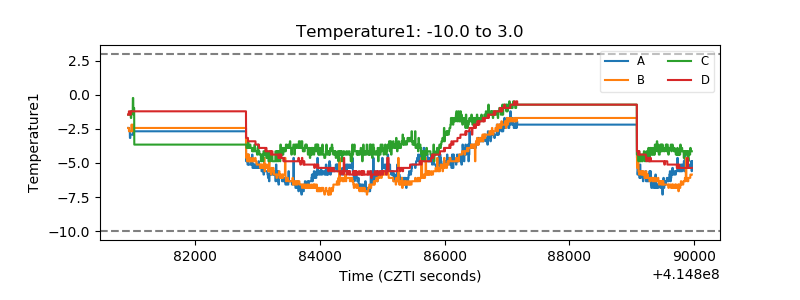 |
| Veto HV Monitor | 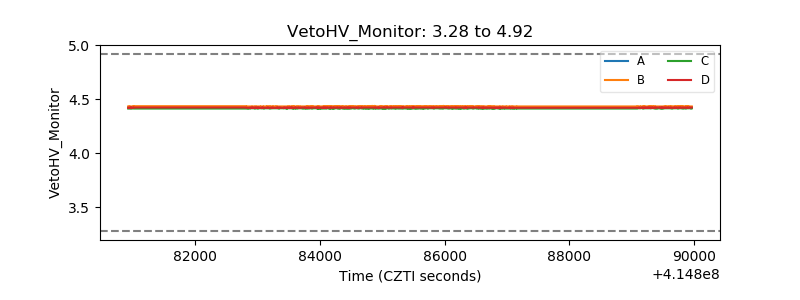 |
| Veto LLD | 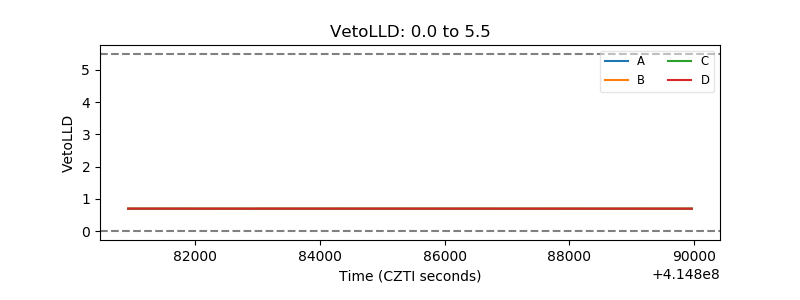 |
| Alpha Counter | 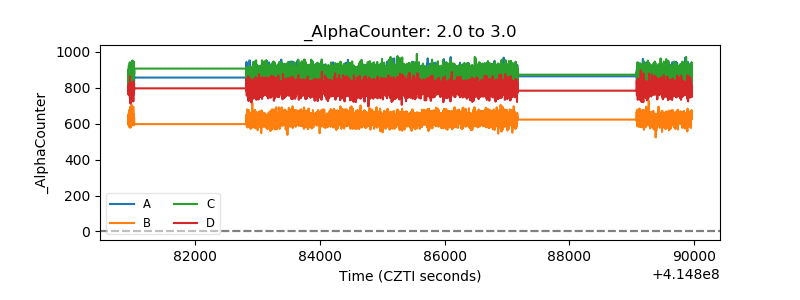 |
| _CPM_Rate | 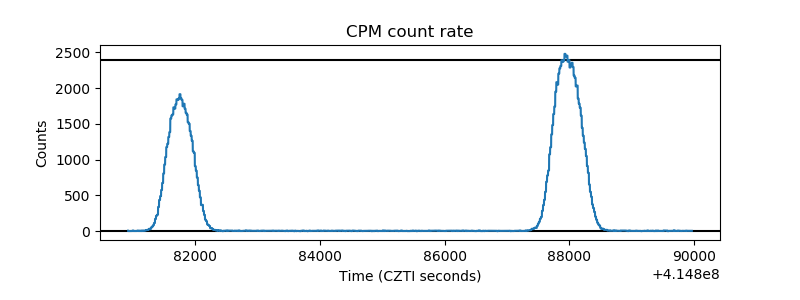 |
| CZT Counter | 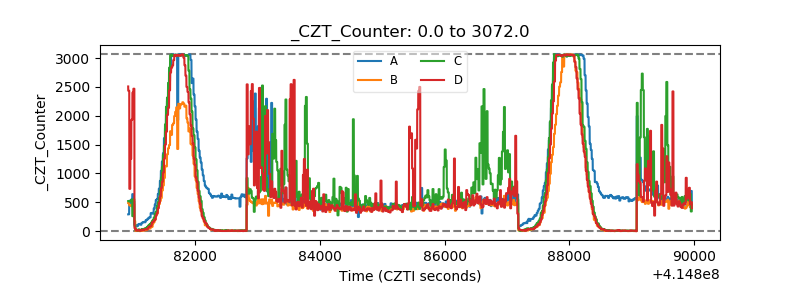 |
| +2.5 Volts monitor | 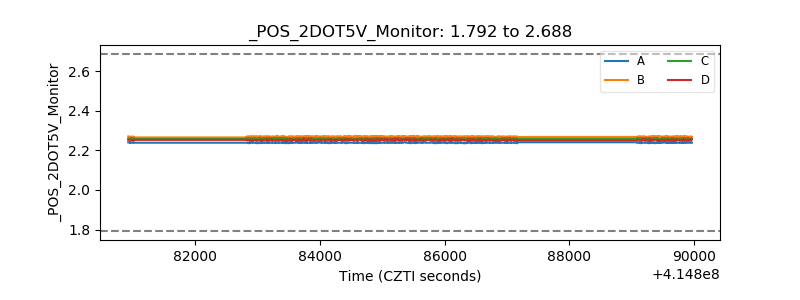 |
| +5 Volts monitor | 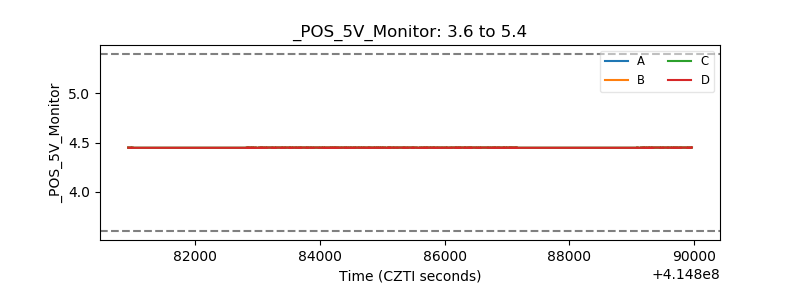 |
| _ROLL_ROT | 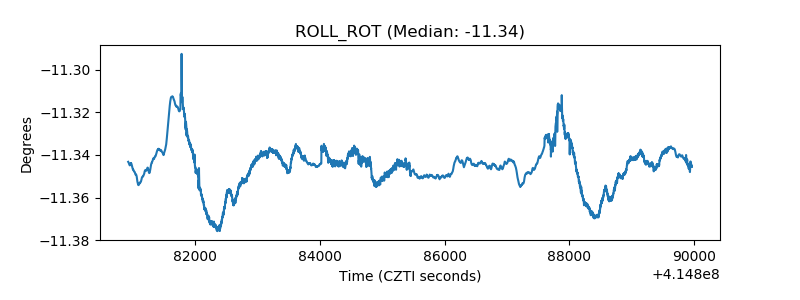 |
| _Roll_DEC |  |
| _Roll_RA | 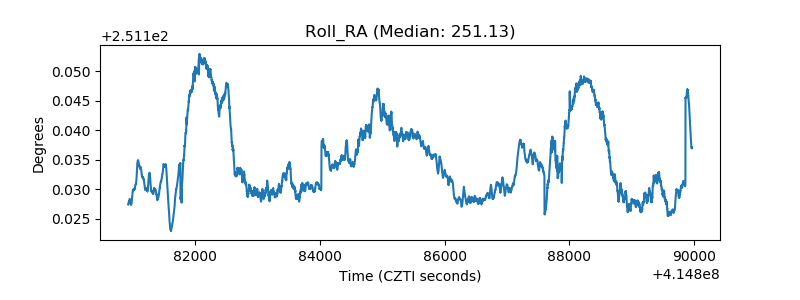 |
| Veto Counter | 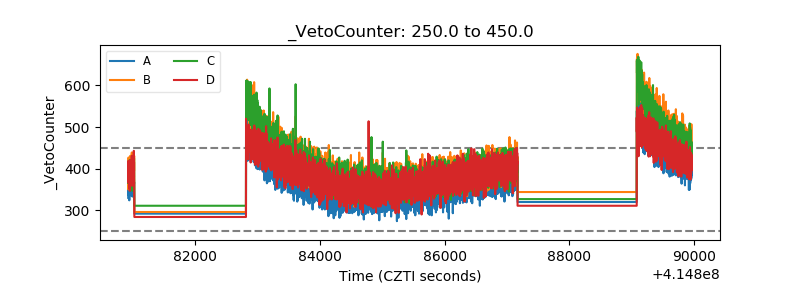 |