| Param | Original file | Final file |
|---|---|---|
| Filename | modeM0/AS1A12_054T03_9000005516_40054cztM0_level2.fits | modeM0/AS1A12_054T03_9000005516_40054cztM0_level2_quad_clean.evt |
| Size (bytes) | 334,149,120 | 91,039,680 |
| Size | 318.7 MB | 86.8 MB |
| Events in quadrant A | 2,790,918 | 618,161 |
| Events in quadrant B | 2,480,255 | 649,183 |
| Events in quadrant C | 3,407,000 | 600,130 |
| Events in quadrant D | 3,298,963 | 536,373 |
| Mode M9 | |||
|---|---|---|---|
| Quadrant | BADHDUFLAG | Total packets | Discarded packets |
| A | 0 | 32 | 0 |
| B | 0 | 32 | 0 |
| C | 0 | 32 | 0 |
| D | 0 | 33 | 0 |
| Mode SS | |||
|---|---|---|---|
| Quadrant | BADHDUFLAG | Total packets | Discarded packets |
| A | 0 | 104 | 0 |
| B | 0 | 104 | 0 |
| C | 0 | 104 | 0 |
| D | 0 | 104 | 0 |
| Mode M0 | |||
|---|---|---|---|
| Quadrant | BADHDUFLAG | Total packets | Discarded packets |
| A | 0 | 11284 | 3 |
| B | 0 | 10623 | 2 |
| C | 0 | 13412 | 2 |
| D | 0 | 13438 | 2 |
| Quadrant | Total seconds | Saturated seconds | Saturation percentage |
|---|---|---|---|
| A | 5033 | 22 | 0.437115% |
| B | 5033 | 23 | 0.456984% |
| C | 5033 | 149 | 2.960461% |
| D | 5033 | 239 | 4.748659% |
Noise dominated data is calculated using 1-second bins in cleaned event files. If a bin has >2000 counts, and if more than 50% of those come from <1% of pixels, then it is considered to be noise-dominated and hence unusable.
| Quadrant | # 1 sec bins | Bins with >0 counts | Bins with >2000 counts | High rate bins dominated by noise | Noise dominated (total time) | Noise dominated (detector-on time) | Marked lightcurve |
|---|---|---|---|---|---|---|---|
| A | 7064 | 5034 | 8 | 8 | 0.11% | 0.16% | 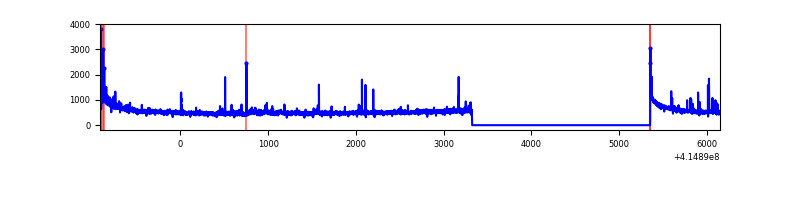 |
| B | 7064 | 5034 | 10 | 10 | 0.14% | 0.20% | 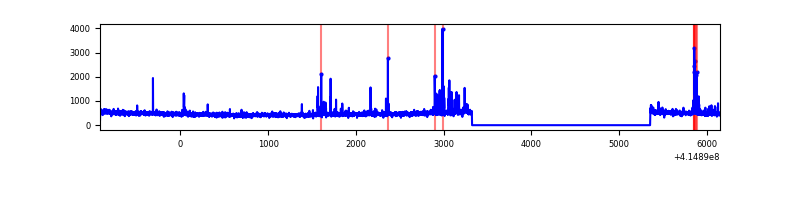 |
| C | 7064 | 5034 | 128 | 128 | 1.81% | 2.54% | 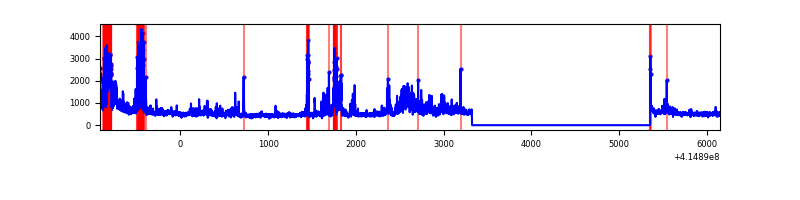 |
| D | 7064 | 5034 | 222 | 222 | 3.14% | 4.41% | 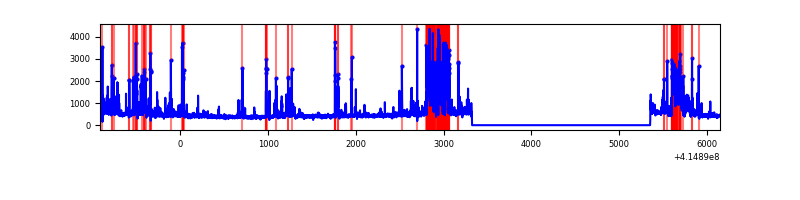 |
Top three noisy pixels from each quadrant. If the there are fewer than three noisy pixels in the level2.evt file, extra rows are filled as -1
| Pixel properties | Quadrant properties | ||||||
|---|---|---|---|---|---|---|---|
| Quadrant | DetID | PixID | Counts | Sigma | Mean | Median | Sigma |
| A | 10 | 83 | 434212 | 3718.85 | 572 | 564 | 116.6 |
| A | 9 | 143 | 42861 | 362.73 | 572 | 564 | 116.6 |
| A | 13 | 248 | 36043 | 304.26 | 572 | 564 | 116.6 |
| B | 0 | 221 | 190986 | 1705.85 | 579 | 564 | 111.6 |
| B | 12 | 111 | 13366 | 114.68 | 579 | 564 | 111.6 |
| B | 11 | 111 | 12533 | 107.22 | 579 | 564 | 111.6 |
| C | 9 | 187 | 918474 | 7080.6 | 560 | 564 | 129.6 |
| C | 15 | 214 | 207446 | 1595.85 | 560 | 564 | 129.6 |
| C | 14 | 254 | 50988 | 388.96 | 560 | 564 | 129.6 |
| D | 12 | 233 | 347739 | 2601.89 | 545 | 529 | 133.4 |
| D | 2 | 250 | 328347 | 2456.57 | 545 | 529 | 133.4 |
| D | 12 | 227 | 227695 | 1702.31 | 545 | 529 | 133.4 |
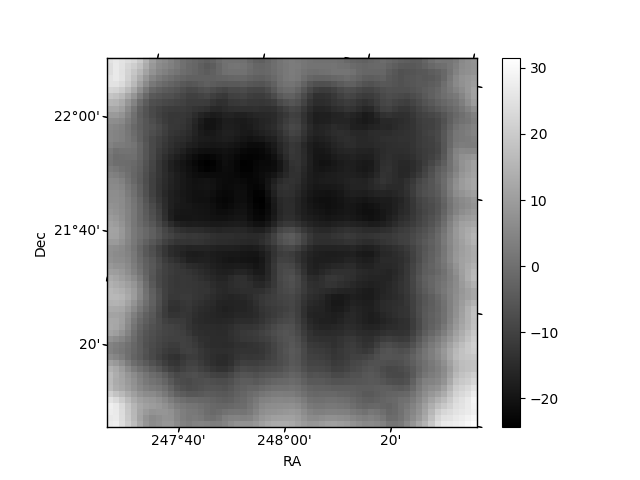
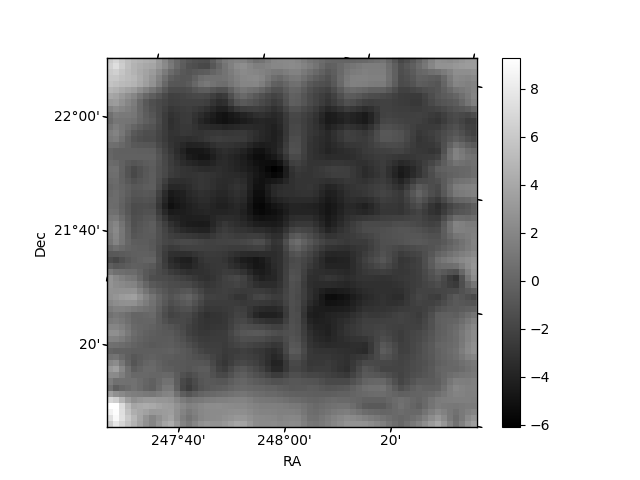
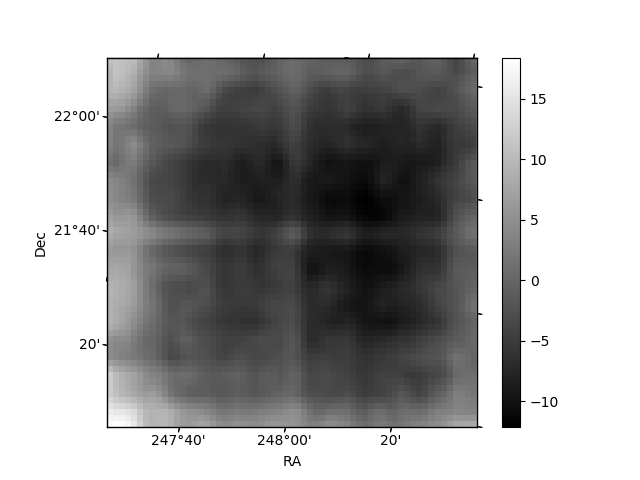
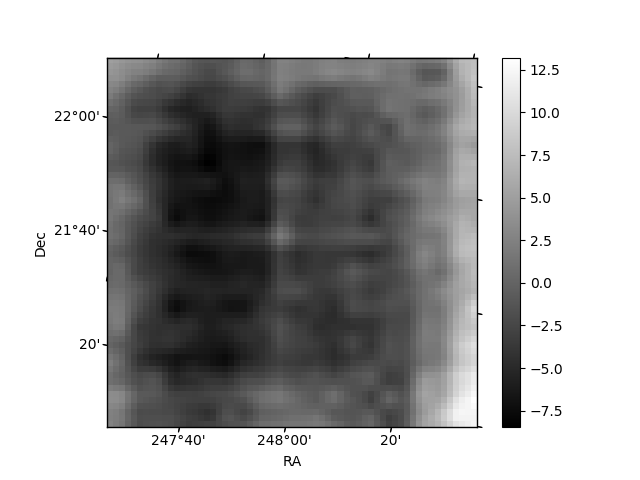
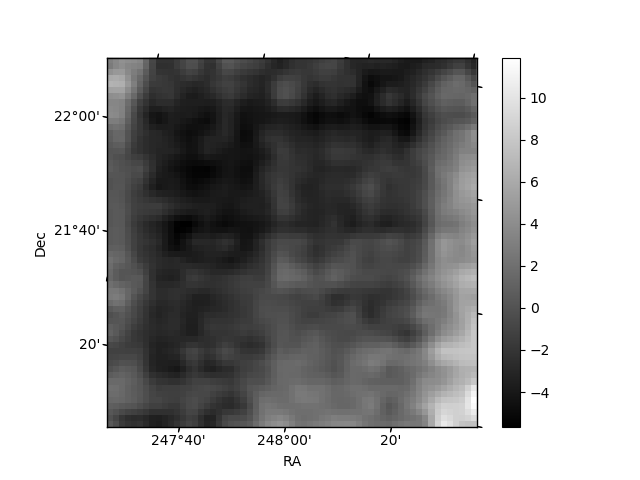
Histogram calculated using DETX and DETY for each event in the final _common_clean file
| Quadrant A | 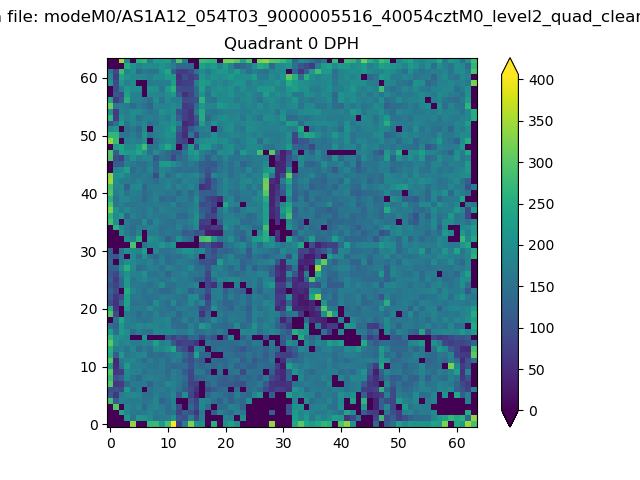 |
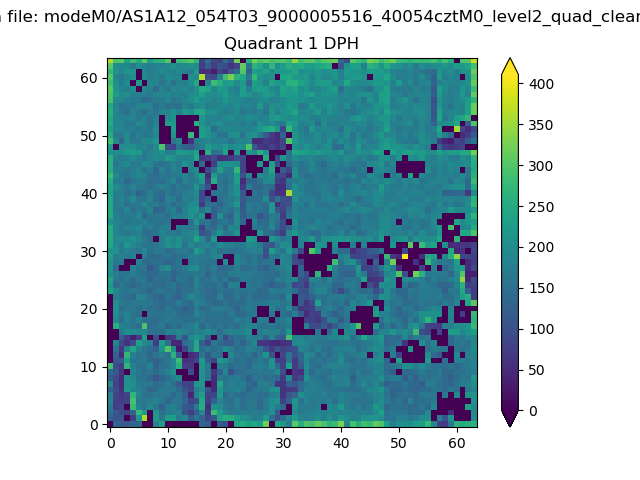 |
Quadrant B |
|---|---|---|---|
| Quadrant D | 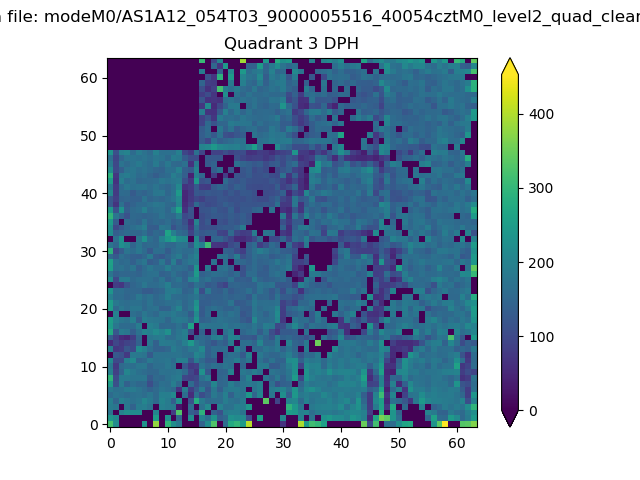 |
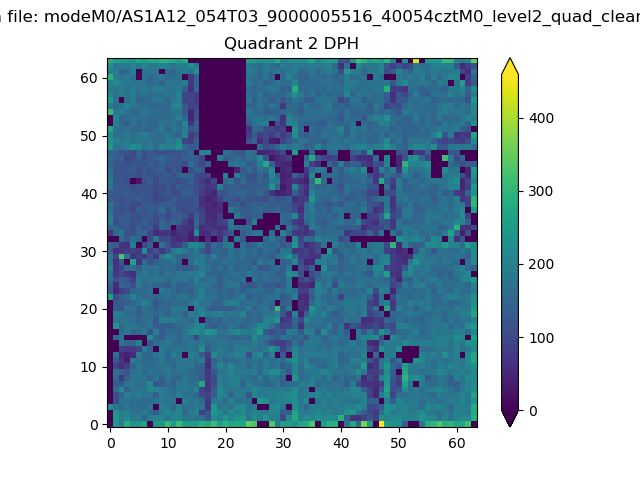 |
Quadrant C |
| Plot type | Count rate plots | Images |
|---|---|---|
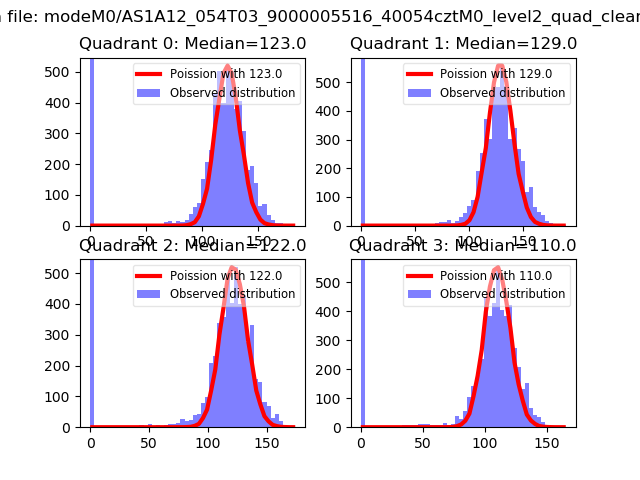
| Comparison with Poisson distribution Blue bars denote a histogram of data divided into 1 sec bins. Red curve is a Poisson curve with rate = median count rate of data. |
 |
 |
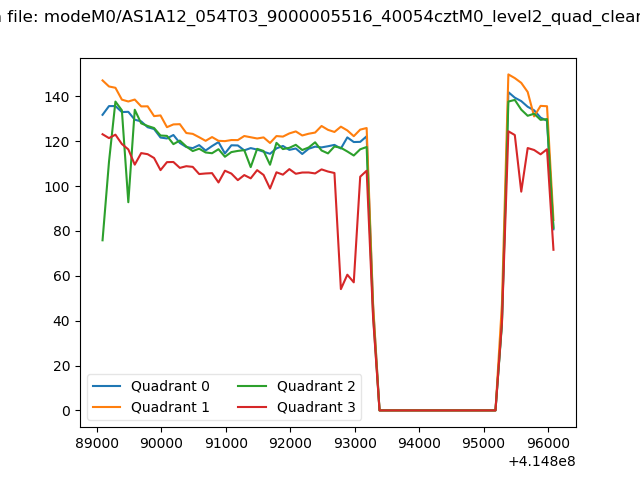
| Quadrant-wise count rates Data is divided into 100 sec bins |
 |
|
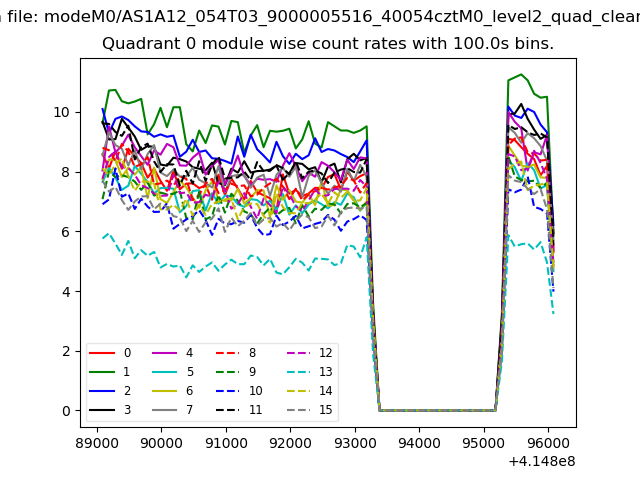
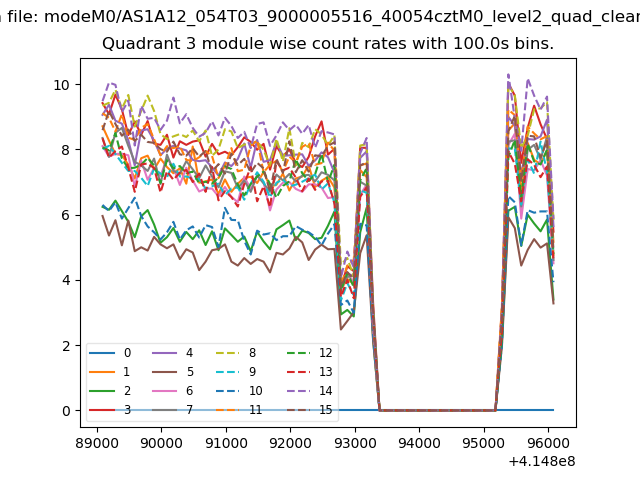
| Module-wise count rates for Quadrant A Data is divided into 100 sec bins |
 |
 |
| Module-wise count rates for Quadrant B Data is divided into 100 sec bins |
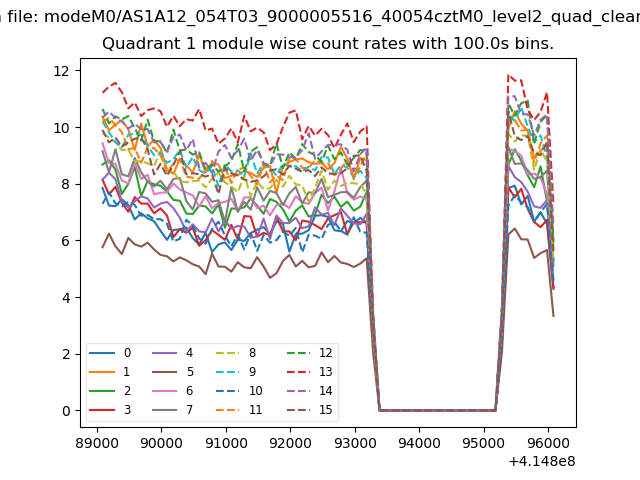 |
 |
| Module-wise count rates for Quadrant C Data is divided into 100 sec bins |
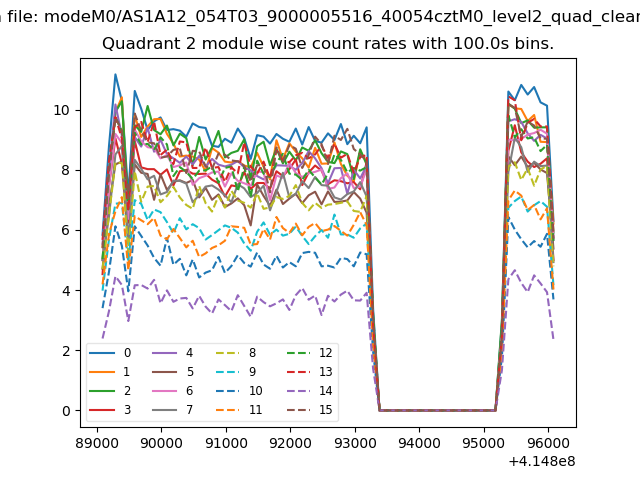 |
 |
| Module-wise count rates for Quadrant D Data is divided into 100 sec bins |
 |
 |
| Parameter | Plot |
|---|---|
| CZT HV Monitor | 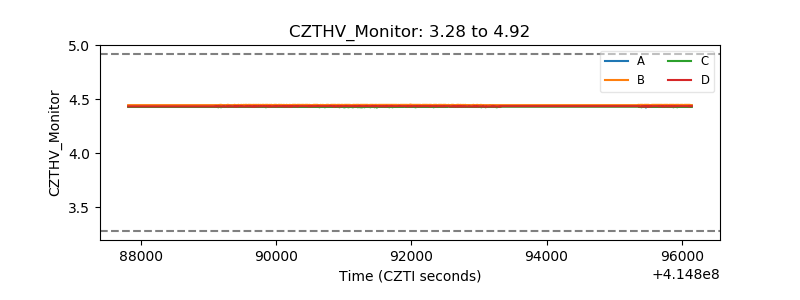 |
| D_VDD | 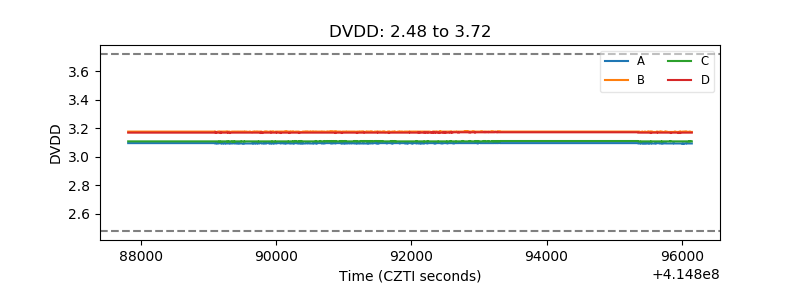 |
| Temperature 1 | 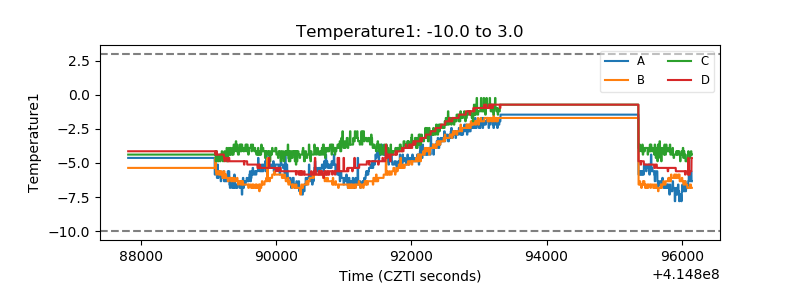 |
| Veto HV Monitor | 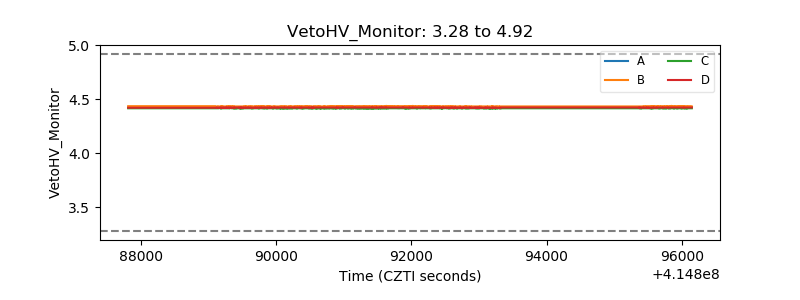 |
| Veto LLD | 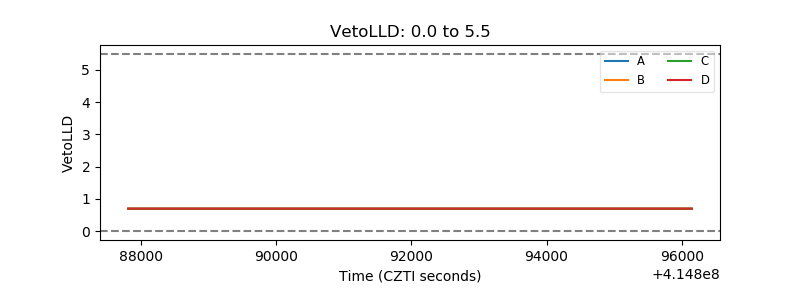 |
| Alpha Counter |  |
| _CPM_Rate | 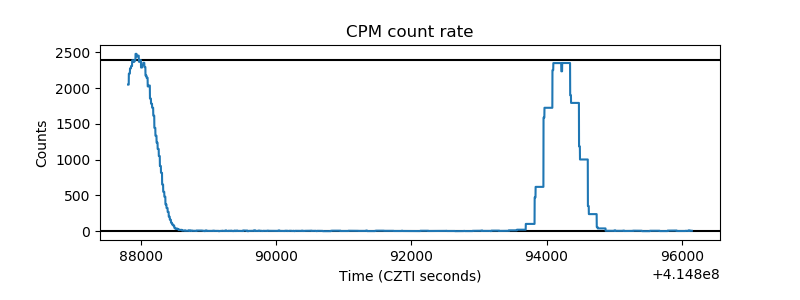 |
| CZT Counter | 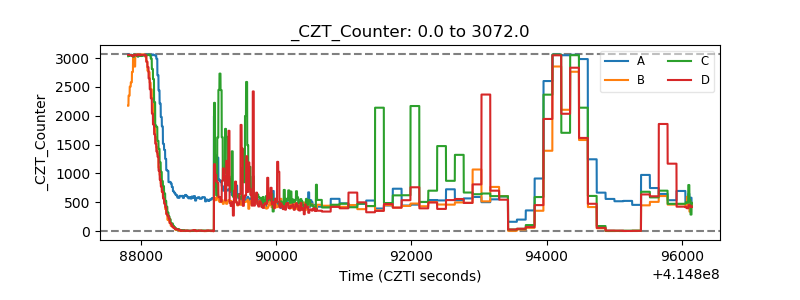 |
| +2.5 Volts monitor | 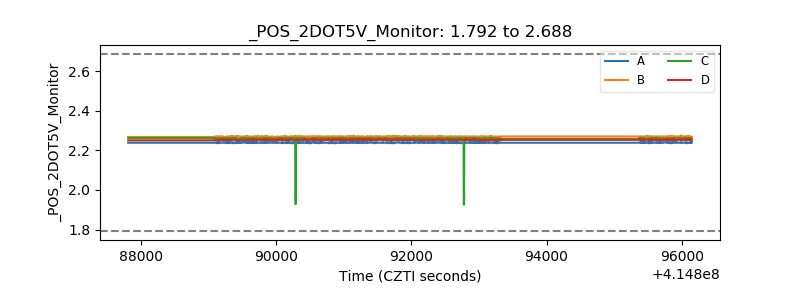 |
| +5 Volts monitor | 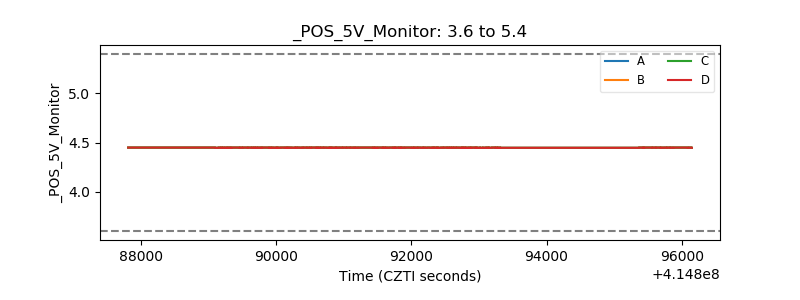 |
| _ROLL_ROT | 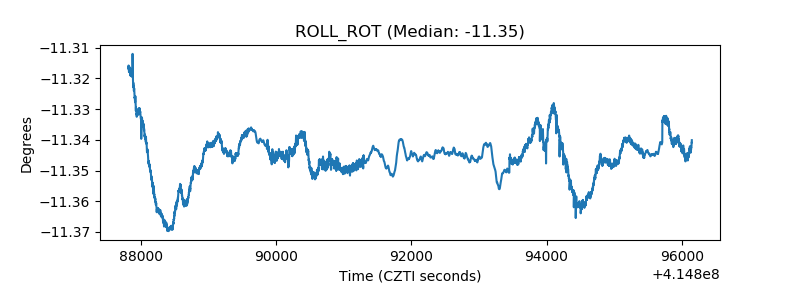 |
| _Roll_DEC | 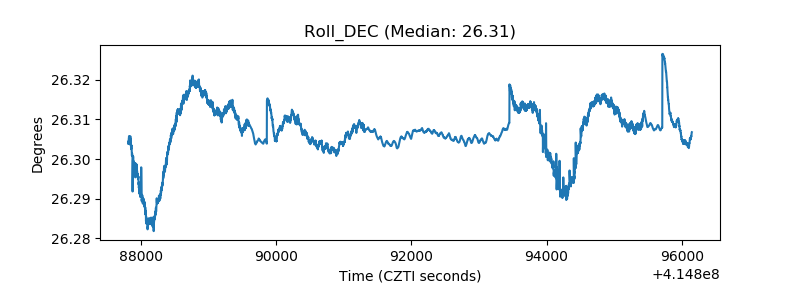 |
| _Roll_RA | 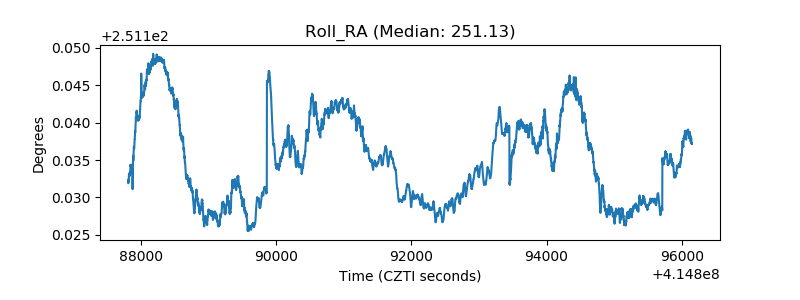 |
| Veto Counter | 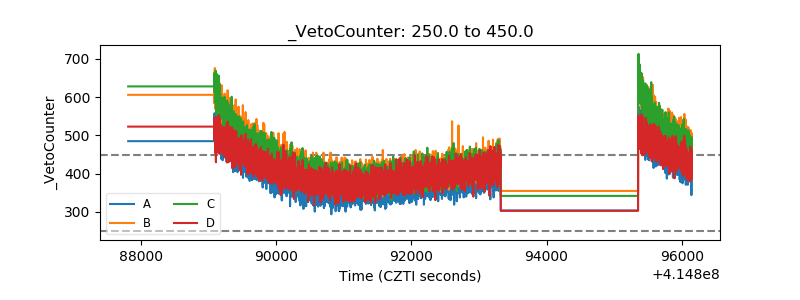 |