| Param | Original file | Final file |
|---|---|---|
| Filename | modeM0/AS1A12_054T03_9000005516_40055cztM0_level2.fits | modeM0/AS1A12_054T03_9000005516_40055cztM0_level2_quad_clean.evt |
| Size (bytes) | 345,513,600 | 96,572,160 |
| Size | 329.5 MB | 92.1 MB |
| Events in quadrant A | 2,899,765 | 654,636 |
| Events in quadrant B | 2,742,824 | 679,365 |
| Events in quadrant C | 3,495,225 | 645,088 |
| Events in quadrant D | 3,237,837 | 573,368 |
| Mode M9 | |||
|---|---|---|---|
| Quadrant | BADHDUFLAG | Total packets | Discarded packets |
| A | 0 | 37 | 0 |
| B | 0 | 37 | 0 |
| C | 0 | 37 | 0 |
| D | 0 | 38 | 0 |
| Mode SS | |||
|---|---|---|---|
| Quadrant | BADHDUFLAG | Total packets | Discarded packets |
| A | 0 | 106 | 0 |
| B | 0 | 106 | 0 |
| C | 0 | 106 | 0 |
| D | 0 | 106 | 0 |
| Mode M0 | |||
|---|---|---|---|
| Quadrant | BADHDUFLAG | Total packets | Discarded packets |
| A | 0 | 11832 | 3 |
| B | 0 | 11703 | 2 |
| C | 0 | 13878 | 2 |
| D | 0 | 13478 | 2 |
| Quadrant | Total seconds | Saturated seconds | Saturation percentage |
|---|---|---|---|
| A | 5321 | 18 | 0.338282% |
| B | 5321 | 74 | 1.390716% |
| C | 5321 | 46 | 0.864499% |
| D | 5321 | 173 | 3.251269% |
Noise dominated data is calculated using 1-second bins in cleaned event files. If a bin has >2000 counts, and if more than 50% of those come from <1% of pixels, then it is considered to be noise-dominated and hence unusable.
| Quadrant | # 1 sec bins | Bins with >0 counts | Bins with >2000 counts | High rate bins dominated by noise | Noise dominated (total time) | Noise dominated (detector-on time) | Marked lightcurve |
|---|---|---|---|---|---|---|---|
| A | 7443 | 5322 | 11 | 11 | 0.15% | 0.21% | 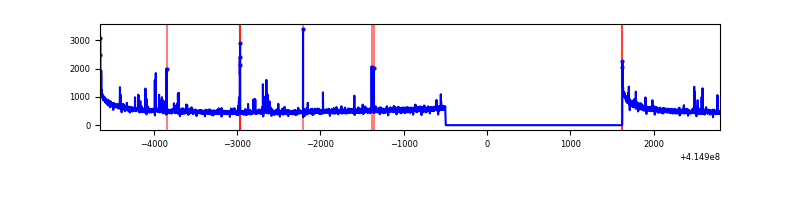 |
| B | 7443 | 5322 | 40 | 40 | 0.54% | 0.75% | 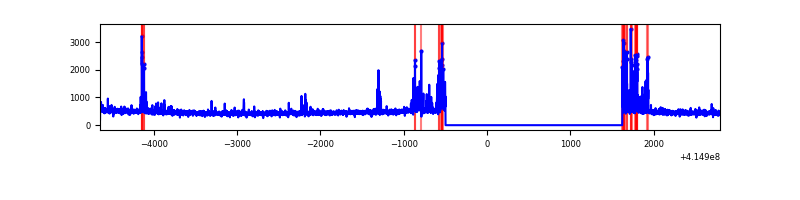 |
| C | 7443 | 5322 | 46 | 46 | 0.62% | 0.86% | 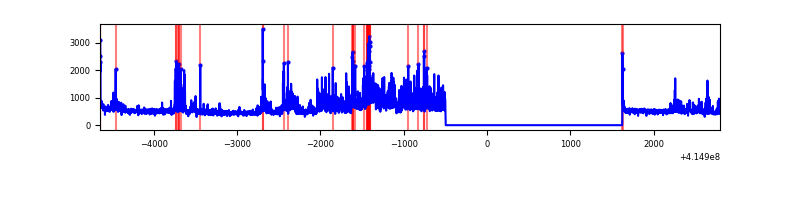 |
| D | 7443 | 5322 | 179 | 179 | 2.40% | 3.36% | 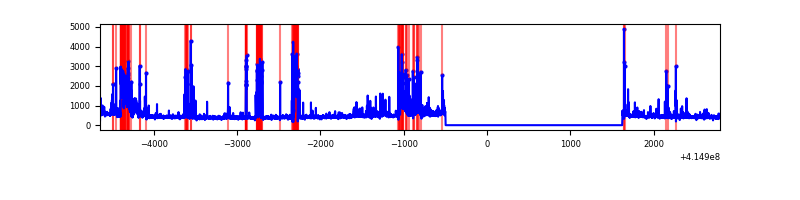 |
Top three noisy pixels from each quadrant. If the there are fewer than three noisy pixels in the level2.evt file, extra rows are filled as -1
| Pixel properties | Quadrant properties | ||||||
|---|---|---|---|---|---|---|---|
| Quadrant | DetID | PixID | Counts | Sigma | Mean | Median | Sigma |
| A | 10 | 83 | 452877 | 3726.99 | 602 | 592 | 121.4 |
| A | 9 | 143 | 84758 | 693.56 | 602 | 592 | 121.4 |
| A | 2 | 79 | 16288 | 129.34 | 602 | 592 | 121.4 |
| B | 4 | 171 | 242377 | 2101.96 | 606 | 592 | 115.0 |
| B | 0 | 221 | 82996 | 716.38 | 606 | 592 | 115.0 |
| B | 0 | 245 | 34791 | 297.31 | 606 | 592 | 115.0 |
| C | 9 | 187 | 930393 | 6819.94 | 589 | 595 | 136.3 |
| C | 15 | 214 | 219838 | 1608.12 | 589 | 595 | 136.3 |
| C | 0 | 10 | 24609 | 176.14 | 589 | 595 | 136.3 |
| D | 12 | 227 | 501622 | 3582.3 | 575 | 558 | 139.9 |
| D | 1 | 47 | 195738 | 1395.42 | 575 | 558 | 139.9 |
| D | 2 | 250 | 151645 | 1080.18 | 575 | 558 | 139.9 |
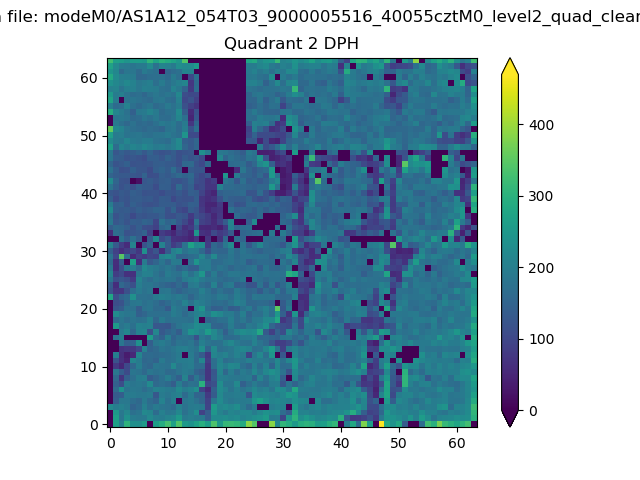
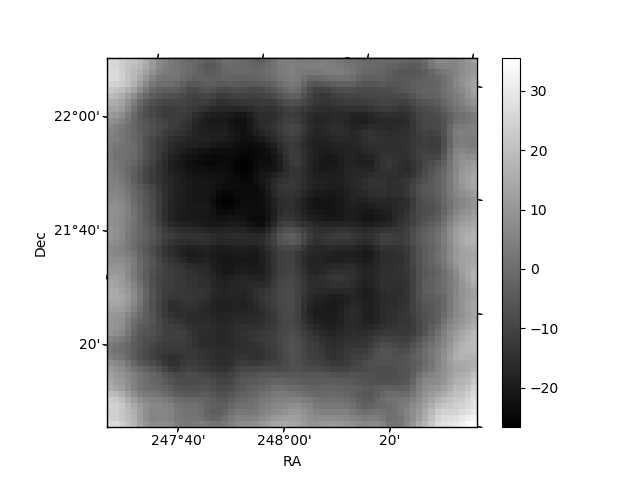
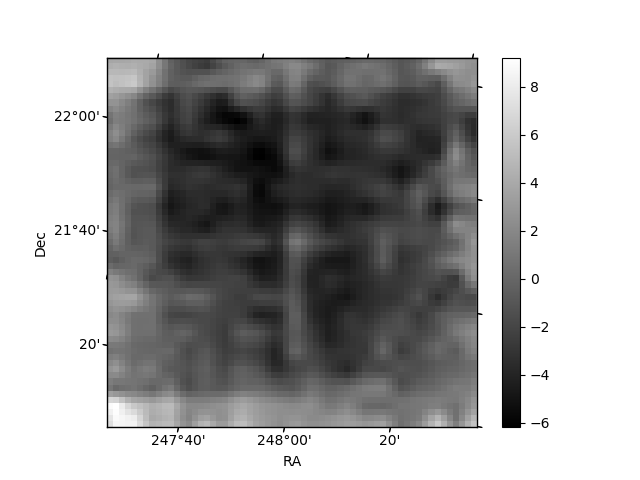
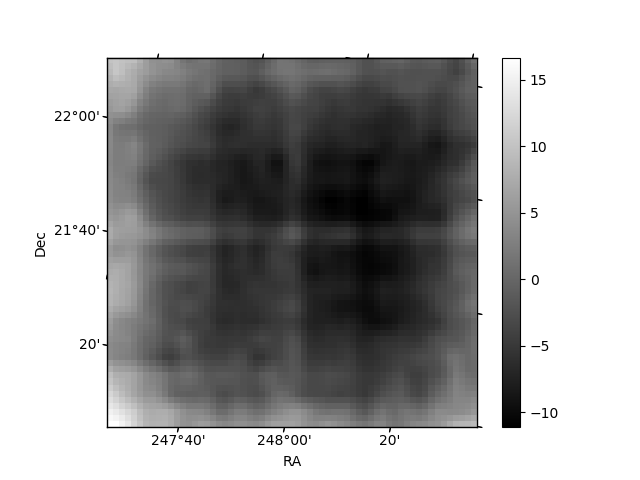
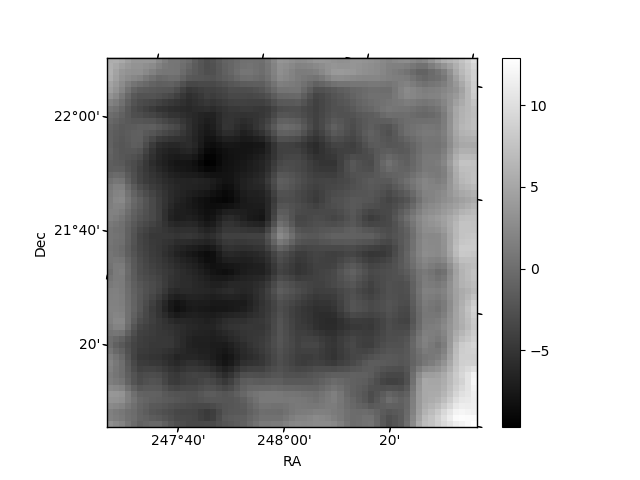
Histogram calculated using DETX and DETY for each event in the final _common_clean file
| Quadrant A | 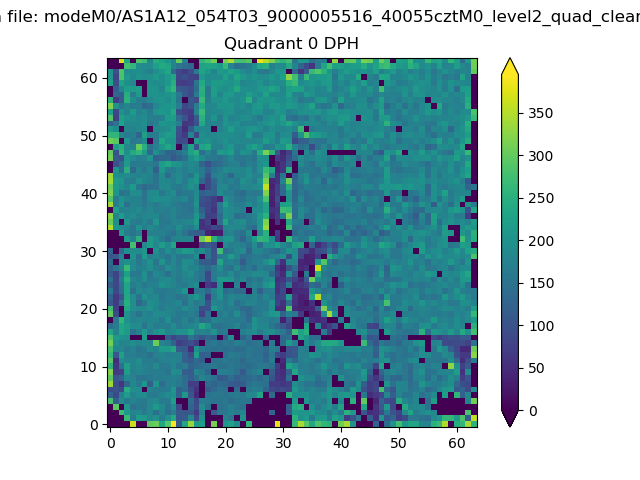 |
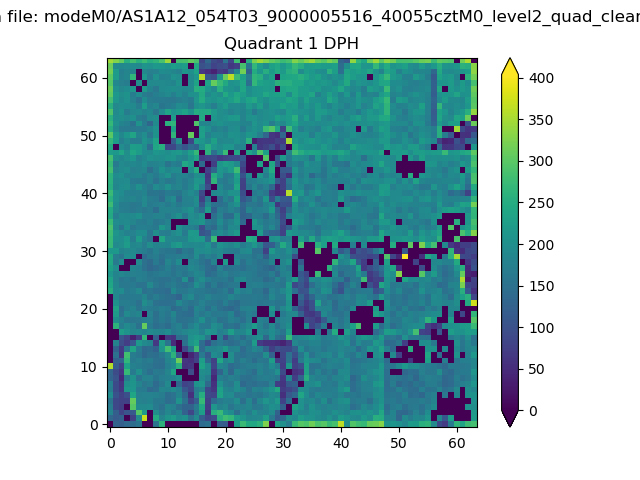 |
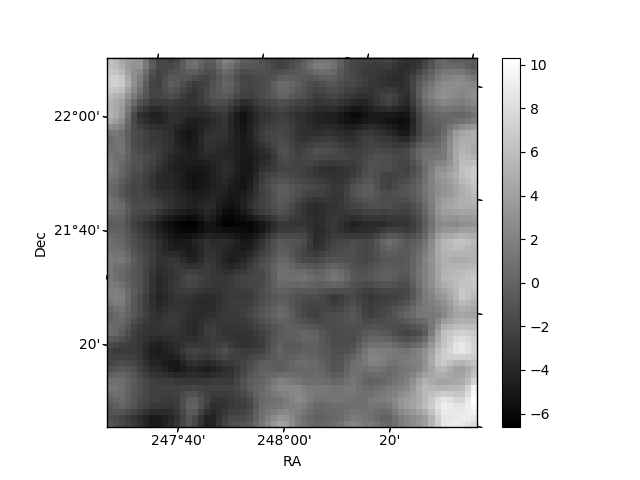
Quadrant B |
|---|---|---|---|
| Quadrant D | 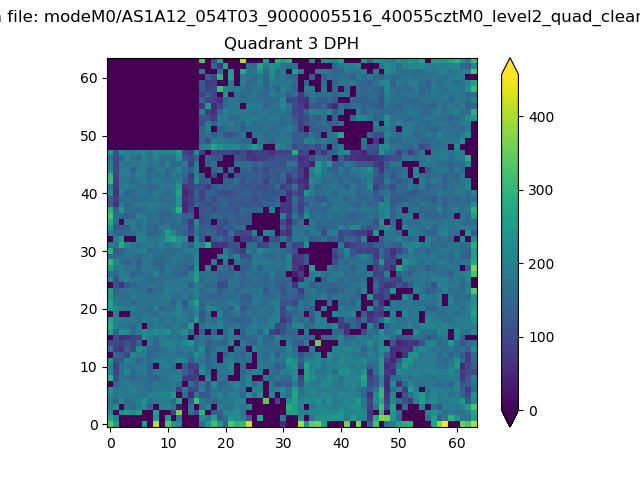 |
 |
Quadrant C |
| Plot type | Count rate plots | Images |
|---|---|---|
| Comparison with Poisson distribution Blue bars denote a histogram of data divided into 1 sec bins. Red curve is a Poisson curve with rate = median count rate of data. |
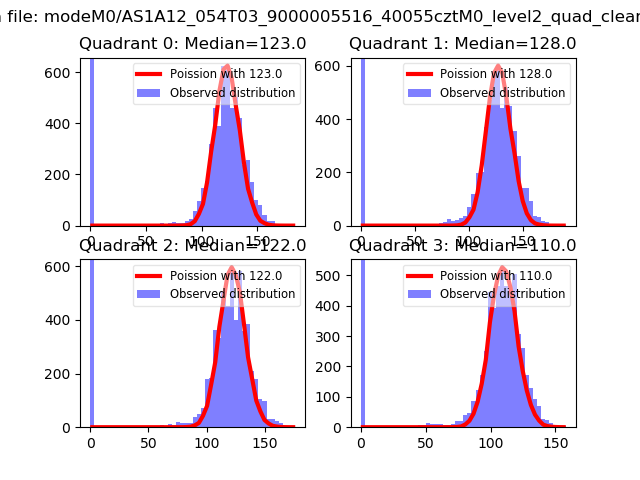 |
 |
| Quadrant-wise count rates Data is divided into 100 sec bins |
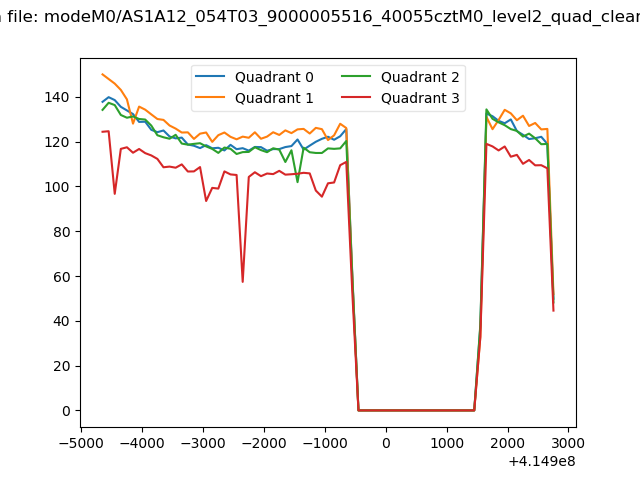 |
|
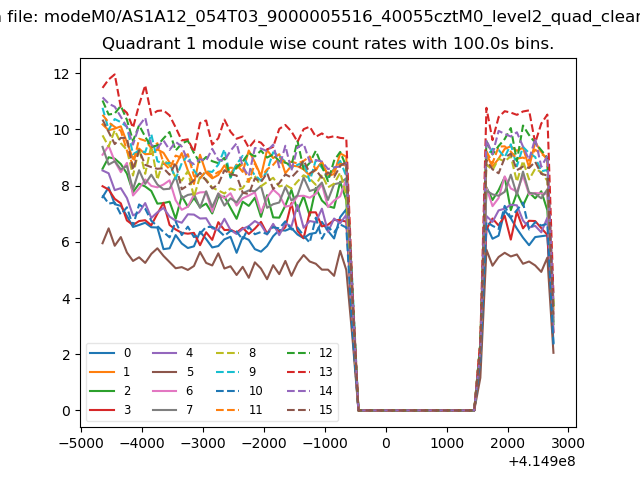
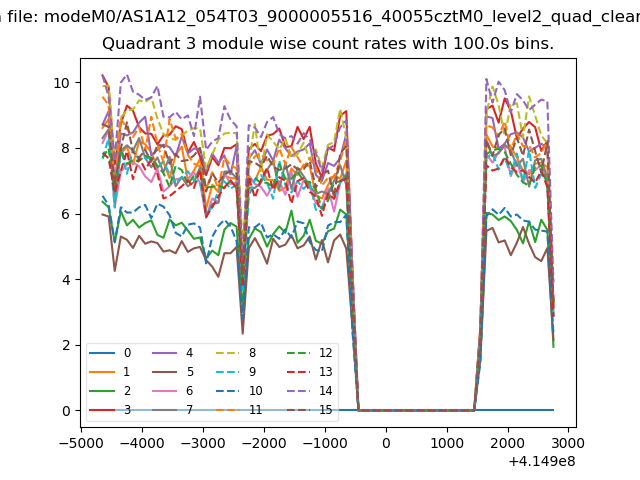
| Module-wise count rates for Quadrant A Data is divided into 100 sec bins |
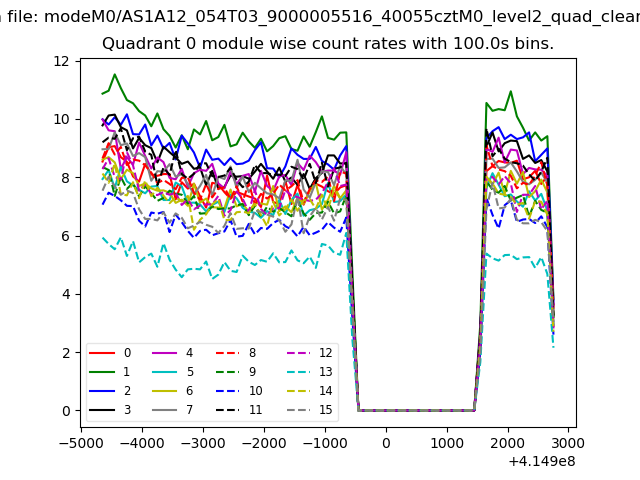 |
 |
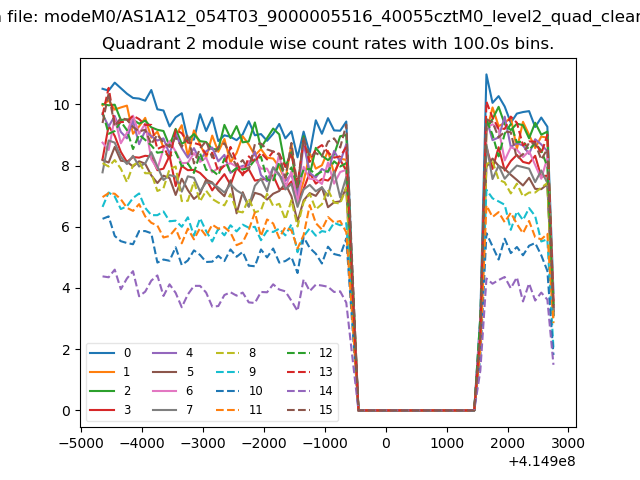
| Module-wise count rates for Quadrant B Data is divided into 100 sec bins |
 |
 |
| Module-wise count rates for Quadrant C Data is divided into 100 sec bins |
 |
 |
| Module-wise count rates for Quadrant D Data is divided into 100 sec bins |
 |
 |
| Parameter | Plot |
|---|---|
| CZT HV Monitor | 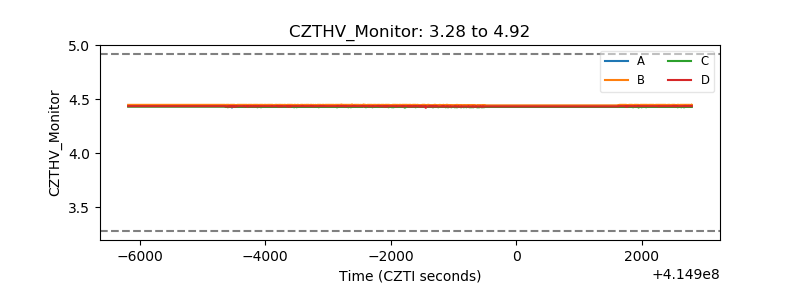 |
| D_VDD | 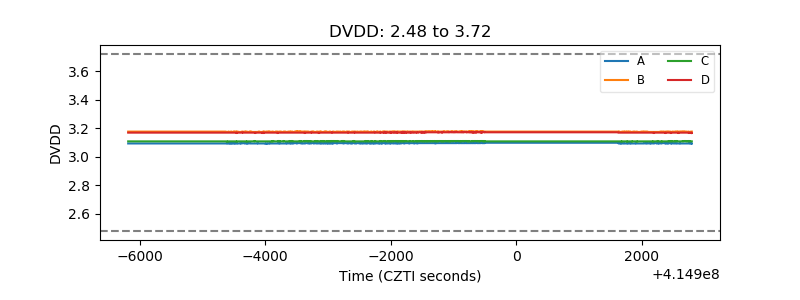 |
| Temperature 1 | 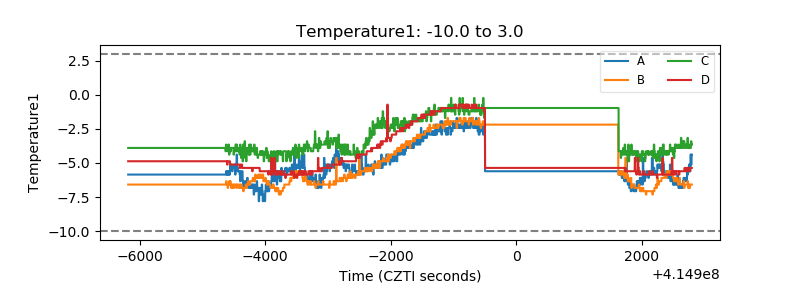 |
| Veto HV Monitor | 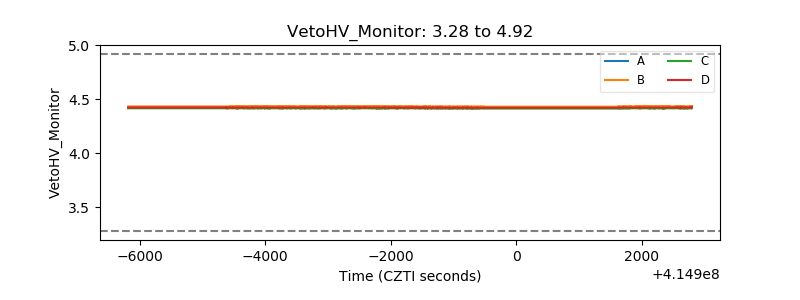 |
| Veto LLD | 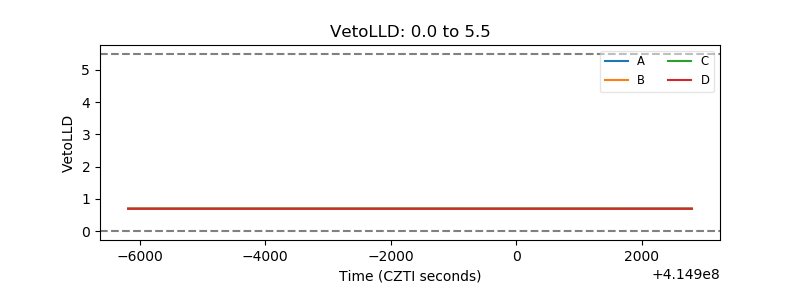 |
| Alpha Counter | 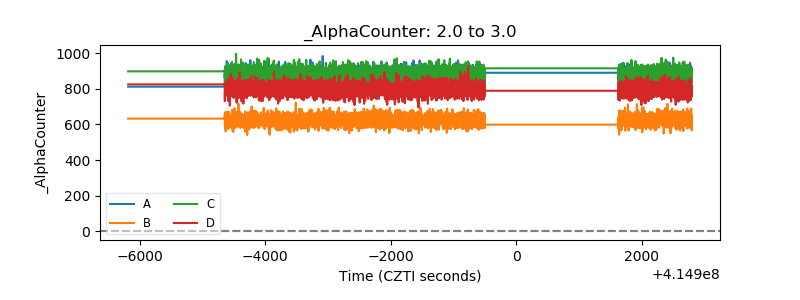 |
| _CPM_Rate |  |
| CZT Counter | 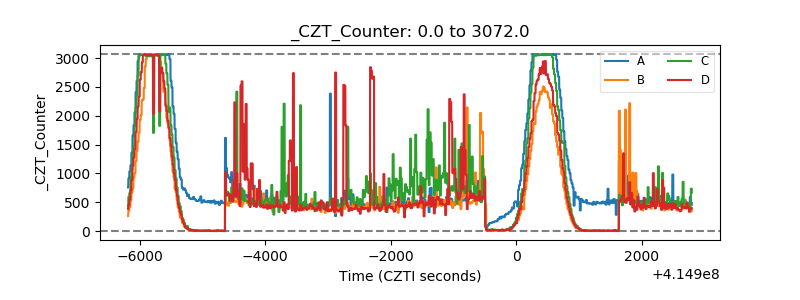 |
| +2.5 Volts monitor | 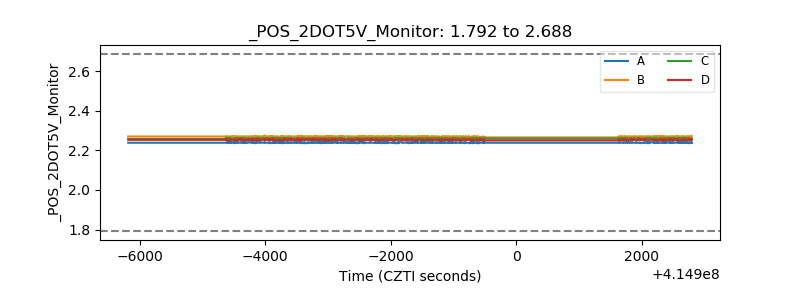 |
| +5 Volts monitor | 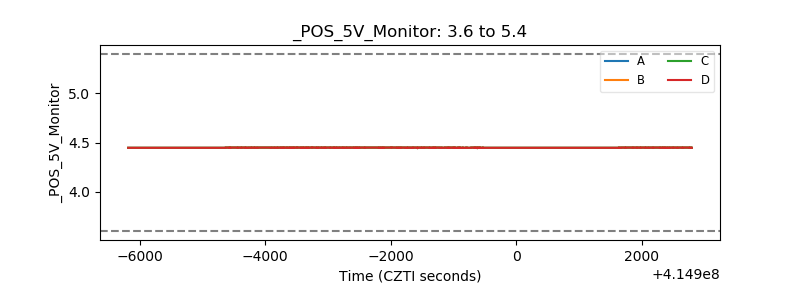 |
| _ROLL_ROT | 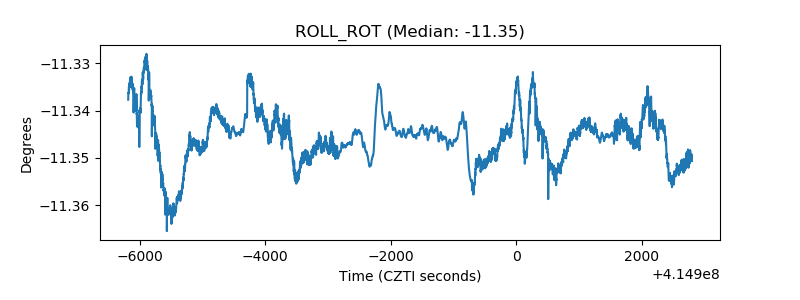 |
| _Roll_DEC | 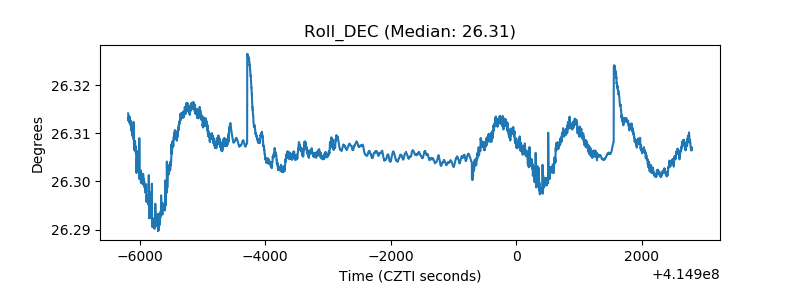 |
| _Roll_RA | 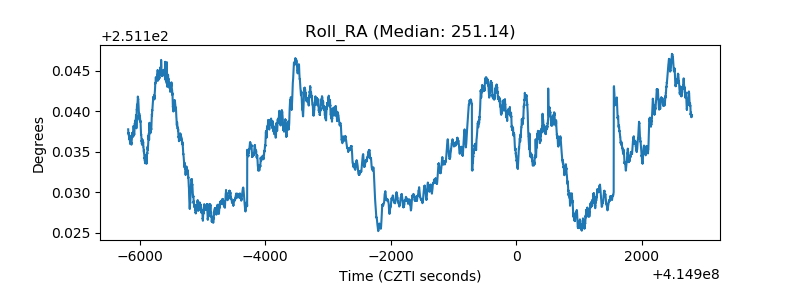 |
| Veto Counter | 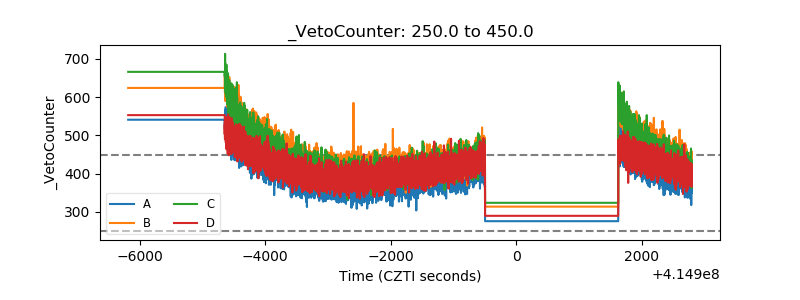 |