| Param | Original file | Final file |
|---|---|---|
| Filename | modeM0/AS1A12_054T03_9000005516_40056cztM0_level2.fits | modeM0/AS1A12_054T03_9000005516_40056cztM0_level2_quad_clean.evt |
| Size (bytes) | 370,805,760 | 90,829,440 |
| Size | 353.6 MB | 86.6 MB |
| Events in quadrant A | 2,757,505 | 621,519 |
| Events in quadrant B | 2,908,636 | 638,038 |
| Events in quadrant C | 3,619,523 | 607,620 |
| Events in quadrant D | 4,033,663 | 517,391 |
| Mode M9 | |||
|---|---|---|---|
| Quadrant | BADHDUFLAG | Total packets | Discarded packets |
| A | 0 | 27 | 0 |
| B | 0 | 27 | 0 |
| C | 0 | 27 | 0 |
| D | 0 | 28 | 0 |
| Mode SS | |||
|---|---|---|---|
| Quadrant | BADHDUFLAG | Total packets | Discarded packets |
| A | 0 | 106 | 0 |
| B | 0 | 106 | 0 |
| C | 0 | 106 | 0 |
| D | 0 | 106 | 0 |
| Mode M0 | |||
|---|---|---|---|
| Quadrant | BADHDUFLAG | Total packets | Discarded packets |
| A | 0 | 11357 | 3 |
| B | 0 | 12224 | 2 |
| C | 0 | 14178 | 2 |
| D | 0 | 15697 | 2 |
| Quadrant | Total seconds | Saturated seconds | Saturation percentage |
|---|---|---|---|
| A | 5224 | 12 | 0.229709% |
| B | 5224 | 137 | 2.622511% |
| C | 5224 | 94 | 1.799387% |
| D | 5224 | 492 | 9.418070% |
Noise dominated data is calculated using 1-second bins in cleaned event files. If a bin has >2000 counts, and if more than 50% of those come from <1% of pixels, then it is considered to be noise-dominated and hence unusable.
| Quadrant | # 1 sec bins | Bins with >0 counts | Bins with >2000 counts | High rate bins dominated by noise | Noise dominated (total time) | Noise dominated (detector-on time) | Marked lightcurve |
|---|---|---|---|---|---|---|---|
| A | 7376 | 5225 | 7 | 7 | 0.09% | 0.13% | 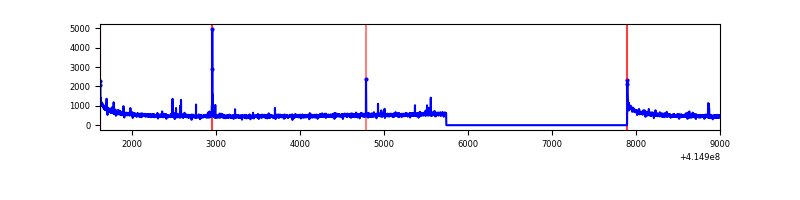 |
| B | 7376 | 5225 | 78 | 78 | 1.06% | 1.49% | 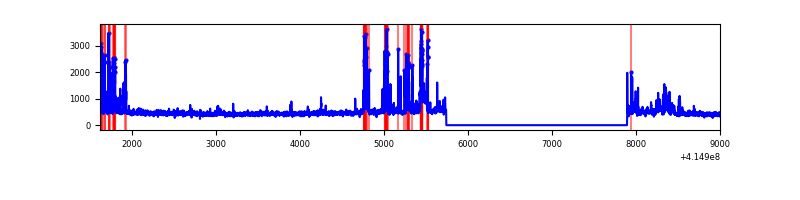 |
| C | 7376 | 5225 | 91 | 91 | 1.23% | 1.74% | 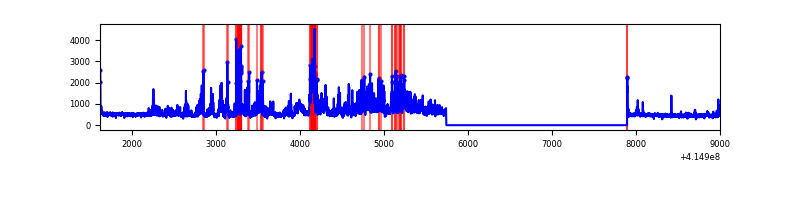 |
| D | 7376 | 5225 | 409 | 409 | 5.55% | 7.83% | 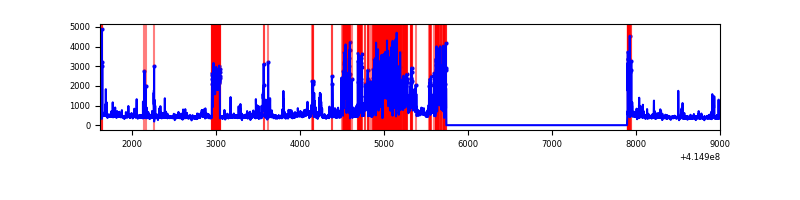 |
Top three noisy pixels from each quadrant. If the there are fewer than three noisy pixels in the level2.evt file, extra rows are filled as -1
| Pixel properties | Quadrant properties | ||||||
|---|---|---|---|---|---|---|---|
| Quadrant | DetID | PixID | Counts | Sigma | Mean | Median | Sigma |
| A | 10 | 83 | 451351 | 3866.98 | 580 | 570 | 116.6 |
| A | 9 | 143 | 35228 | 297.31 | 580 | 570 | 116.6 |
| A | 7 | 3 | 11128 | 90.57 | 580 | 570 | 116.6 |
| B | 4 | 171 | 453874 | 4131.76 | 578 | 565 | 109.7 |
| B | 5 | 32 | 107426 | 974.0 | 578 | 565 | 109.7 |
| B | 0 | 221 | 56319 | 508.18 | 578 | 565 | 109.7 |
| C | 9 | 187 | 1155866 | 8826.13 | 565 | 570 | 130.9 |
| C | 15 | 214 | 216256 | 1647.78 | 565 | 570 | 130.9 |
| C | 0 | 10 | 20373 | 151.29 | 565 | 570 | 130.9 |
| D | 1 | 47 | 895603 | 6720.4 | 542 | 526 | 133.2 |
| D | 12 | 227 | 870766 | 6533.92 | 542 | 526 | 133.2 |
| D | 2 | 250 | 80534 | 600.71 | 542 | 526 | 133.2 |
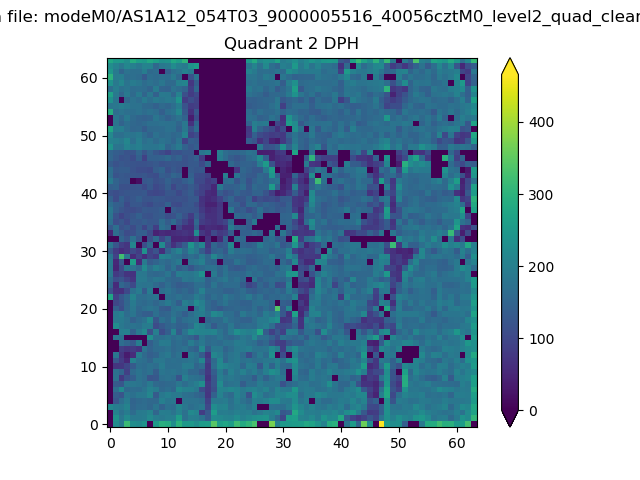
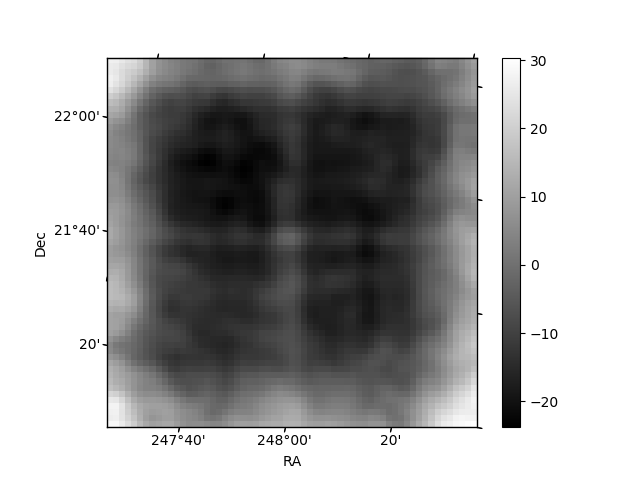
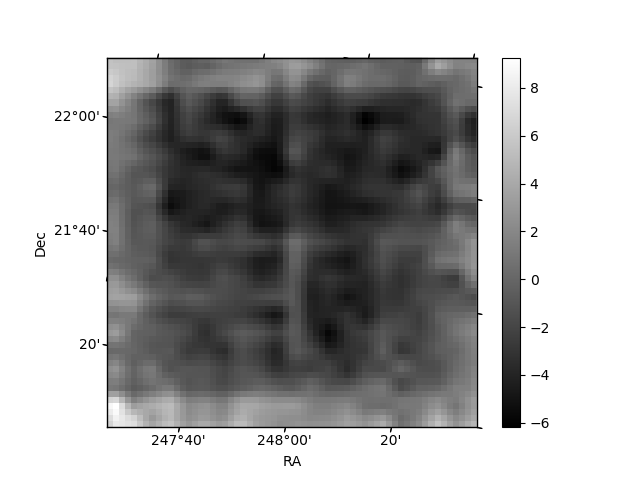
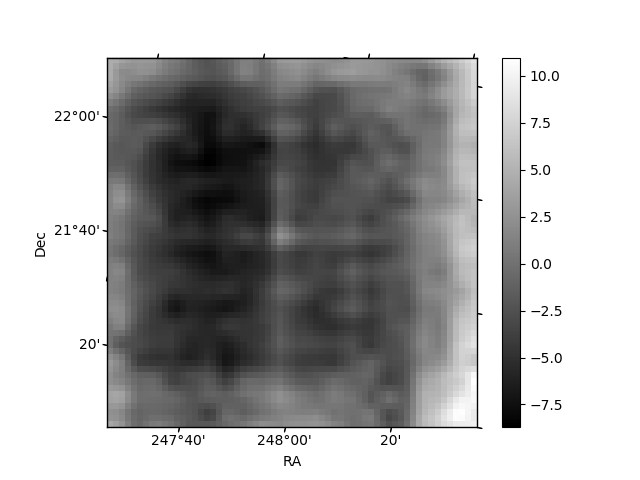
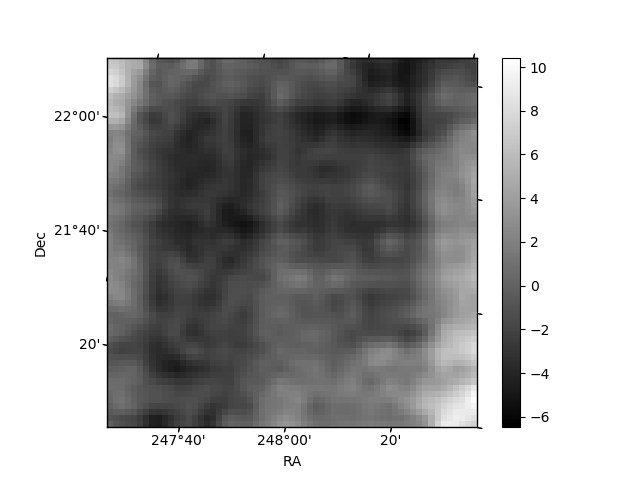
Histogram calculated using DETX and DETY for each event in the final _common_clean file
| Quadrant A | 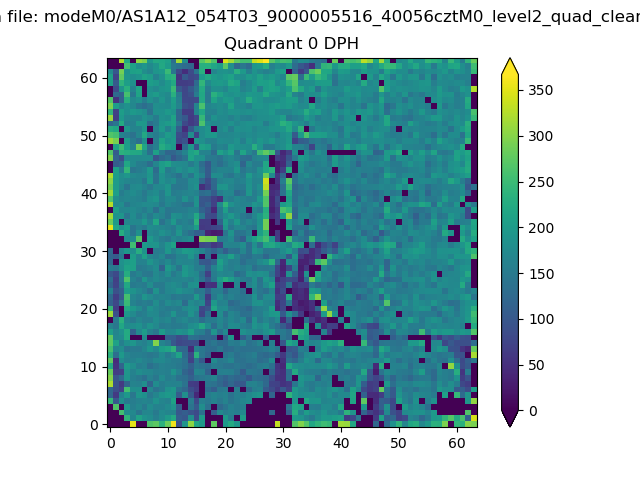 |
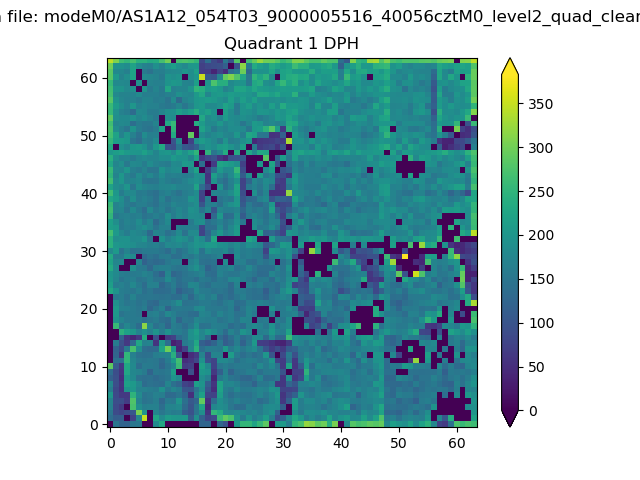 |
Quadrant B |
|---|---|---|---|
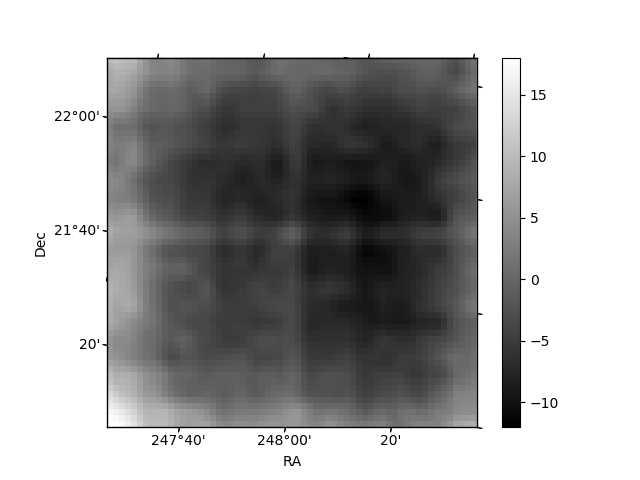
| Quadrant D | 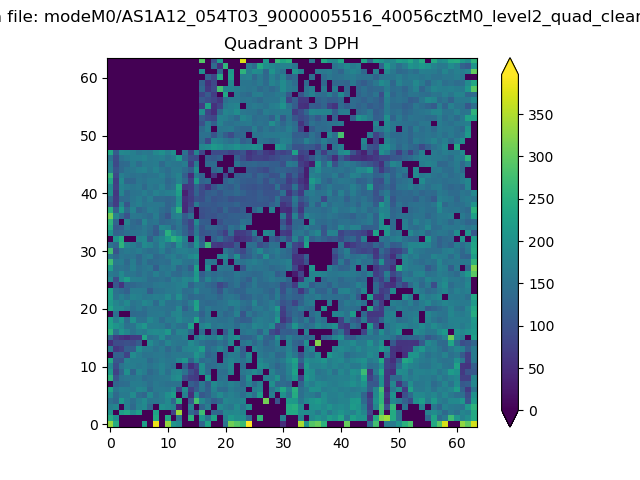 |
 |
Quadrant C |
| Plot type | Count rate plots | Images |
|---|---|---|
| Comparison with Poisson distribution Blue bars denote a histogram of data divided into 1 sec bins. Red curve is a Poisson curve with rate = median count rate of data. |
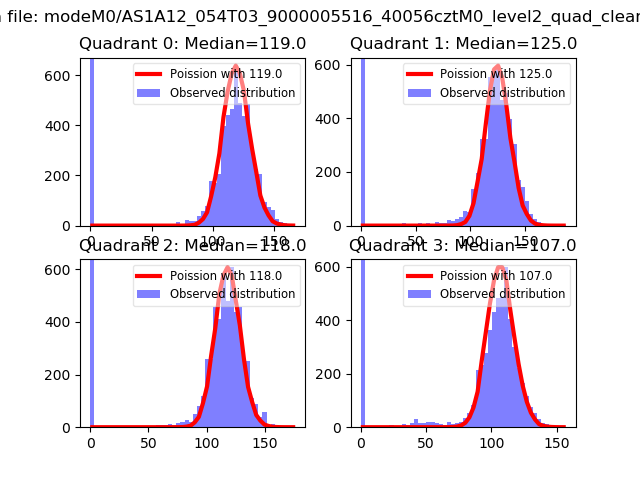 |
 |
| Quadrant-wise count rates Data is divided into 100 sec bins |
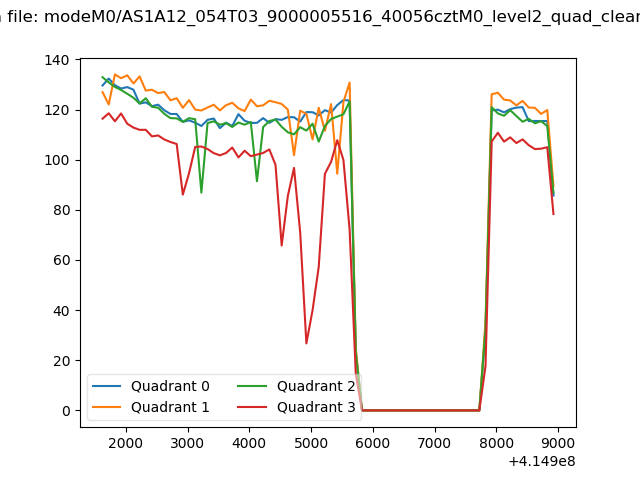 |
|
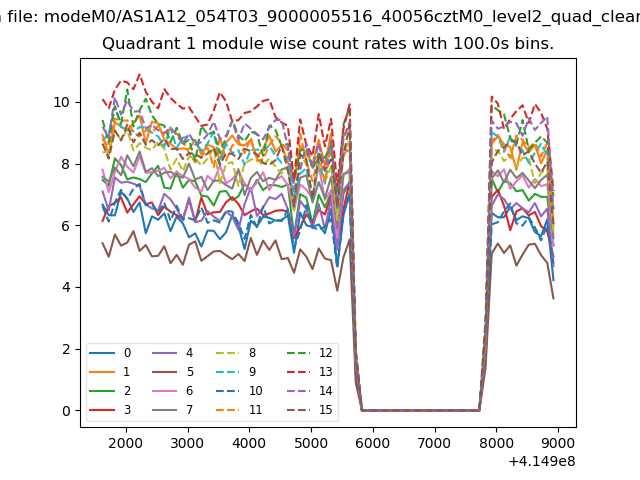
| Module-wise count rates for Quadrant A Data is divided into 100 sec bins |
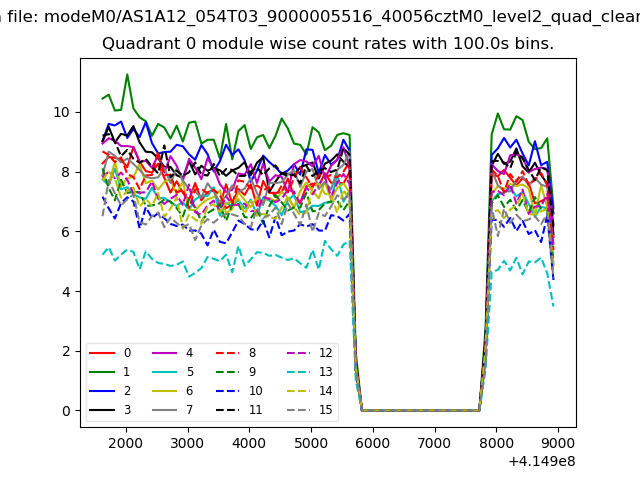 |
 |
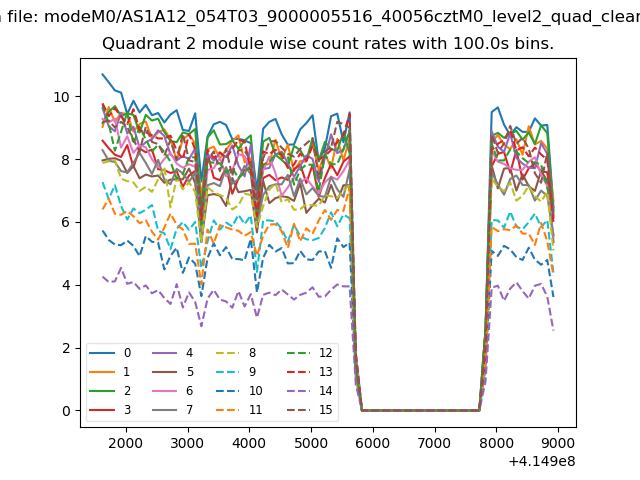
| Module-wise count rates for Quadrant B Data is divided into 100 sec bins |
 |
 |
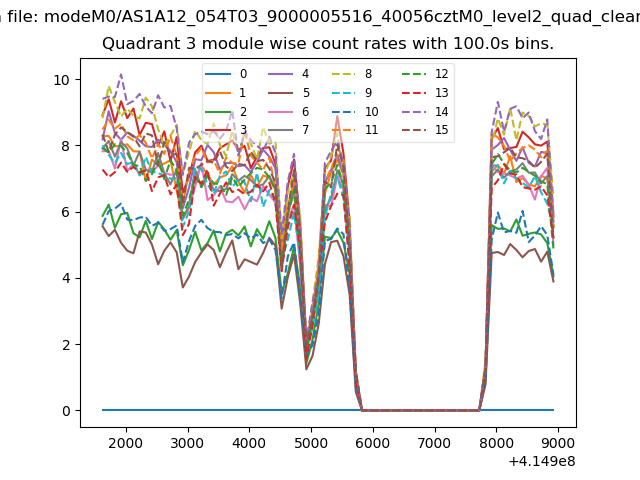
| Module-wise count rates for Quadrant C Data is divided into 100 sec bins |
 |
 |
| Module-wise count rates for Quadrant D Data is divided into 100 sec bins |
 |
 |
| Parameter | Plot |
|---|---|
| CZT HV Monitor | 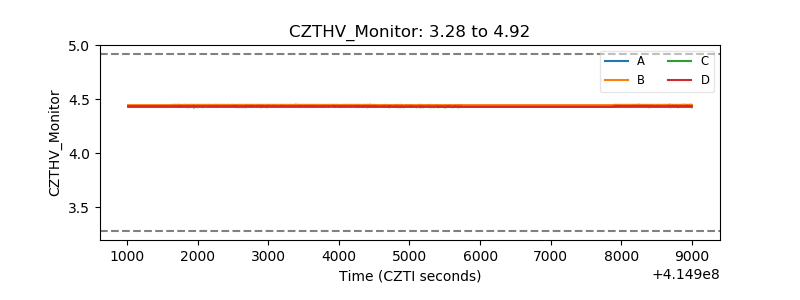 |
| D_VDD | 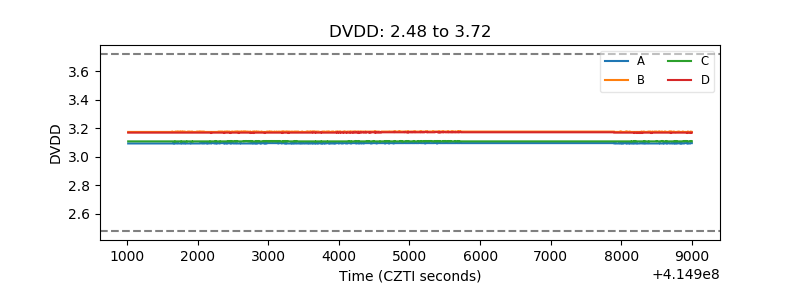 |
| Temperature 1 | 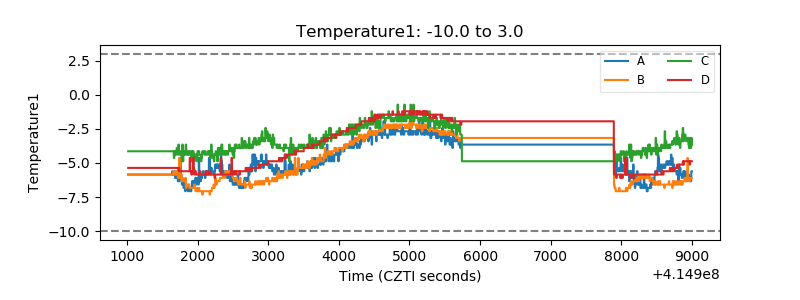 |
| Veto HV Monitor | 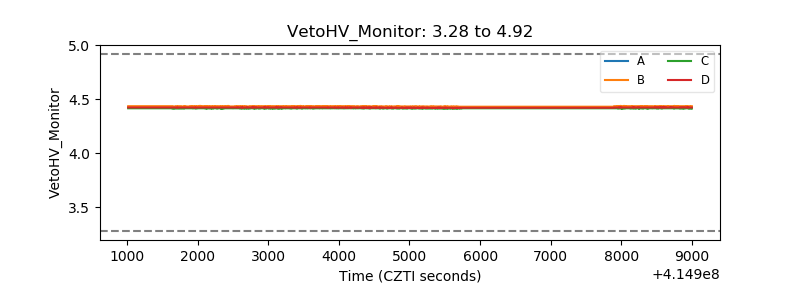 |
| Veto LLD | 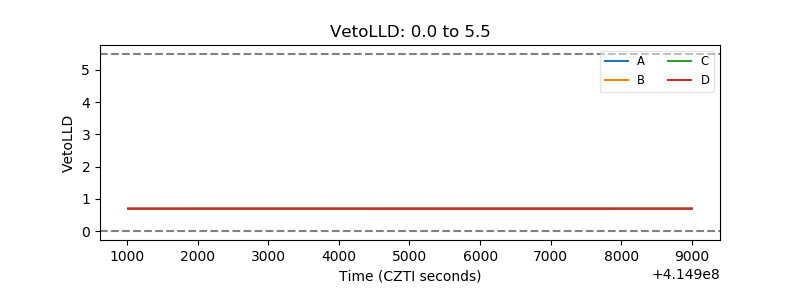 |
| Alpha Counter | 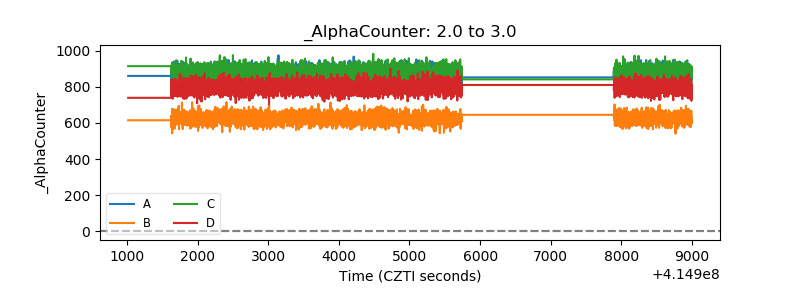 |
| _CPM_Rate | 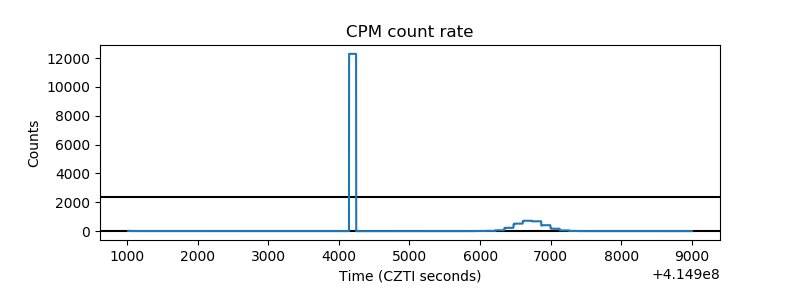 |
| CZT Counter | 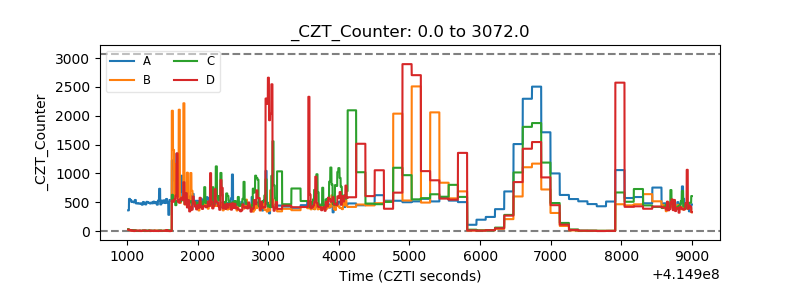 |
| +2.5 Volts monitor | 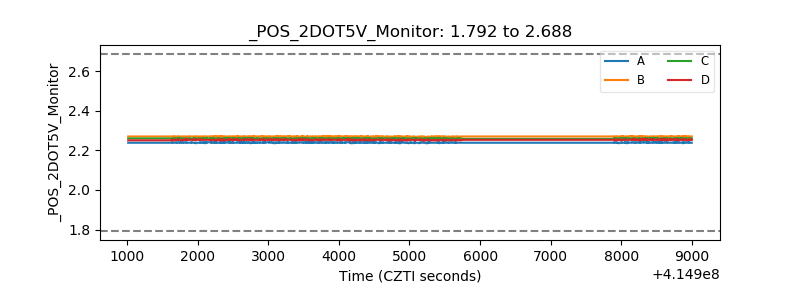 |
| +5 Volts monitor | 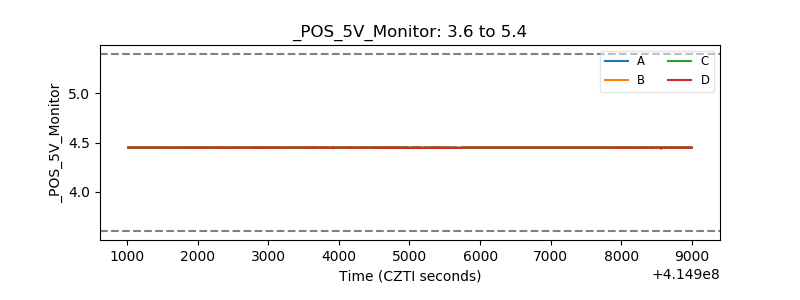 |
| _ROLL_ROT | 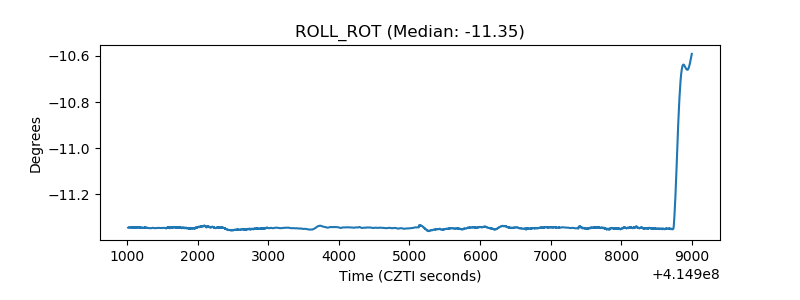 |
| _Roll_DEC | 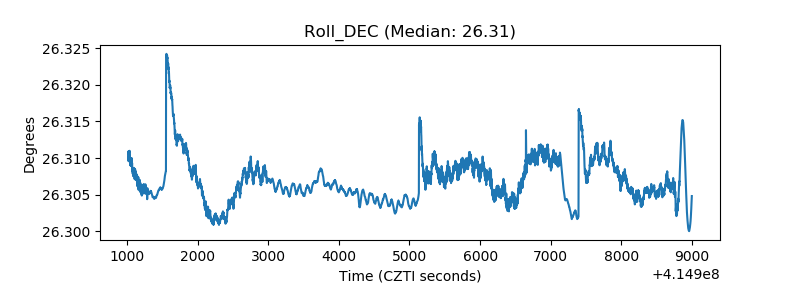 |
| _Roll_RA | 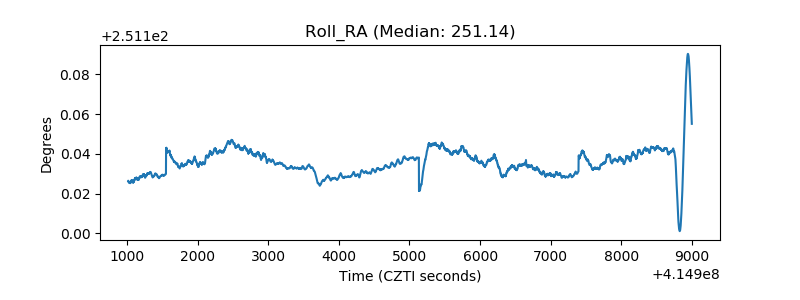 |
| Veto Counter | 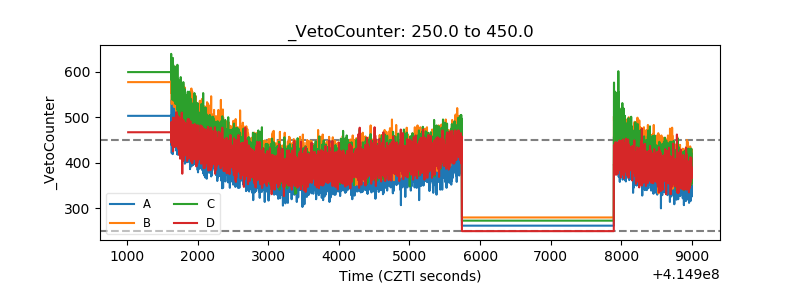 |