| Param | Original file | Final file |
|---|---|---|
| Filename | modeM0/AS1A12_054T03_9000005516_40057cztM0_level2.fits | modeM0/AS1A12_054T03_9000005516_40057cztM0_level2_quad_clean.evt |
| Size (bytes) | 358,208,640 | 88,698,240 |
| Size | 341.6 MB | 84.6 MB |
| Events in quadrant A | 3,015,220 | 600,882 |
| Events in quadrant B | 2,492,677 | 624,595 |
| Events in quadrant C | 4,163,152 | 554,838 |
| Events in quadrant D | 3,177,018 | 535,193 |
| Mode M9 | |||
|---|---|---|---|
| Quadrant | BADHDUFLAG | Total packets | Discarded packets |
| A | 0 | 30 | 0 |
| B | 0 | 30 | 0 |
| C | 0 | 30 | 0 |
| D | 0 | 31 | 0 |
| Mode SS | |||
|---|---|---|---|
| Quadrant | BADHDUFLAG | Total packets | Discarded packets |
| A | 0 | 108 | 0 |
| B | 0 | 108 | 0 |
| C | 0 | 108 | 0 |
| D | 0 | 108 | 0 |
| Mode M0 | |||
|---|---|---|---|
| Quadrant | BADHDUFLAG | Total packets | Discarded packets |
| A | 0 | 12217 | 3 |
| B | 0 | 11012 | 2 |
| C | 0 | 15789 | 2 |
| D | 0 | 13263 | 2 |
| Quadrant | Total seconds | Saturated seconds | Saturation percentage |
|---|---|---|---|
| A | 5287 | 40 | 0.756573% |
| B | 5287 | 10 | 0.189143% |
| C | 5287 | 419 | 7.925099% |
| D | 5287 | 127 | 2.402118% |
Noise dominated data is calculated using 1-second bins in cleaned event files. If a bin has >2000 counts, and if more than 50% of those come from <1% of pixels, then it is considered to be noise-dominated and hence unusable.
| Quadrant | # 1 sec bins | Bins with >0 counts | Bins with >2000 counts | High rate bins dominated by noise | Noise dominated (total time) | Noise dominated (detector-on time) | Marked lightcurve |
|---|---|---|---|---|---|---|---|
| A | 7349 | 5288 | 29 | 29 | 0.39% | 0.55% | 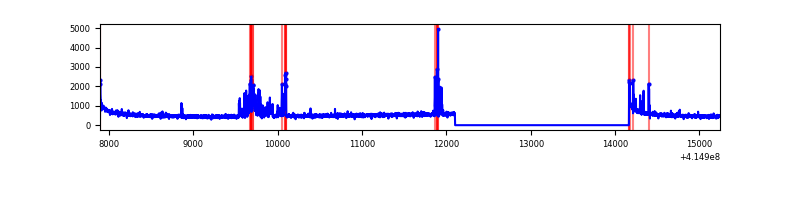 |
| B | 7349 | 5288 | 1 | 1 | 0.01% | 0.02% | 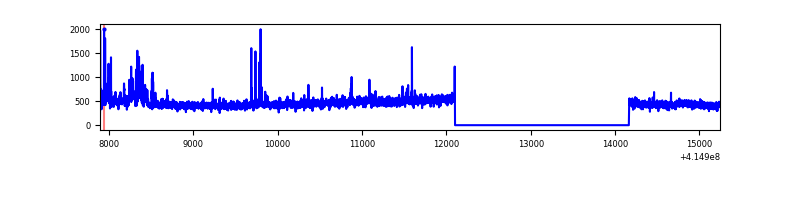 |
| C | 7349 | 5288 | 385 | 385 | 5.24% | 7.28% | 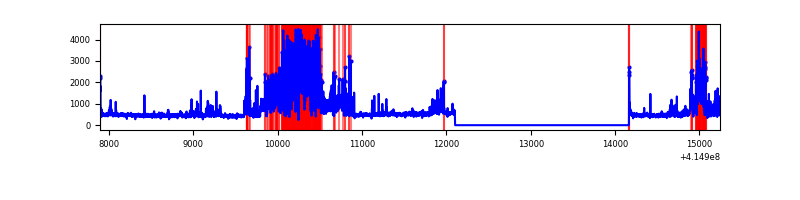 |
| D | 7349 | 5288 | 105 | 105 | 1.43% | 1.99% | 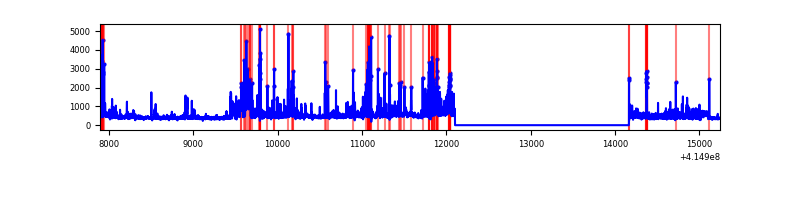 |
Top three noisy pixels from each quadrant. If the there are fewer than three noisy pixels in the level2.evt file, extra rows are filled as -1
| Pixel properties | Quadrant properties | ||||||
|---|---|---|---|---|---|---|---|
| Quadrant | DetID | PixID | Counts | Sigma | Mean | Median | Sigma |
| A | 10 | 83 | 451829 | 3804.02 | 577 | 566 | 118.6 |
| A | 15 | 223 | 218588 | 1837.87 | 577 | 566 | 118.6 |
| A | 7 | 3 | 60657 | 506.55 | 577 | 566 | 118.6 |
| B | 4 | 171 | 94186 | 842.32 | 577 | 564 | 111.1 |
| B | 0 | 221 | 77093 | 688.54 | 577 | 564 | 111.1 |
| B | 0 | 230 | 54095 | 481.62 | 577 | 564 | 111.1 |
| C | 9 | 187 | 1693685 | 13380.22 | 542 | 547 | 126.5 |
| C | 15 | 214 | 211859 | 1669.92 | 542 | 547 | 126.5 |
| C | 14 | 254 | 107288 | 843.53 | 542 | 547 | 126.5 |
| D | 12 | 227 | 432094 | 3173.62 | 556 | 543 | 136.0 |
| D | 2 | 250 | 180430 | 1322.89 | 556 | 543 | 136.0 |
| D | 10 | 246 | 91606 | 669.68 | 556 | 543 | 136.0 |
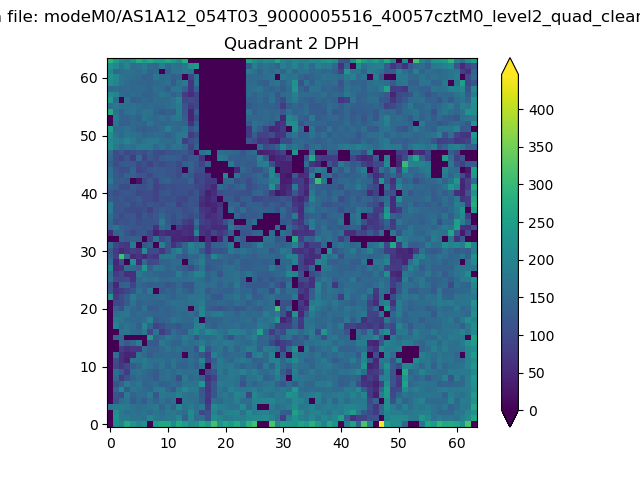
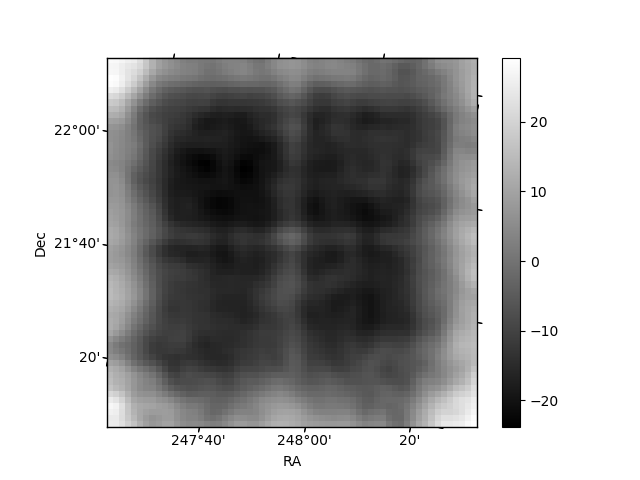
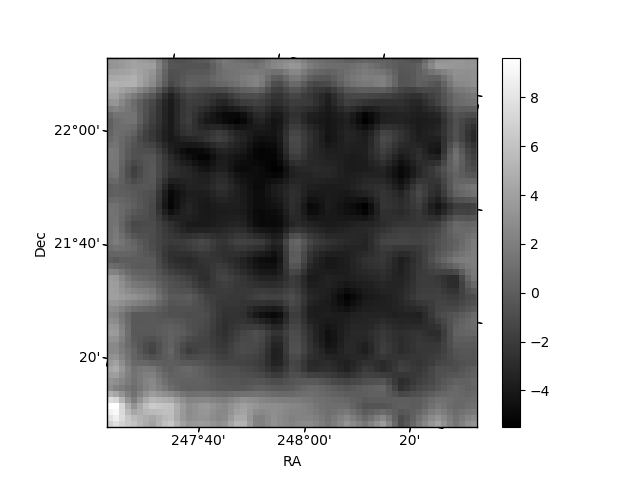
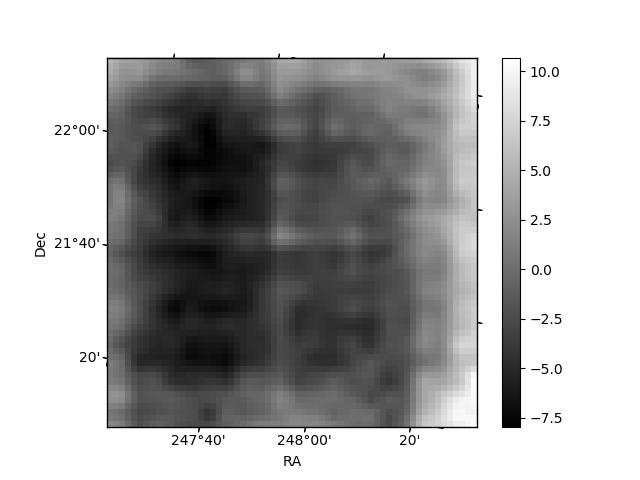
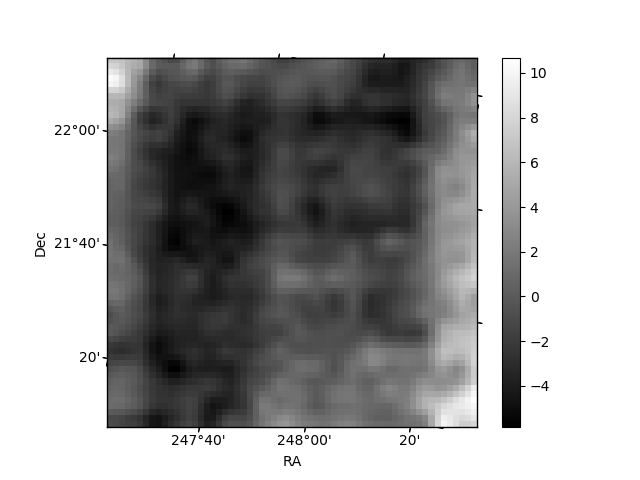
Histogram calculated using DETX and DETY for each event in the final _common_clean file
| Quadrant A | 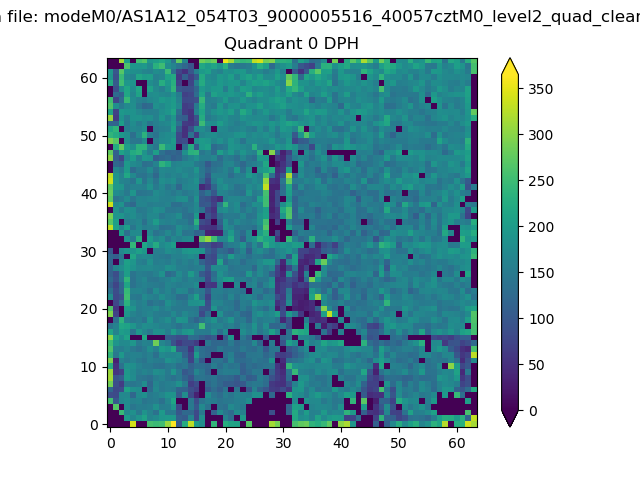 |
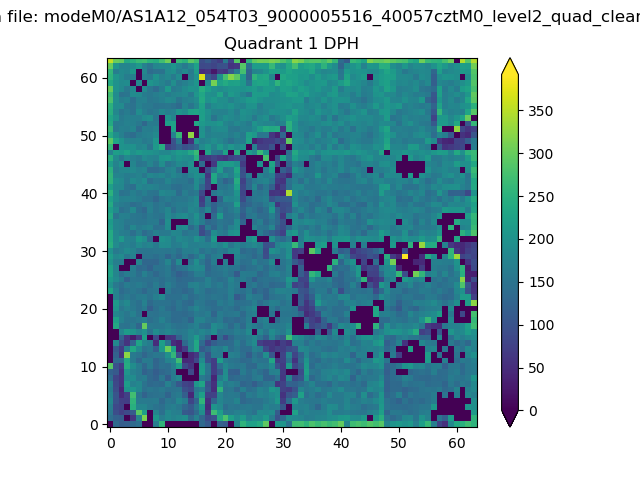 |
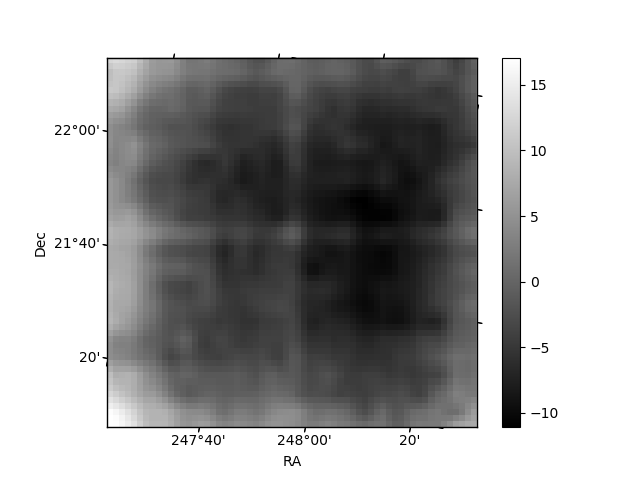
Quadrant B |
|---|---|---|---|
| Quadrant D | 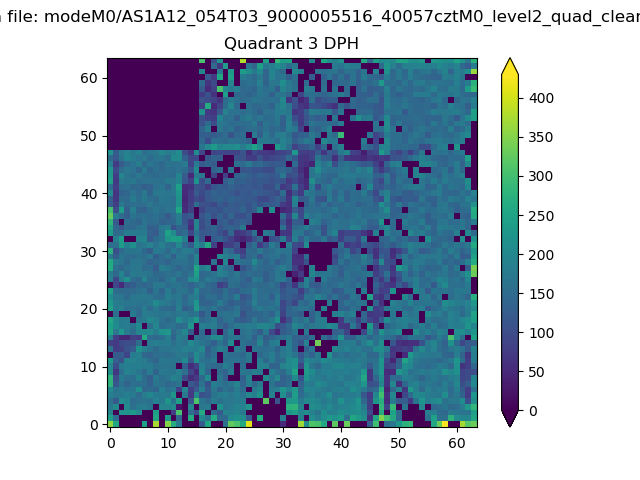 |
 |
Quadrant C |
| Plot type | Count rate plots | Images |
|---|---|---|
| Comparison with Poisson distribution Blue bars denote a histogram of data divided into 1 sec bins. Red curve is a Poisson curve with rate = median count rate of data. |
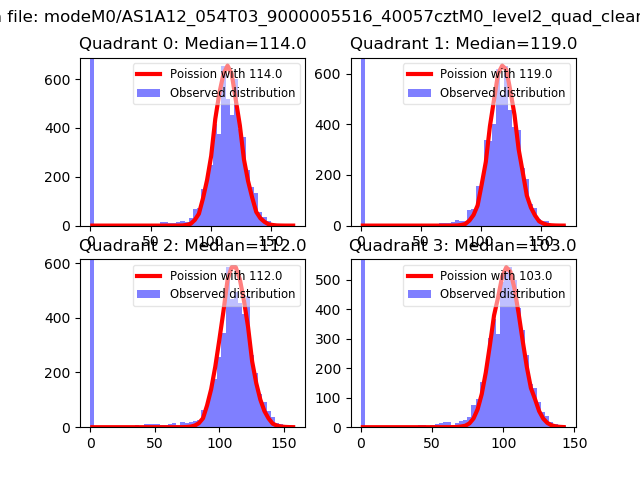 |
 |
| Quadrant-wise count rates Data is divided into 100 sec bins |
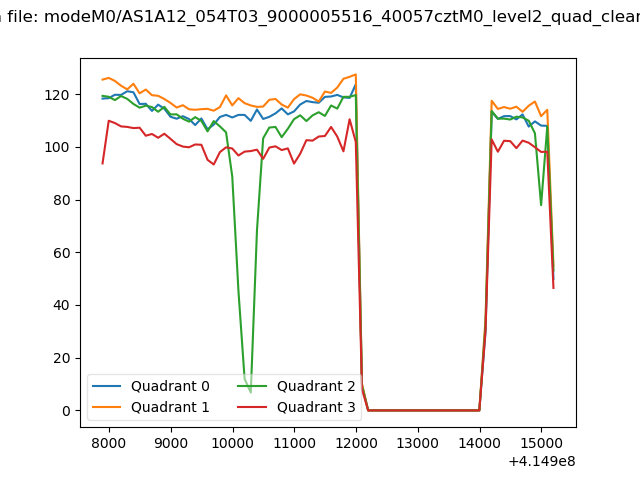 |
|
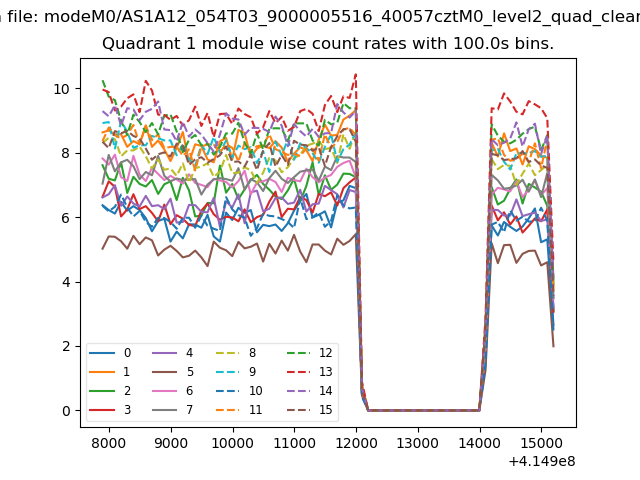
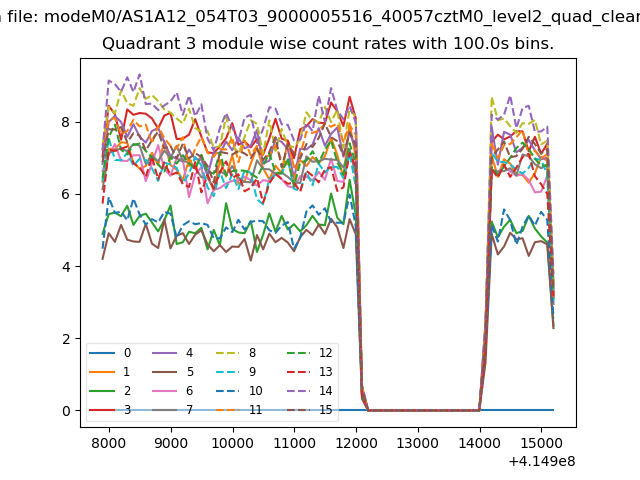
| Module-wise count rates for Quadrant A Data is divided into 100 sec bins |
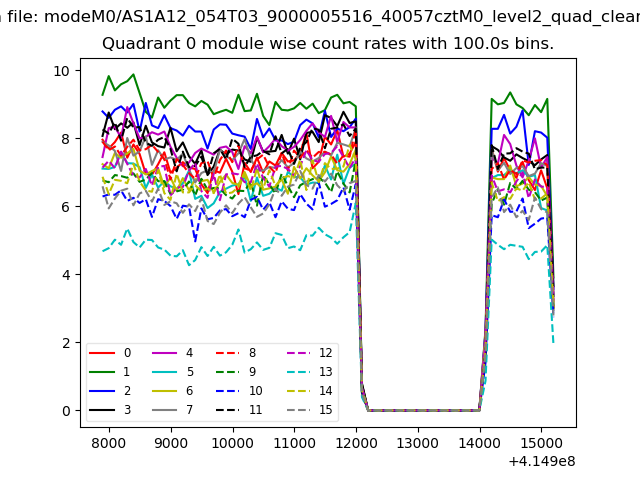 |
 |
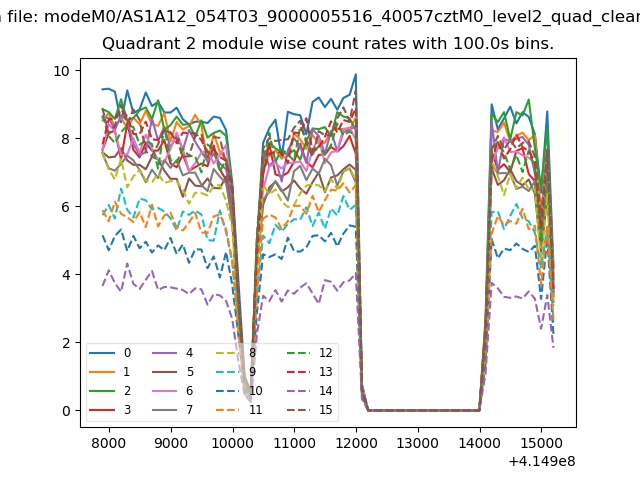
| Module-wise count rates for Quadrant B Data is divided into 100 sec bins |
 |
 |
| Module-wise count rates for Quadrant C Data is divided into 100 sec bins |
 |
 |
| Module-wise count rates for Quadrant D Data is divided into 100 sec bins |
 |
 |
| Parameter | Plot |
|---|---|
| CZT HV Monitor | 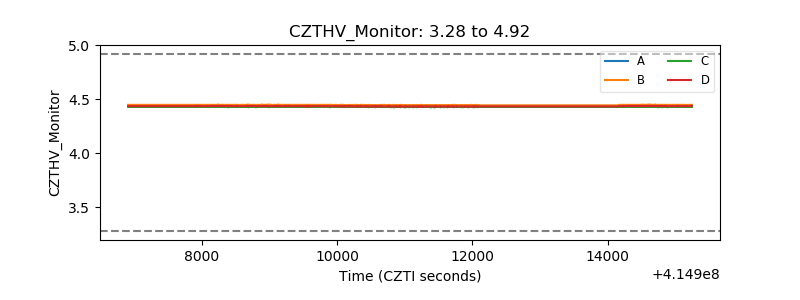 |
| D_VDD | 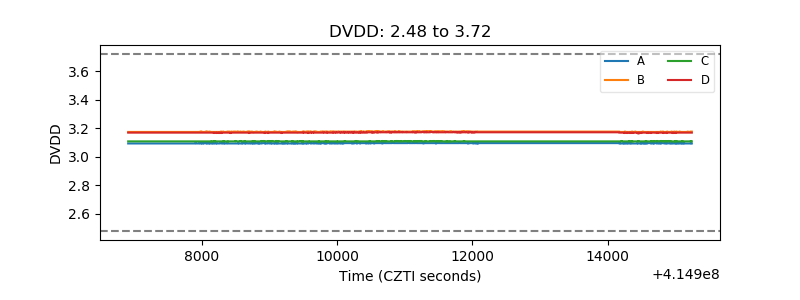 |
| Temperature 1 | 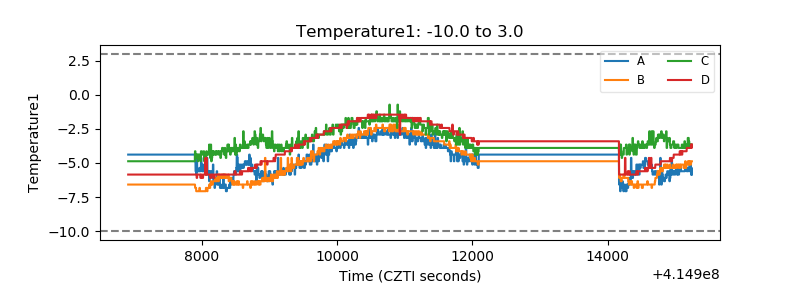 |
| Veto HV Monitor | 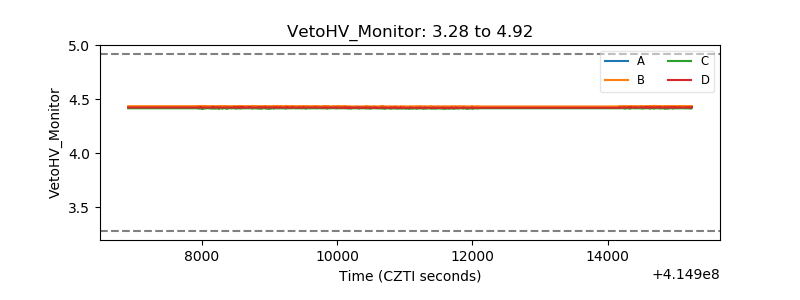 |
| Veto LLD | 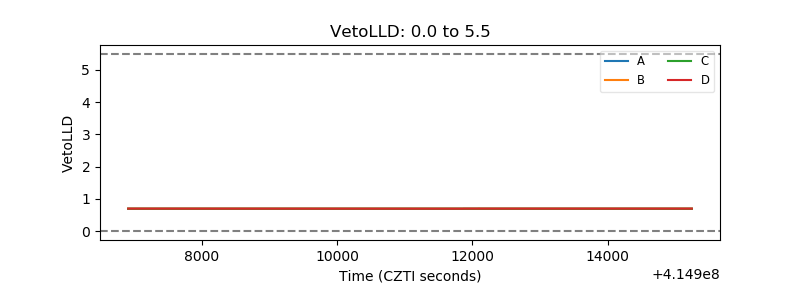 |
| Alpha Counter | 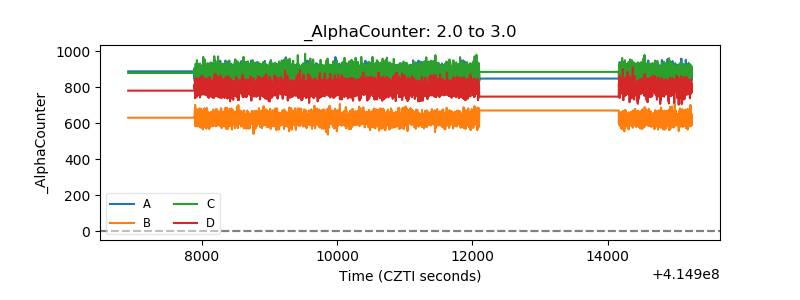 |
| _CPM_Rate | 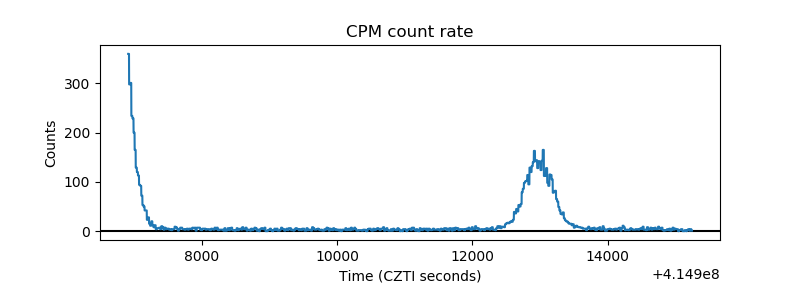 |
| CZT Counter | 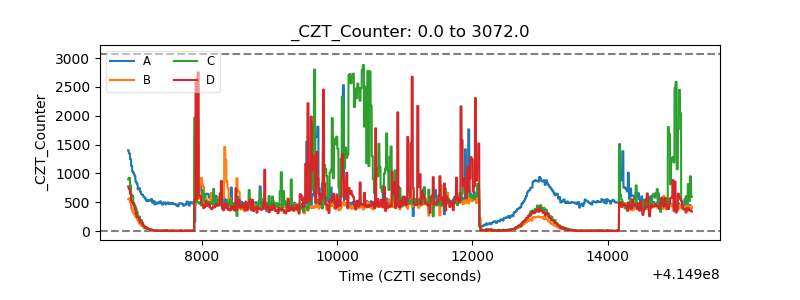 |
| +2.5 Volts monitor | 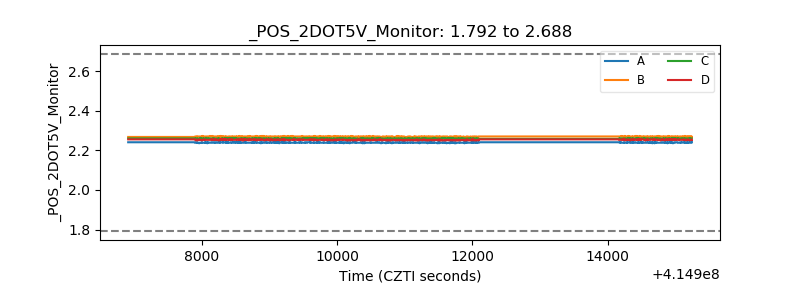 |
| +5 Volts monitor | 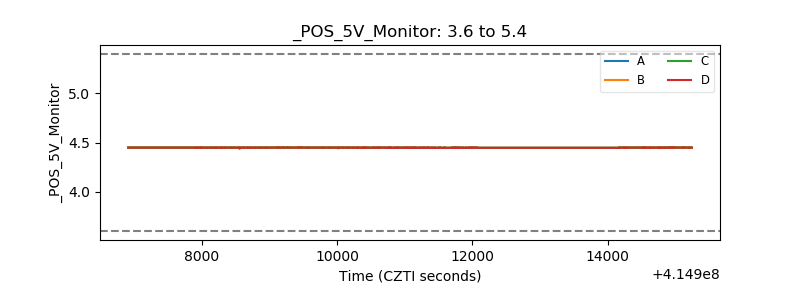 |
| _ROLL_ROT | 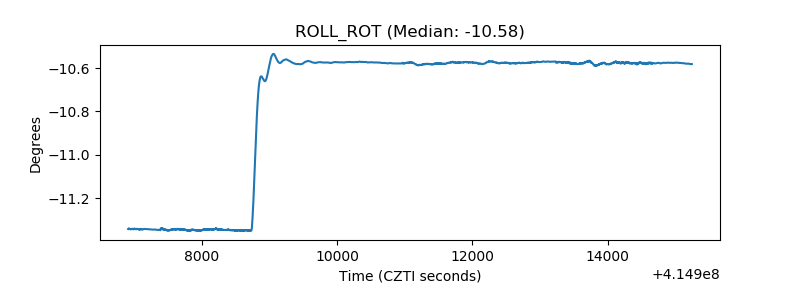 |
| _Roll_DEC | 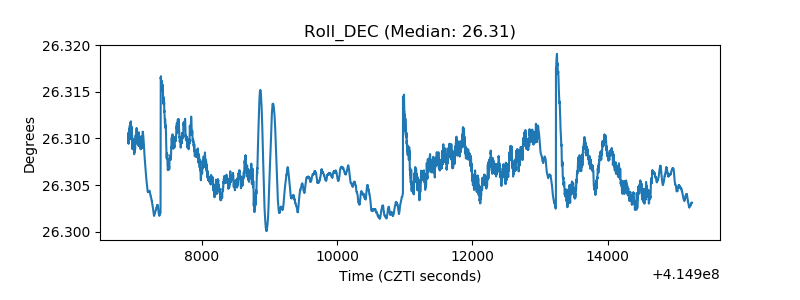 |
| _Roll_RA | 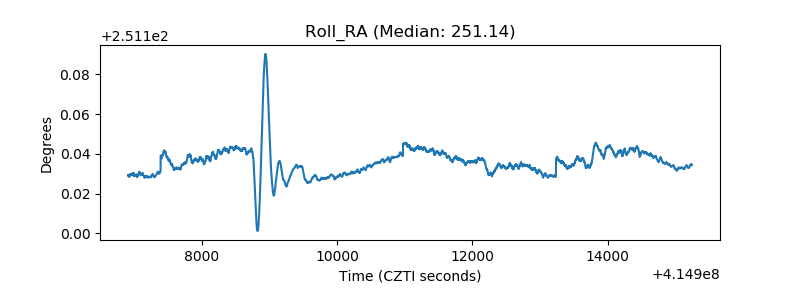 |
| Veto Counter | 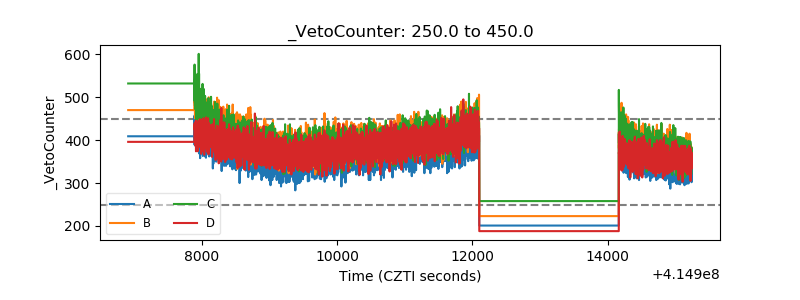 |