| Param | Original file | Final file |
|---|---|---|
| Filename | modeM0/AS1A12_054T03_9000005516_40058cztM0_level2.fits | modeM0/AS1A12_054T03_9000005516_40058cztM0_level2_quad_clean.evt |
| Size (bytes) | 367,819,200 | 88,525,440 |
| Size | 350.8 MB | 84.4 MB |
| Events in quadrant A | 2,798,816 | 597,439 |
| Events in quadrant B | 3,204,659 | 596,278 |
| Events in quadrant C | 4,147,514 | 576,769 |
| Events in quadrant D | 3,042,593 | 530,712 |
| Mode M9 | |||
|---|---|---|---|
| Quadrant | BADHDUFLAG | Total packets | Discarded packets |
| A | 0 | 25 | 0 |
| B | 0 | 25 | 0 |
| C | 0 | 25 | 0 |
| D | 0 | 26 | 0 |
| Mode SS | |||
|---|---|---|---|
| Quadrant | BADHDUFLAG | Total packets | Discarded packets |
| A | 0 | 110 | 0 |
| B | 0 | 110 | 0 |
| C | 0 | 110 | 0 |
| D | 0 | 110 | 0 |
| Mode M0 | |||
|---|---|---|---|
| Quadrant | BADHDUFLAG | Total packets | Discarded packets |
| A | 0 | 11550 | 3 |
| B | 0 | 13309 | 2 |
| C | 0 | 15977 | 2 |
| D | 0 | 12933 | 2 |
| Quadrant | Total seconds | Saturated seconds | Saturation percentage |
|---|---|---|---|
| A | 5421 | 15 | 0.276702% |
| B | 5421 | 276 | 5.091312% |
| C | 5421 | 188 | 3.467995% |
| D | 5421 | 137 | 2.527209% |
Noise dominated data is calculated using 1-second bins in cleaned event files. If a bin has >2000 counts, and if more than 50% of those come from <1% of pixels, then it is considered to be noise-dominated and hence unusable.
| Quadrant | # 1 sec bins | Bins with >0 counts | Bins with >2000 counts | High rate bins dominated by noise | Noise dominated (total time) | Noise dominated (detector-on time) | Marked lightcurve |
|---|---|---|---|---|---|---|---|
| A | 7214 | 5422 | 7 | 7 | 0.10% | 0.13% | 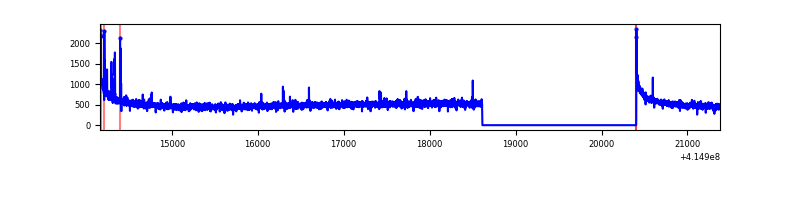 |
| B | 7214 | 5422 | 166 | 166 | 2.30% | 3.06% | 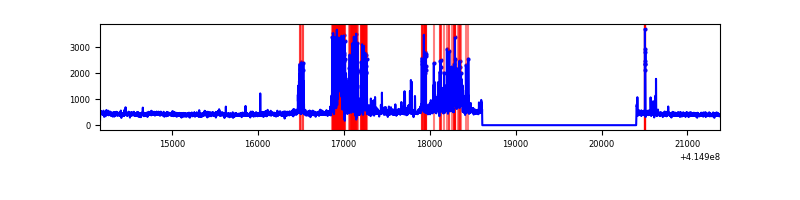 |
| C | 7214 | 5422 | 164 | 164 | 2.27% | 3.02% | 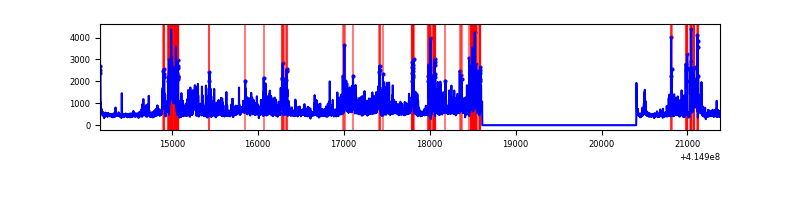 |
| D | 7214 | 5422 | 109 | 109 | 1.51% | 2.01% | 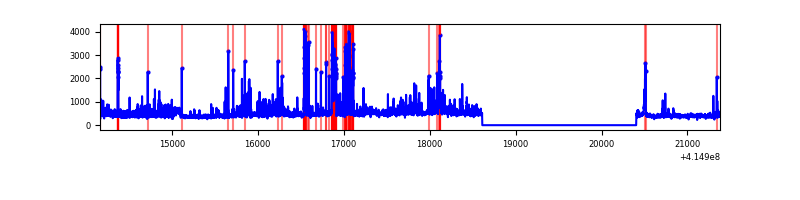 |
Top three noisy pixels from each quadrant. If the there are fewer than three noisy pixels in the level2.evt file, extra rows are filled as -1
| Pixel properties | Quadrant properties | ||||||
|---|---|---|---|---|---|---|---|
| Quadrant | DetID | PixID | Counts | Sigma | Mean | Median | Sigma |
| A | 10 | 83 | 465859 | 3854.06 | 590 | 578 | 120.7 |
| A | 6 | 10 | 34362 | 279.84 | 590 | 578 | 120.7 |
| A | 7 | 3 | 8279 | 63.79 | 590 | 578 | 120.7 |
| B | 4 | 171 | 821098 | 7278.03 | 574 | 559 | 112.7 |
| B | 0 | 230 | 72329 | 636.59 | 574 | 559 | 112.7 |
| B | 0 | 221 | 34546 | 301.46 | 574 | 559 | 112.7 |
| C | 9 | 187 | 1583454 | 11907.13 | 569 | 572 | 132.9 |
| C | 15 | 214 | 222575 | 1670.0 | 569 | 572 | 132.9 |
| C | 14 | 254 | 94357 | 705.49 | 569 | 572 | 132.9 |
| D | 12 | 227 | 534886 | 3780.34 | 572 | 554 | 141.3 |
| D | 2 | 250 | 98551 | 693.32 | 572 | 554 | 141.3 |
| D | 9 | 19 | 80426 | 565.09 | 572 | 554 | 141.3 |
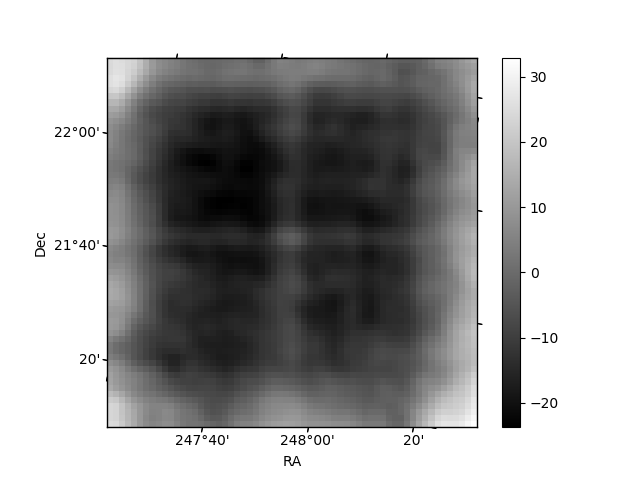
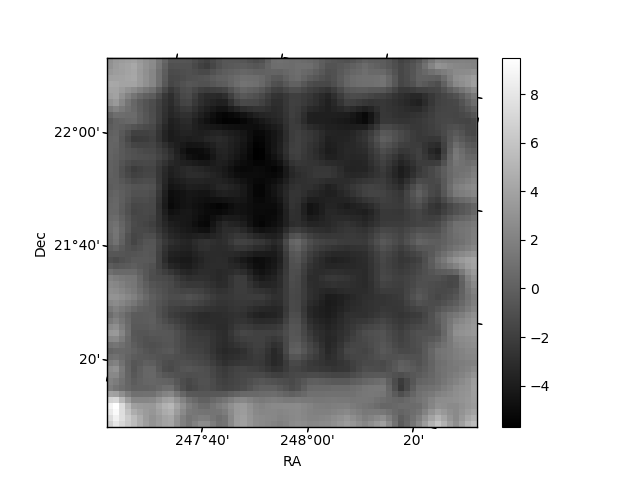
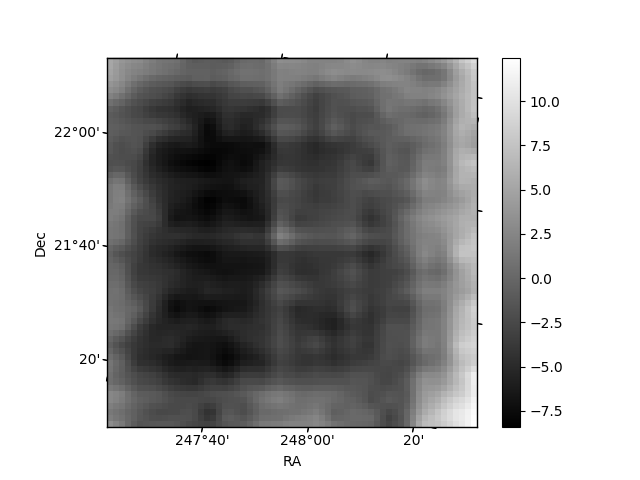
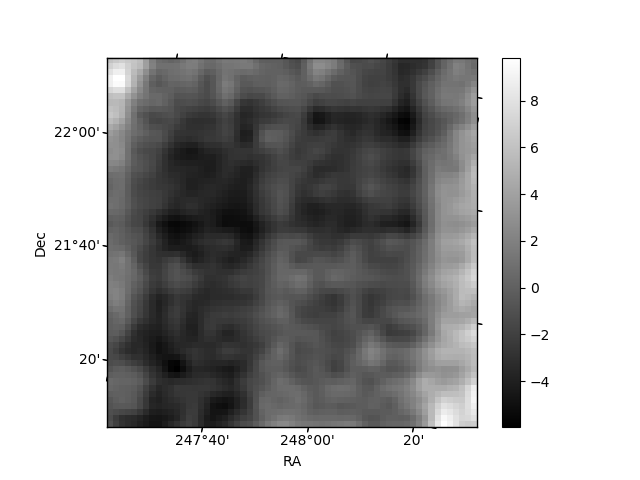
Histogram calculated using DETX and DETY for each event in the final _common_clean file
| Quadrant A | 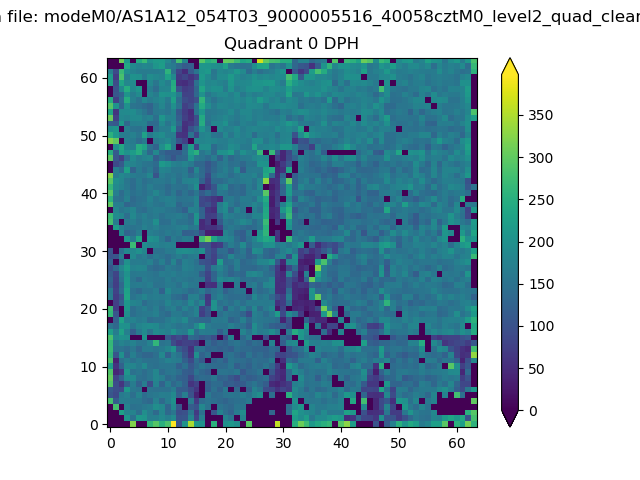 |
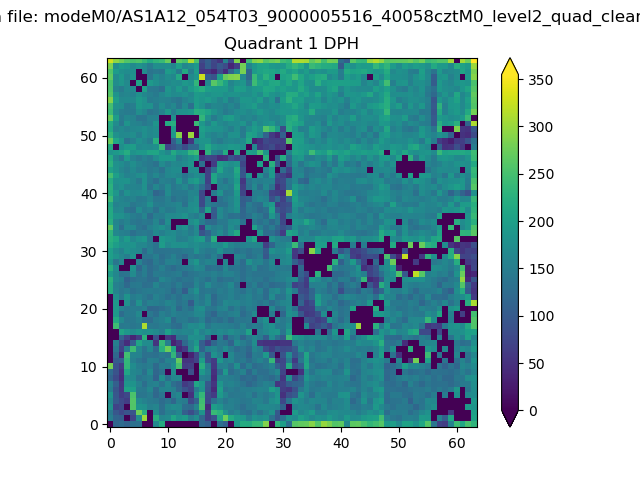 |
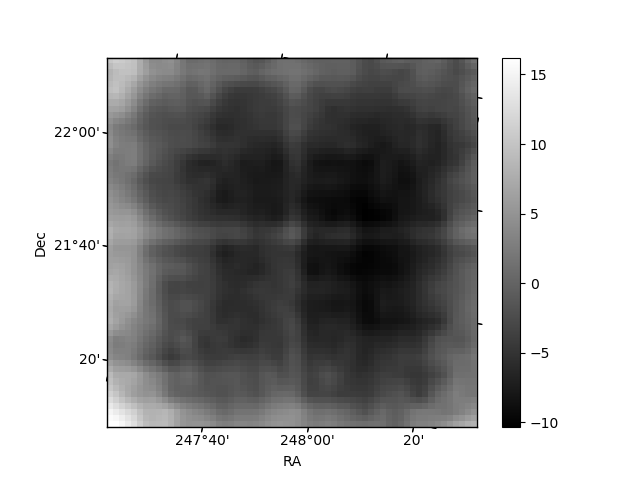
Quadrant B |
|---|---|---|---|
| Quadrant D | 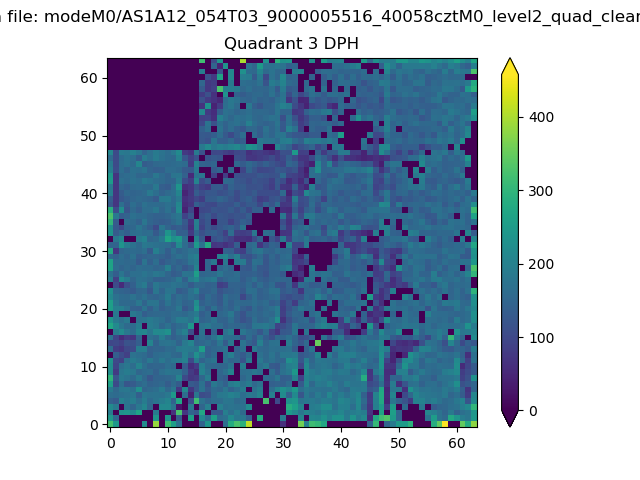 |
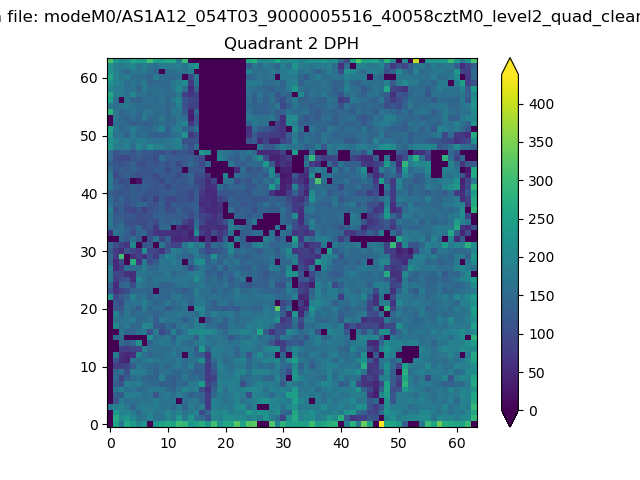 |
Quadrant C |
| Plot type | Count rate plots | Images |
|---|---|---|
| Comparison with Poisson distribution Blue bars denote a histogram of data divided into 1 sec bins. Red curve is a Poisson curve with rate = median count rate of data. |
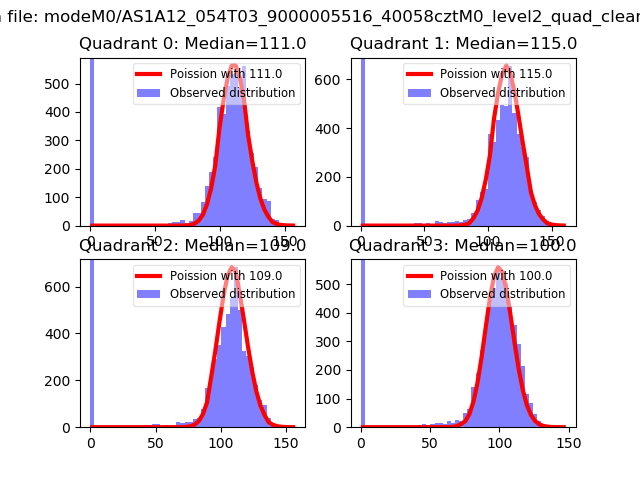 |
 |
| Quadrant-wise count rates Data is divided into 100 sec bins |
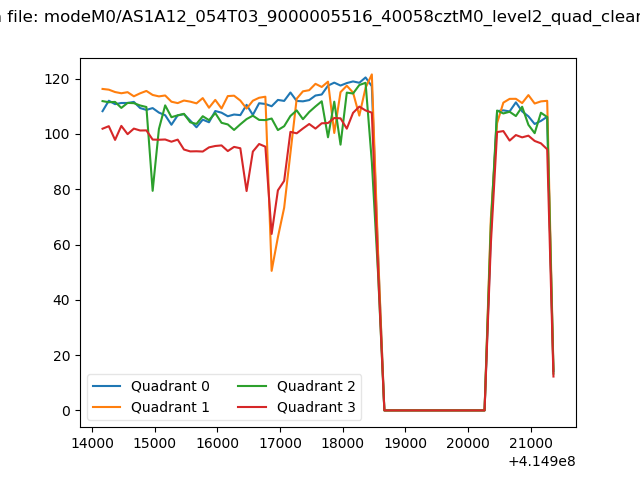 |
|
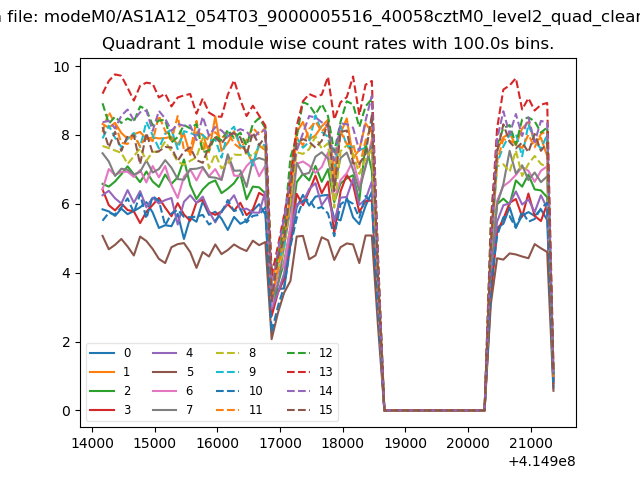
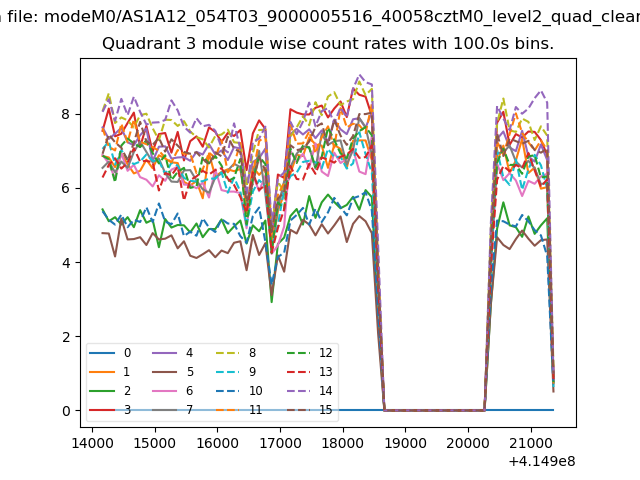
| Module-wise count rates for Quadrant A Data is divided into 100 sec bins |
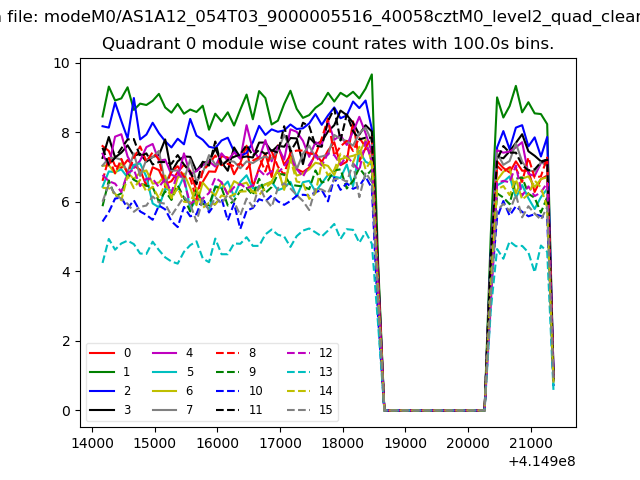 |
 |
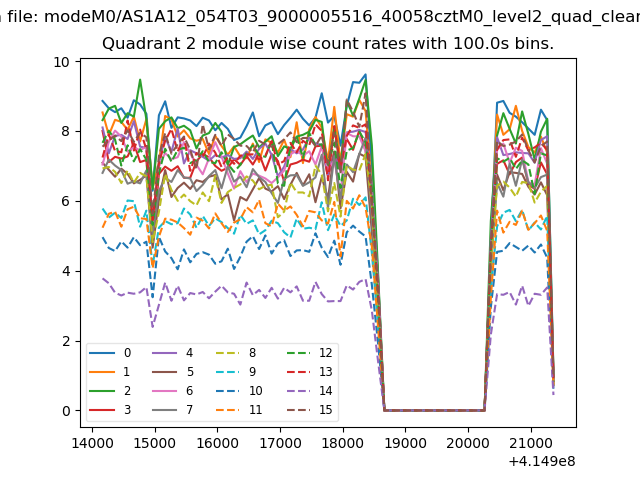
| Module-wise count rates for Quadrant B Data is divided into 100 sec bins |
 |
 |
| Module-wise count rates for Quadrant C Data is divided into 100 sec bins |
 |
 |
| Module-wise count rates for Quadrant D Data is divided into 100 sec bins |
 |
 |
| Parameter | Plot |
|---|---|
| CZT HV Monitor | 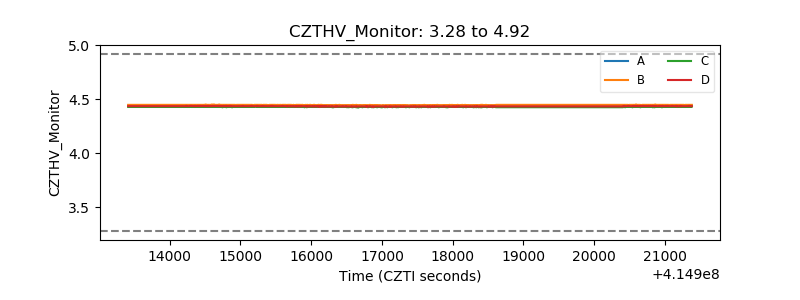 |
| D_VDD | 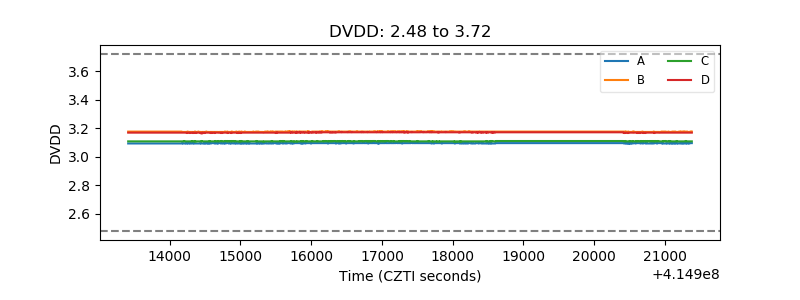 |
| Temperature 1 | 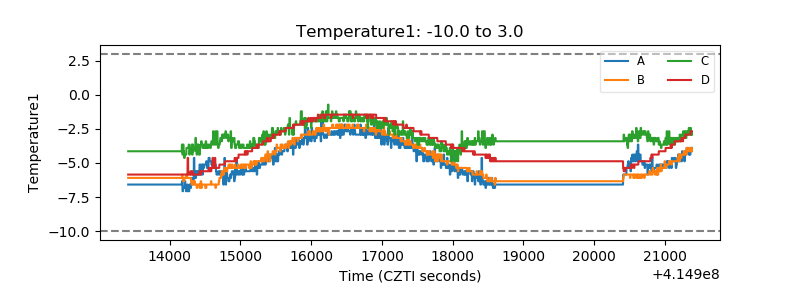 |
| Veto HV Monitor | 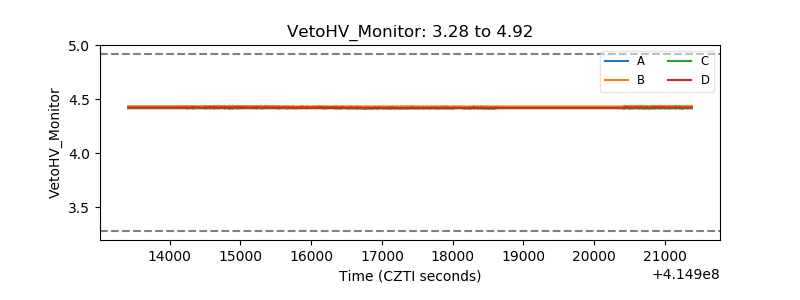 |
| Veto LLD | 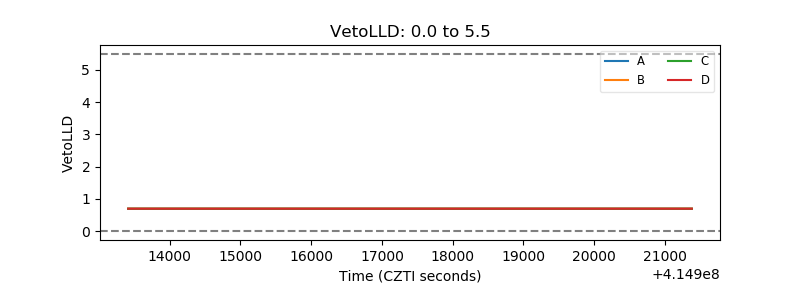 |
| Alpha Counter | 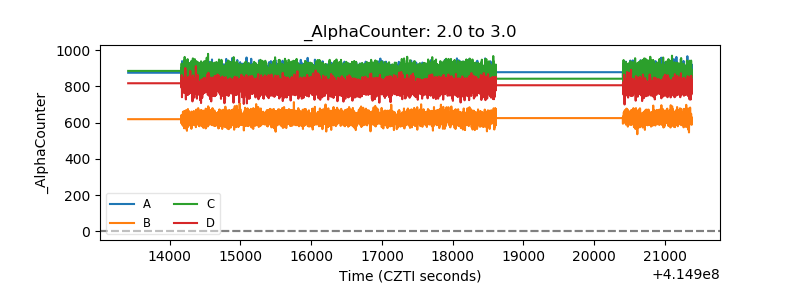 |
| _CPM_Rate | 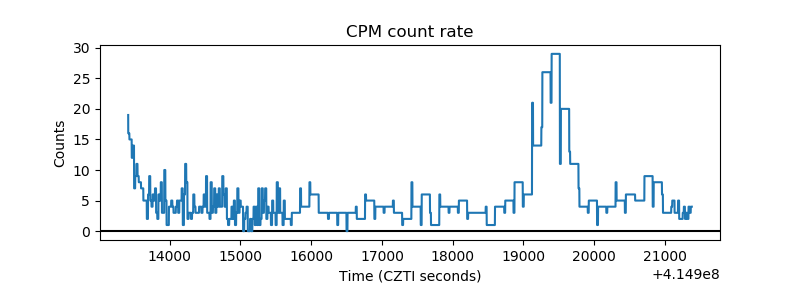 |
| CZT Counter | 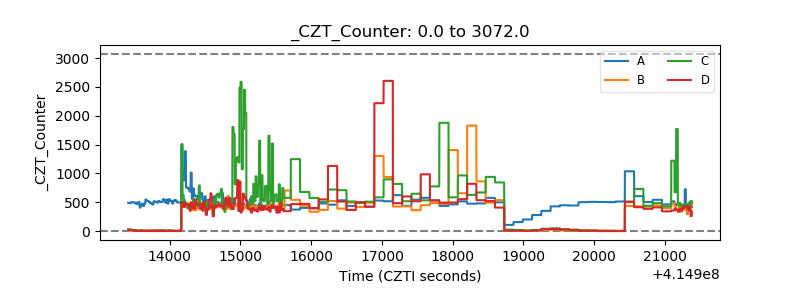 |
| +2.5 Volts monitor | 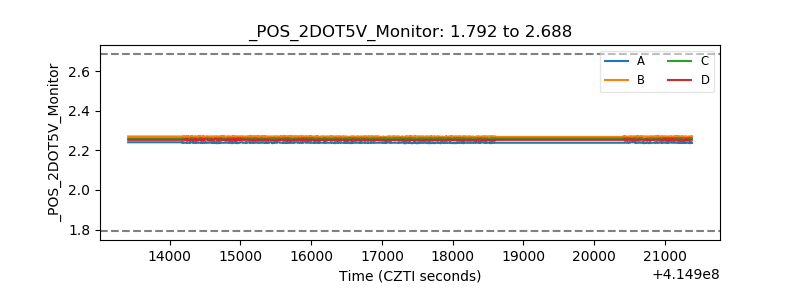 |
| +5 Volts monitor | 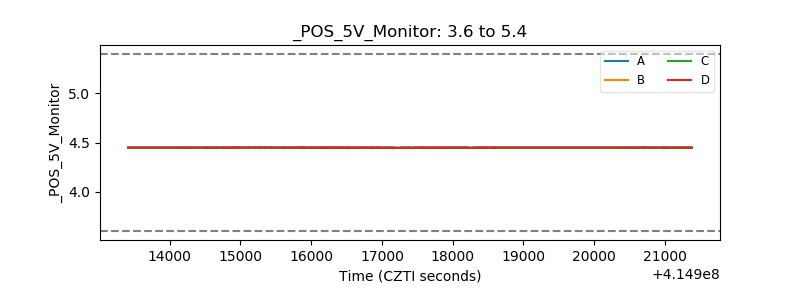 |
| _ROLL_ROT | 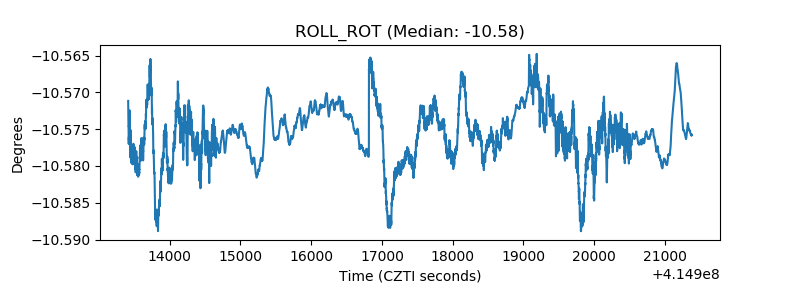 |
| _Roll_DEC | 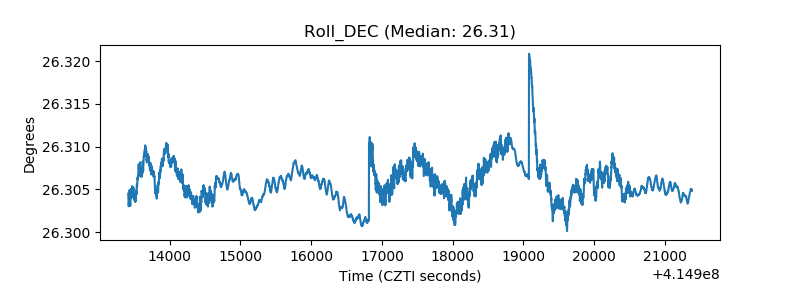 |
| _Roll_RA | 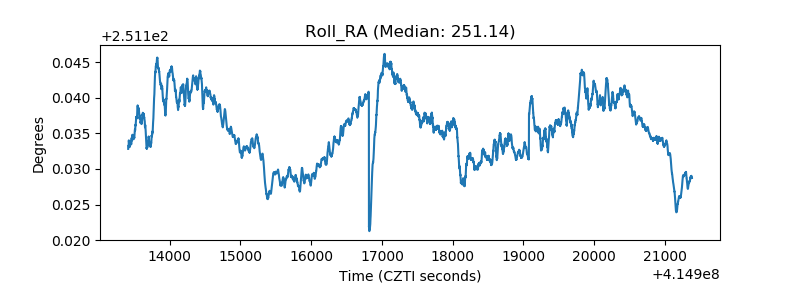 |
| Veto Counter | 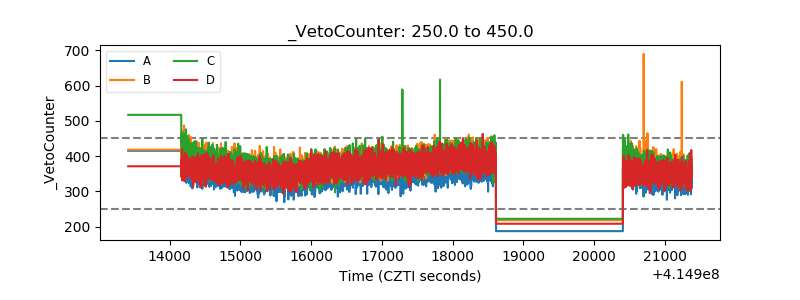 |