| Param | Original file | Final file |
|---|---|---|
| Filename | modeM0/AS1A12_054T03_9000005516_40059cztM0_level2.fits | modeM0/AS1A12_054T03_9000005516_40059cztM0_level2_quad_clean.evt |
| Size (bytes) | 394,009,920 | 90,331,200 |
| Size | 375.8 MB | 86.1 MB |
| Events in quadrant A | 2,927,373 | 611,838 |
| Events in quadrant B | 3,324,305 | 614,524 |
| Events in quadrant C | 4,792,999 | 564,515 |
| Events in quadrant D | 3,100,745 | 548,982 |
| Mode M9 | |||
|---|---|---|---|
| Quadrant | BADHDUFLAG | Total packets | Discarded packets |
| A | 0 | 18 | 0 |
| B | 0 | 18 | 0 |
| C | 0 | 18 | 0 |
| D | 0 | 19 | 0 |
| Mode SS | |||
|---|---|---|---|
| Quadrant | BADHDUFLAG | Total packets | Discarded packets |
| A | 0 | 116 | 0 |
| B | 0 | 116 | 0 |
| C | 0 | 116 | 0 |
| D | 0 | 116 | 0 |
| Mode M0 | |||
|---|---|---|---|
| Quadrant | BADHDUFLAG | Total packets | Discarded packets |
| A | 0 | 12044 | 3 |
| B | 0 | 13835 | 2 |
| C | 0 | 17842 | 2 |
| D | 0 | 13262 | 2 |
| Quadrant | Total seconds | Saturated seconds | Saturation percentage |
|---|---|---|---|
| A | 5647 | 14 | 0.247919% |
| B | 5647 | 267 | 4.728174% |
| C | 5647 | 537 | 9.509474% |
| D | 5647 | 92 | 1.629184% |
Noise dominated data is calculated using 1-second bins in cleaned event files. If a bin has >2000 counts, and if more than 50% of those come from <1% of pixels, then it is considered to be noise-dominated and hence unusable.
| Quadrant | # 1 sec bins | Bins with >0 counts | Bins with >2000 counts | High rate bins dominated by noise | Noise dominated (total time) | Noise dominated (detector-on time) | Marked lightcurve |
|---|---|---|---|---|---|---|---|
| A | 7111 | 5648 | 7 | 7 | 0.10% | 0.12% | 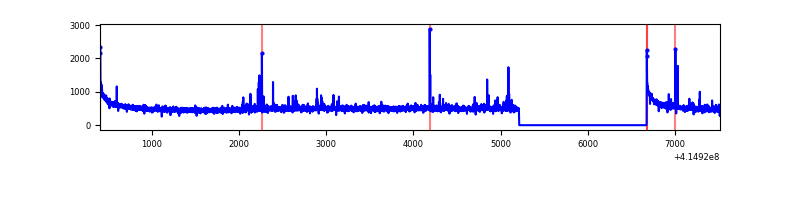 |
| B | 7111 | 5648 | 136 | 136 | 1.91% | 2.41% | 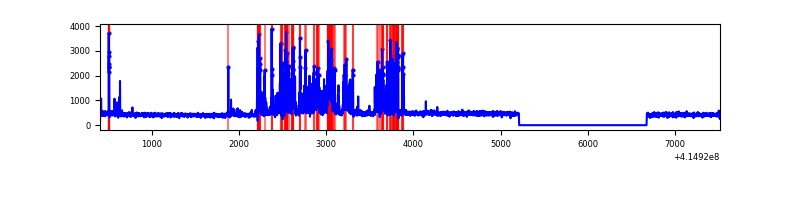 |
| C | 7111 | 5648 | 488 | 488 | 6.86% | 8.64% | 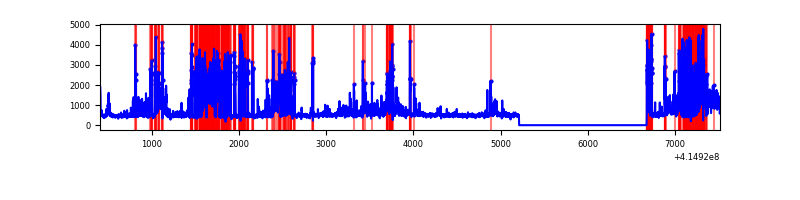 |
| D | 7111 | 5648 | 79 | 79 | 1.11% | 1.40% | 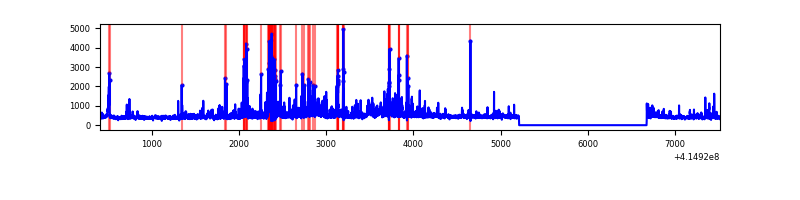 |
Top three noisy pixels from each quadrant. If the there are fewer than three noisy pixels in the level2.evt file, extra rows are filled as -1
| Pixel properties | Quadrant properties | ||||||
|---|---|---|---|---|---|---|---|
| Quadrant | DetID | PixID | Counts | Sigma | Mean | Median | Sigma |
| A | 10 | 83 | 481789 | 3835.23 | 614 | 601 | 125.5 |
| A | 9 | 143 | 53281 | 419.88 | 614 | 601 | 125.5 |
| A | 13 | 254 | 7657 | 56.24 | 614 | 601 | 125.5 |
| B | 4 | 171 | 874747 | 7381.47 | 602 | 585 | 118.4 |
| B | 0 | 230 | 46934 | 391.37 | 602 | 585 | 118.4 |
| B | 0 | 221 | 19075 | 156.13 | 602 | 585 | 118.4 |
| C | 9 | 187 | 2103089 | 15353.82 | 582 | 586 | 136.9 |
| C | 15 | 214 | 228522 | 1664.53 | 582 | 586 | 136.9 |
| C | 14 | 254 | 166577 | 1212.17 | 582 | 586 | 136.9 |
| D | 12 | 227 | 181321 | 1226.79 | 596 | 578 | 147.3 |
| D | 13 | 249 | 157650 | 1066.12 | 596 | 578 | 147.3 |
| D | 1 | 47 | 149672 | 1011.97 | 596 | 578 | 147.3 |
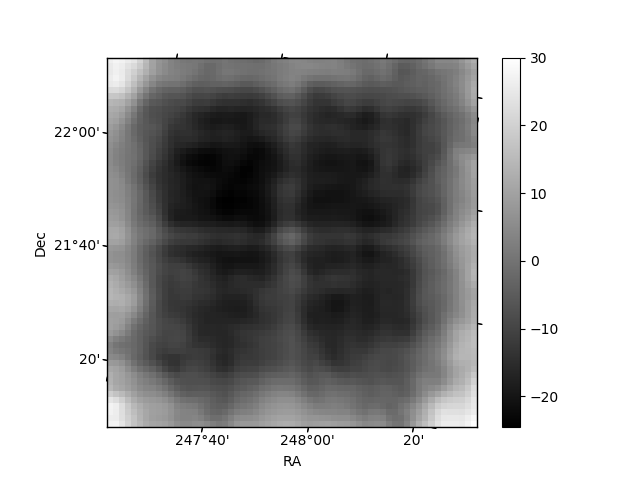
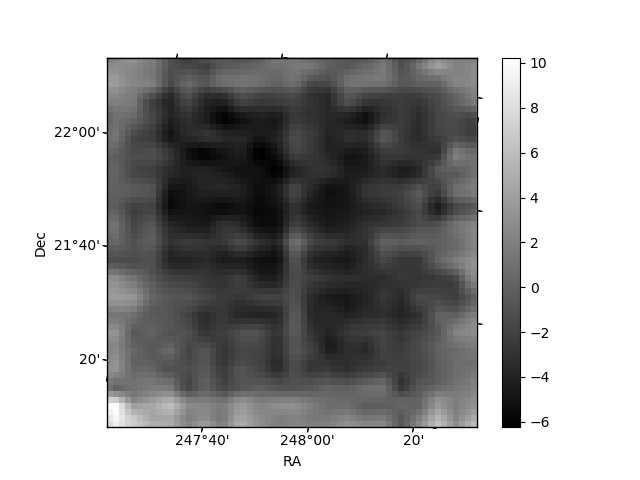
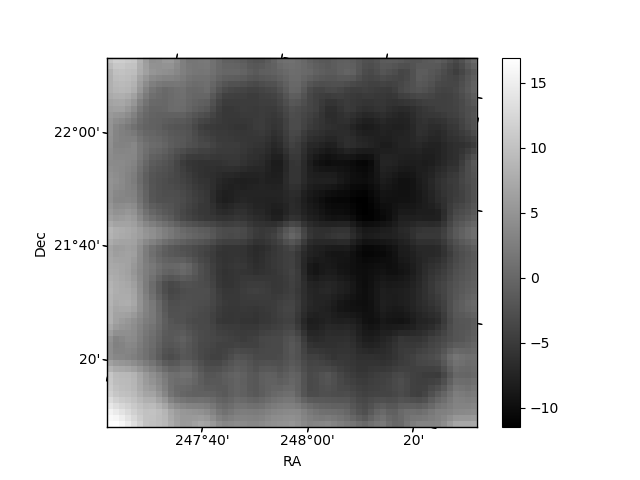
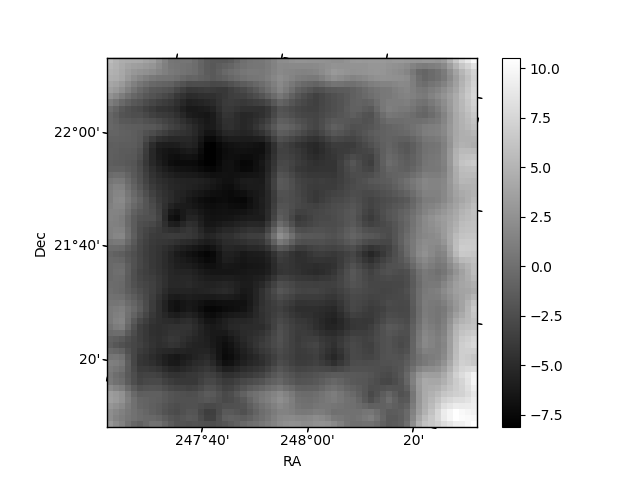
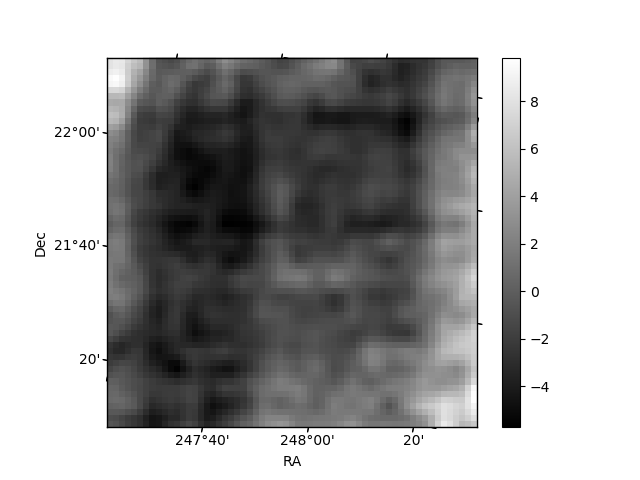
Histogram calculated using DETX and DETY for each event in the final _common_clean file
| Quadrant A | 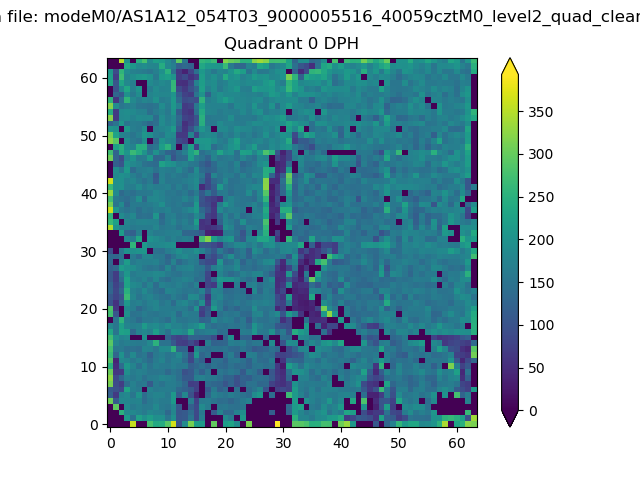 |
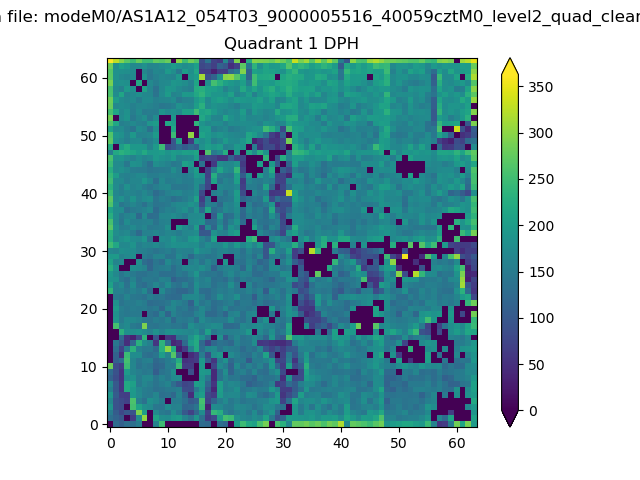 |
Quadrant B |
|---|---|---|---|
| Quadrant D | 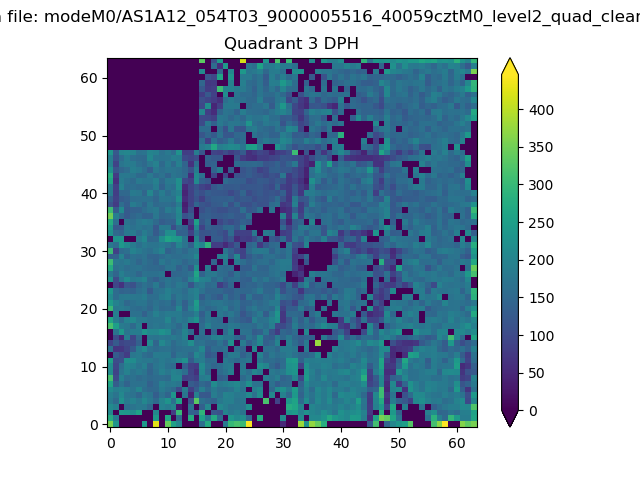 |
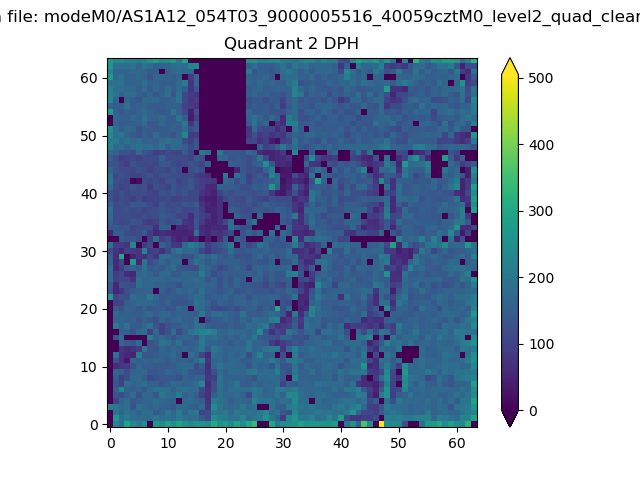 |
Quadrant C |
| Plot type | Count rate plots | Images |
|---|---|---|
| Comparison with Poisson distribution Blue bars denote a histogram of data divided into 1 sec bins. Red curve is a Poisson curve with rate = median count rate of data. |
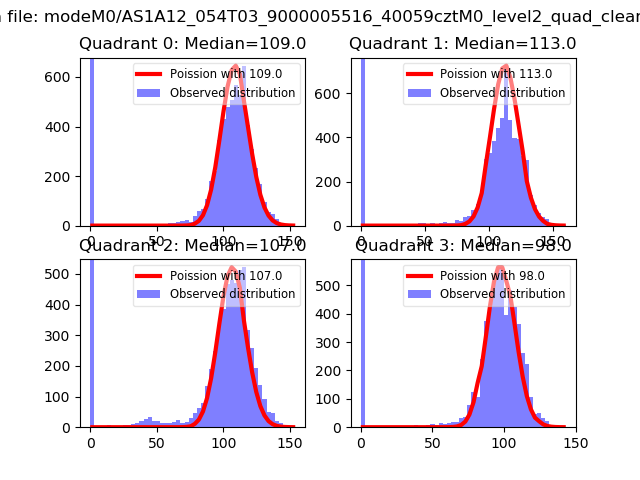 |
 |
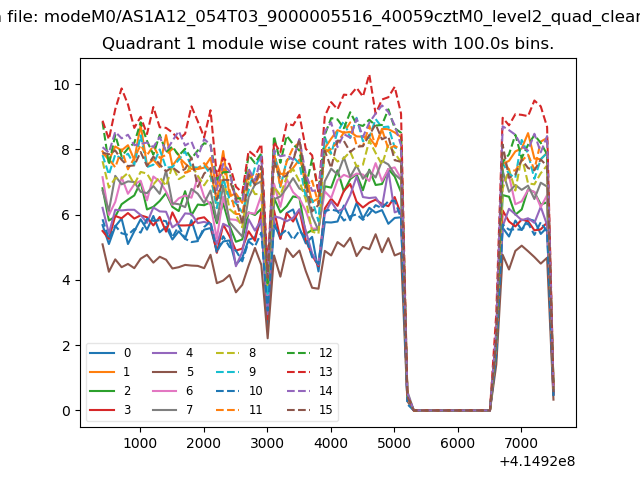
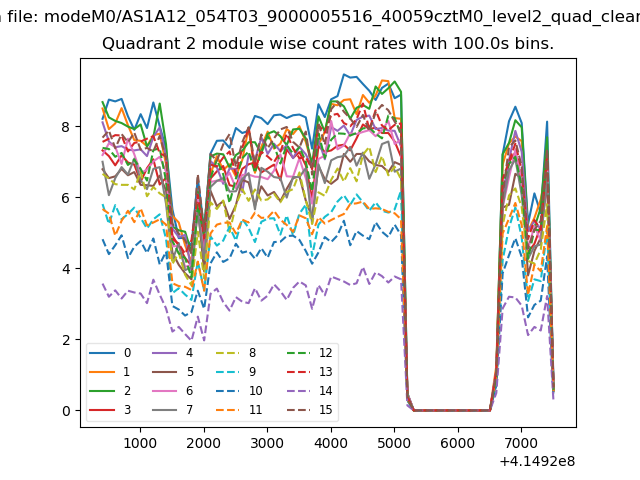
| Quadrant-wise count rates Data is divided into 100 sec bins |
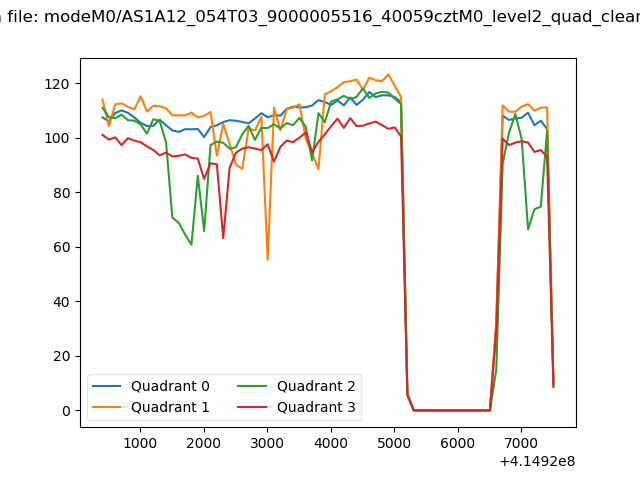 |
|
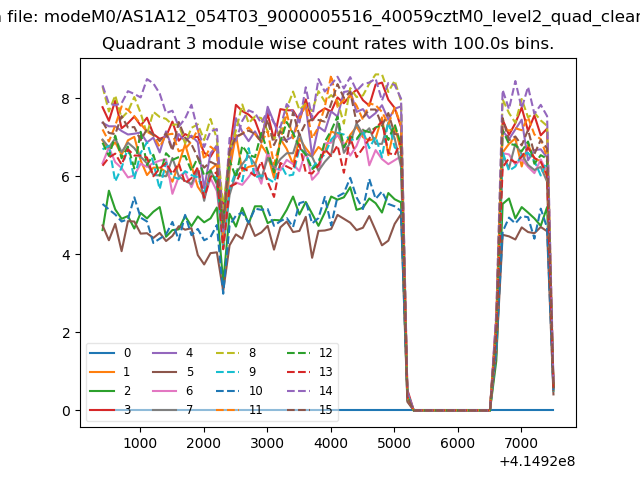
| Module-wise count rates for Quadrant A Data is divided into 100 sec bins |
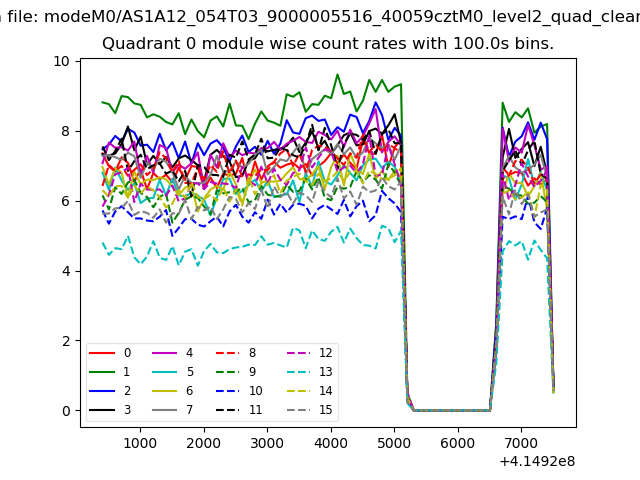 |
 |
| Module-wise count rates for Quadrant B Data is divided into 100 sec bins |
 |
 |
| Module-wise count rates for Quadrant C Data is divided into 100 sec bins |
 |
 |
| Module-wise count rates for Quadrant D Data is divided into 100 sec bins |
 |
 |
| Parameter | Plot |
|---|---|
| CZT HV Monitor | 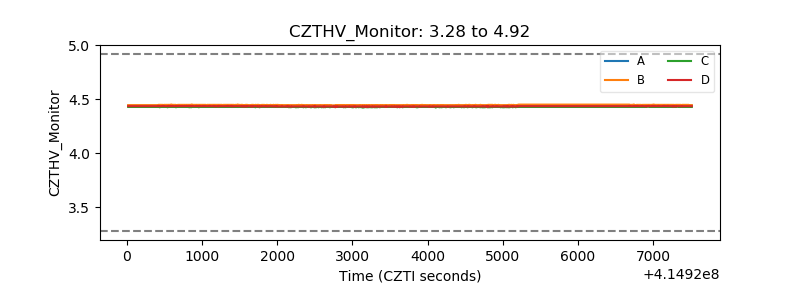 |
| D_VDD | 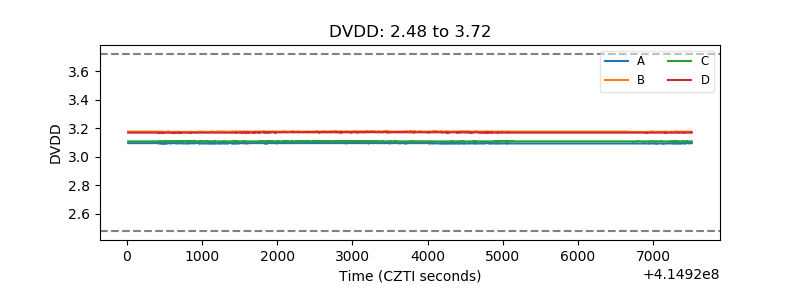 |
| Temperature 1 | 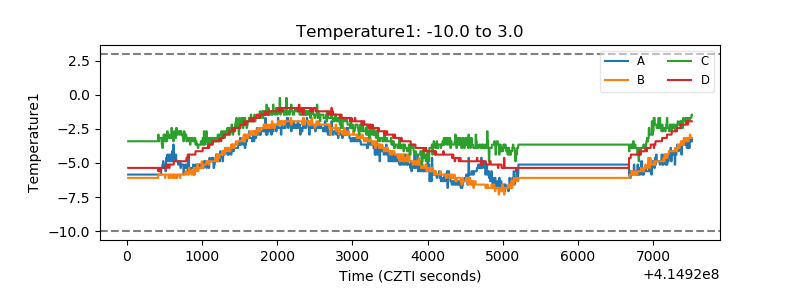 |
| Veto HV Monitor | 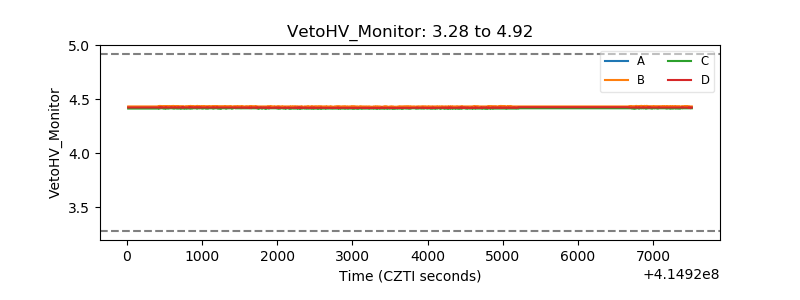 |
| Veto LLD | 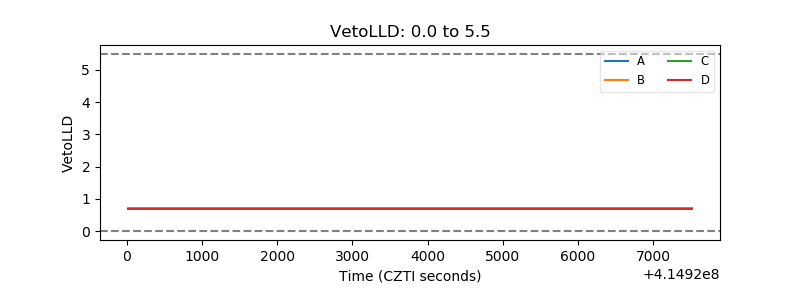 |
| Alpha Counter | 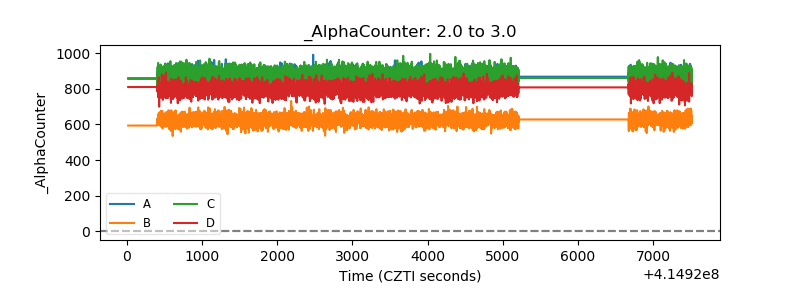 |
| _CPM_Rate | 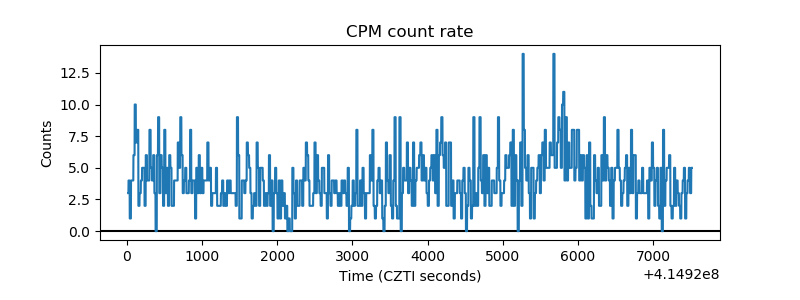 |
| CZT Counter | 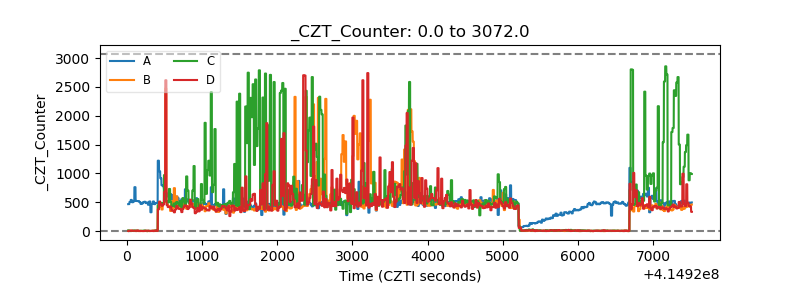 |
| +2.5 Volts monitor | 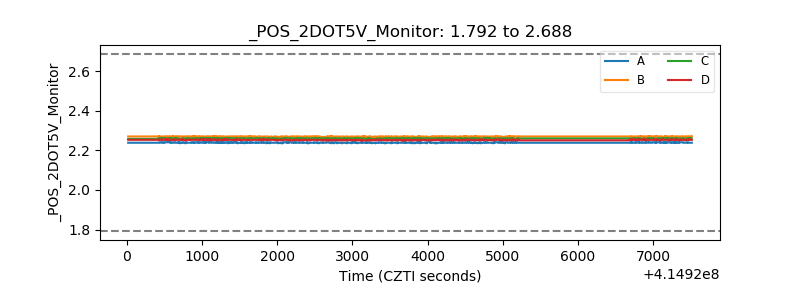 |
| +5 Volts monitor | 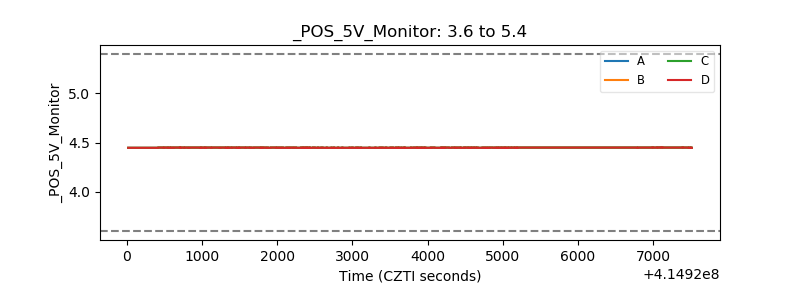 |
| _ROLL_ROT | 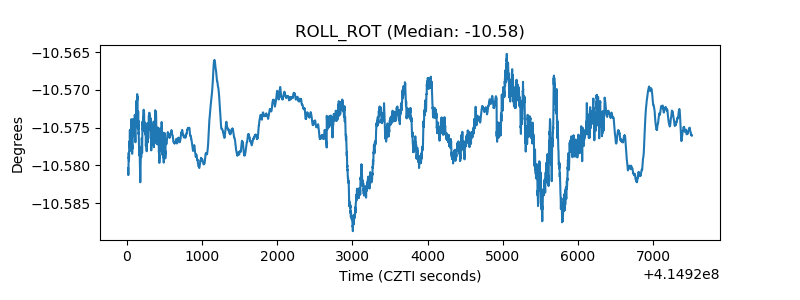 |
| _Roll_DEC | 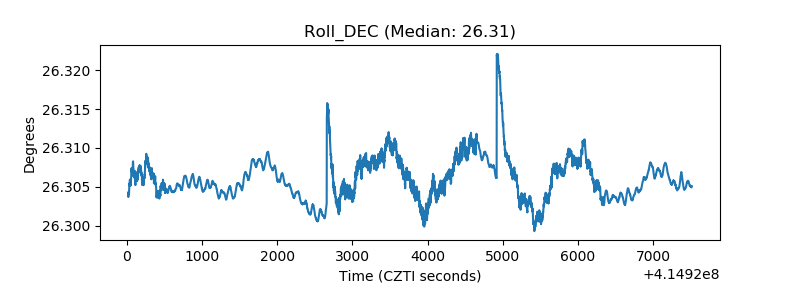 |
| _Roll_RA | 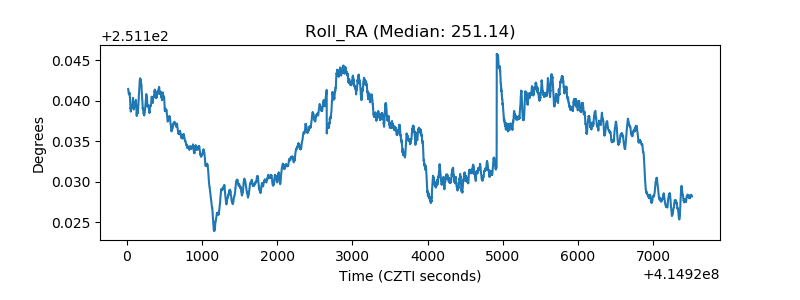 |
| Veto Counter | 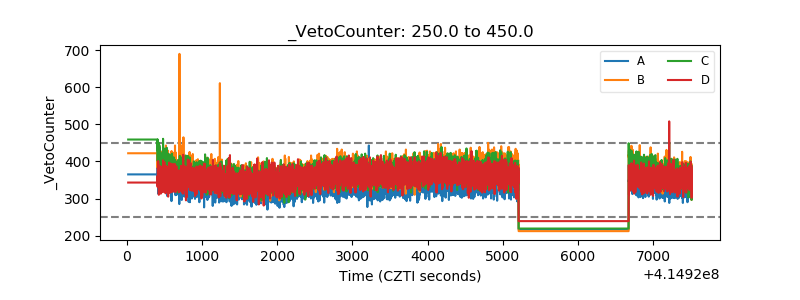 |