| Param | Original file | Final file |
|---|---|---|
| Filename | modeM0/AS1A12_054T03_9000005516_40060cztM0_level2.fits | modeM0/AS1A12_054T03_9000005516_40060cztM0_level2_quad_clean.evt |
| Size (bytes) | 385,053,120 | 93,738,240 |
| Size | 367.2 MB | 89.4 MB |
| Events in quadrant A | 3,036,713 | 629,073 |
| Events in quadrant B | 3,121,556 | 642,539 |
| Events in quadrant C | 4,388,960 | 594,697 |
| Events in quadrant D | 3,250,764 | 562,767 |
| Mode M9 | |||
|---|---|---|---|
| Quadrant | BADHDUFLAG | Total packets | Discarded packets |
| A | 0 | 17 | 0 |
| B | 0 | 17 | 0 |
| C | 0 | 17 | 0 |
| D | 0 | 18 | 0 |
| Mode SS | |||
|---|---|---|---|
| Quadrant | BADHDUFLAG | Total packets | Discarded packets |
| A | 0 | 120 | 0 |
| B | 0 | 120 | 0 |
| C | 0 | 120 | 0 |
| D | 0 | 120 | 0 |
| Mode M0 | |||
|---|---|---|---|
| Quadrant | BADHDUFLAG | Total packets | Discarded packets |
| A | 0 | 12519 | 3 |
| B | 0 | 13374 | 2 |
| C | 0 | 16768 | 2 |
| D | 0 | 13889 | 2 |
| Quadrant | Total seconds | Saturated seconds | Saturation percentage |
|---|---|---|---|
| A | 5851 | 12 | 0.205093% |
| B | 5851 | 139 | 2.375662% |
| C | 5851 | 320 | 5.469151% |
| D | 5851 | 129 | 2.204751% |
Noise dominated data is calculated using 1-second bins in cleaned event files. If a bin has >2000 counts, and if more than 50% of those come from <1% of pixels, then it is considered to be noise-dominated and hence unusable.
| Quadrant | # 1 sec bins | Bins with >0 counts | Bins with >2000 counts | High rate bins dominated by noise | Noise dominated (total time) | Noise dominated (detector-on time) | Marked lightcurve |
|---|---|---|---|---|---|---|---|
| A | 7165 | 5852 | 7 | 7 | 0.10% | 0.12% | 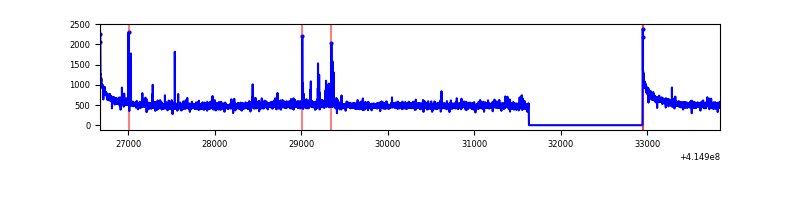 |
| B | 7165 | 5852 | 74 | 74 | 1.03% | 1.26% | 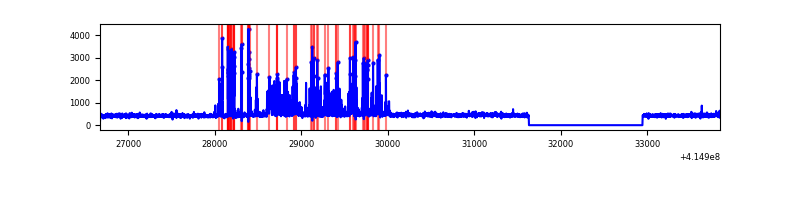 |
| C | 7165 | 5852 | 284 | 284 | 3.96% | 4.85% | 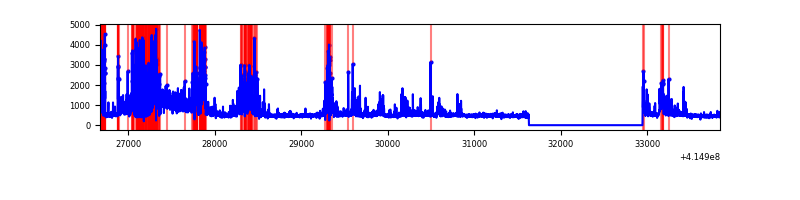 |
| D | 7165 | 5852 | 122 | 122 | 1.70% | 2.08% | 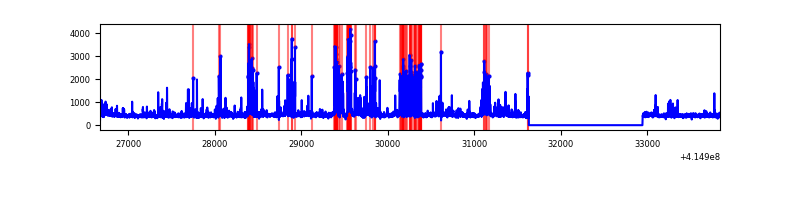 |
Top three noisy pixels from each quadrant. If the there are fewer than three noisy pixels in the level2.evt file, extra rows are filled as -1
| Pixel properties | Quadrant properties | ||||||
|---|---|---|---|---|---|---|---|
| Quadrant | DetID | PixID | Counts | Sigma | Mean | Median | Sigma |
| A | 10 | 83 | 492463 | 3825.73 | 636 | 625 | 128.6 |
| A | 13 | 248 | 33023 | 252.01 | 636 | 625 | 128.6 |
| A | 9 | 143 | 23492 | 177.87 | 636 | 625 | 128.6 |
| B | 4 | 171 | 581080 | 4723.93 | 628 | 612 | 122.9 |
| B | 0 | 230 | 50081 | 402.58 | 628 | 612 | 122.9 |
| B | 12 | 111 | 15342 | 119.87 | 628 | 612 | 122.9 |
| C | 9 | 187 | 1591874 | 11135.72 | 610 | 614 | 142.9 |
| C | 15 | 214 | 238348 | 1663.67 | 610 | 614 | 142.9 |
| C | 14 | 254 | 156726 | 1092.48 | 610 | 614 | 142.9 |
| D | 12 | 227 | 207690 | 1364.92 | 617 | 598 | 151.7 |
| D | 12 | 233 | 165037 | 1083.8 | 617 | 598 | 151.7 |
| D | 13 | 249 | 140313 | 920.85 | 617 | 598 | 151.7 |
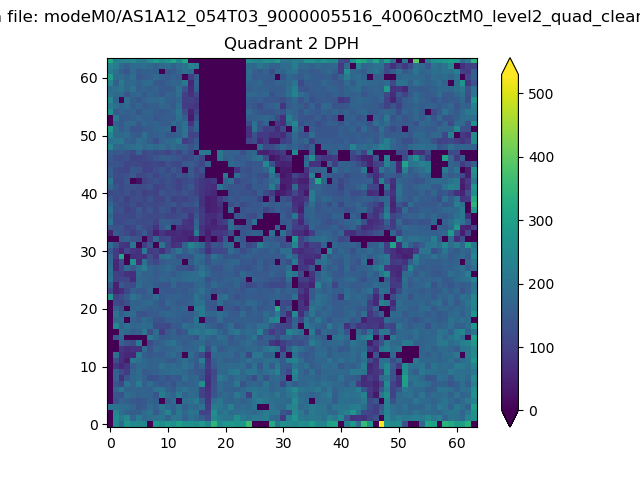
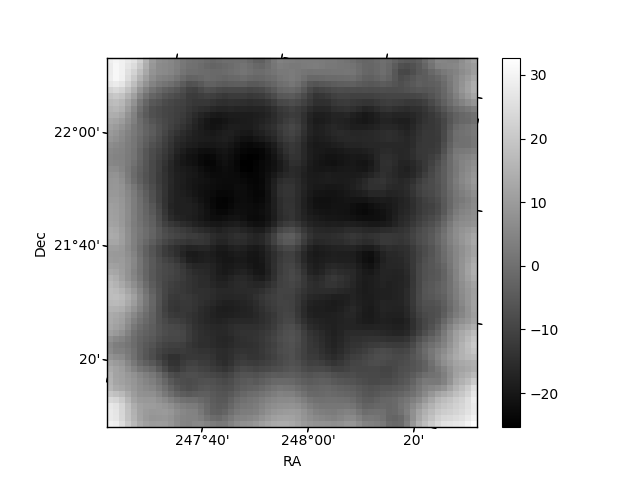
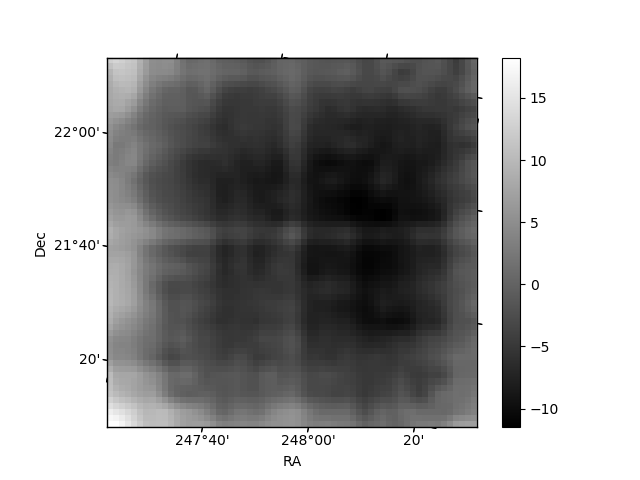
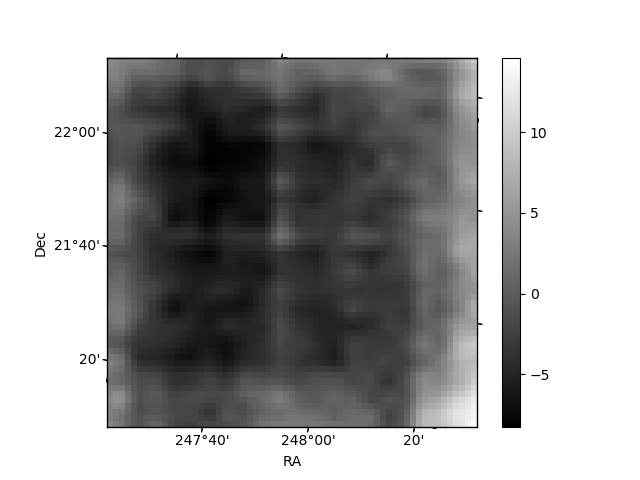
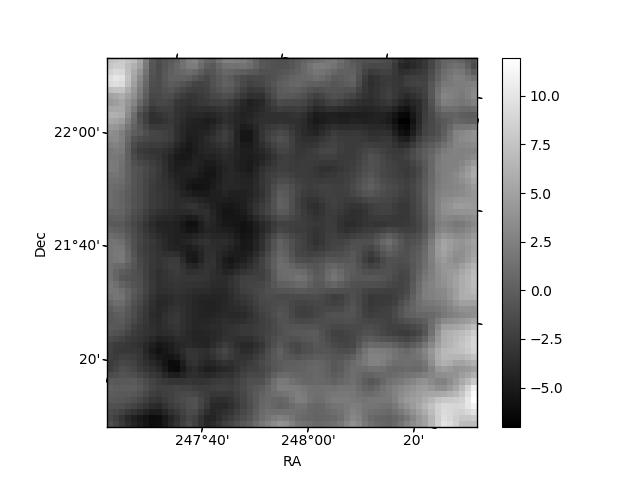
Histogram calculated using DETX and DETY for each event in the final _common_clean file
| Quadrant A | 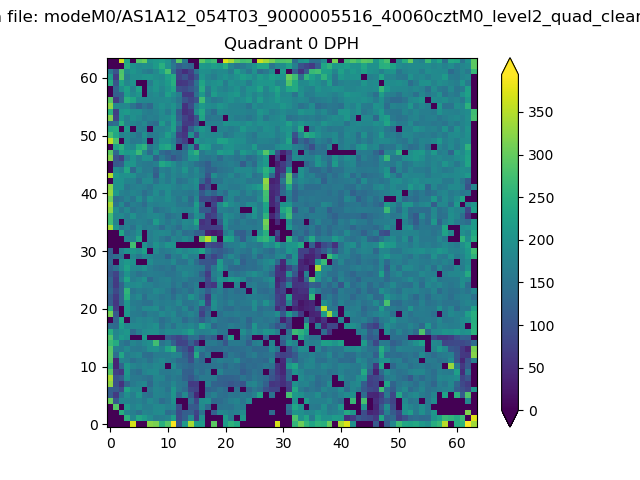 |
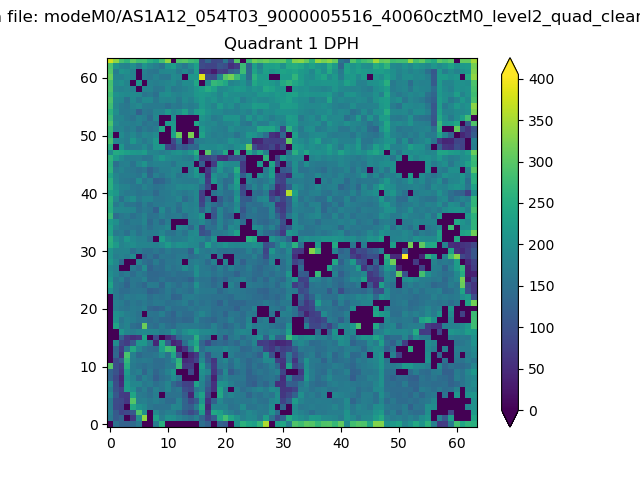 |
Quadrant B |
|---|---|---|---|
| Quadrant D | 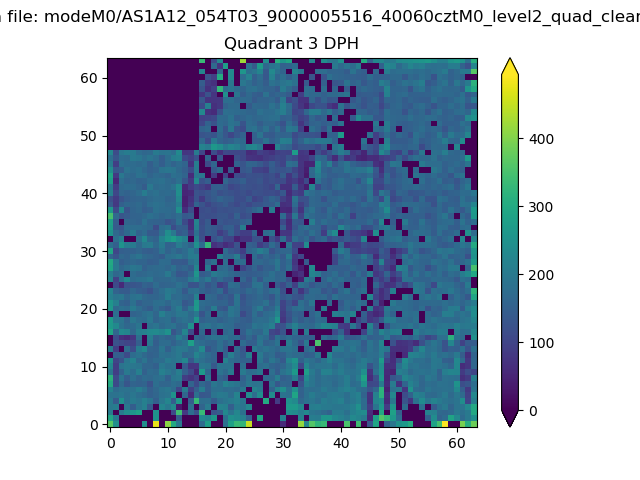 |
 |
Quadrant C |
| Plot type | Count rate plots | Images |
|---|---|---|
| Comparison with Poisson distribution Blue bars denote a histogram of data divided into 1 sec bins. Red curve is a Poisson curve with rate = median count rate of data. |
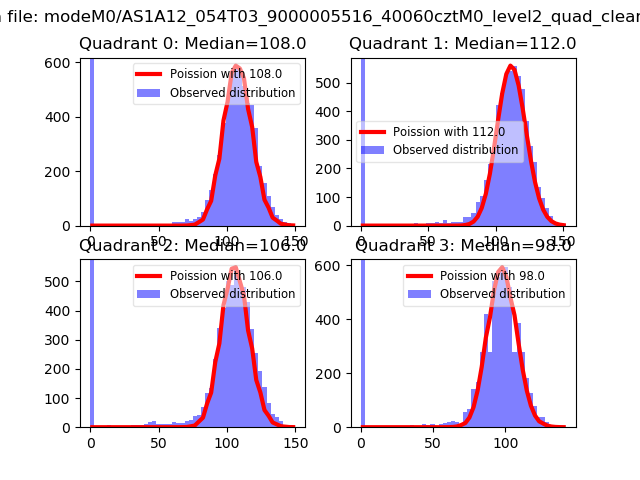 |
 |
| Quadrant-wise count rates Data is divided into 100 sec bins |
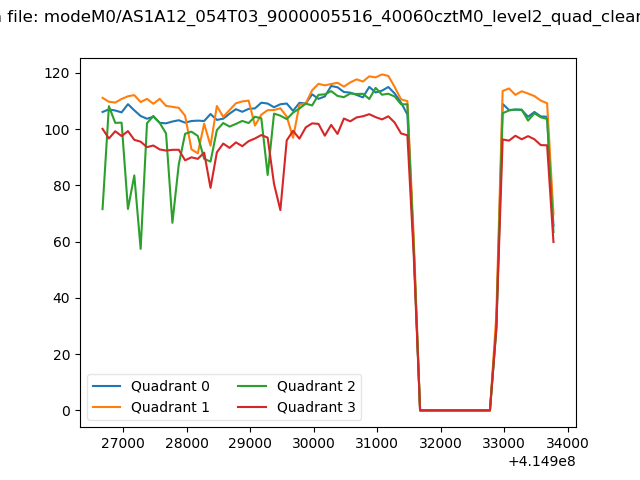 |
|
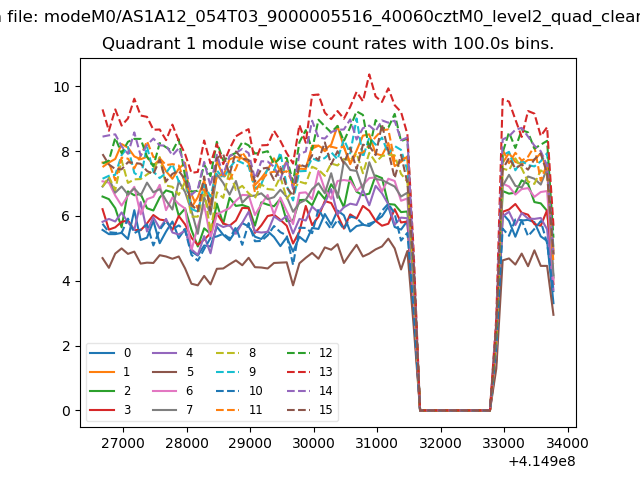
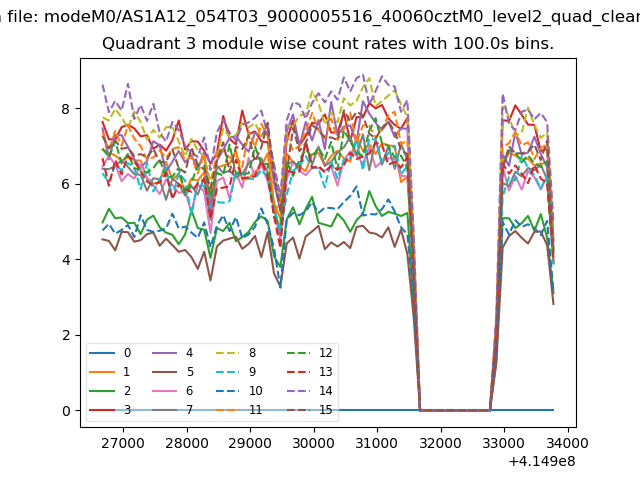
| Module-wise count rates for Quadrant A Data is divided into 100 sec bins |
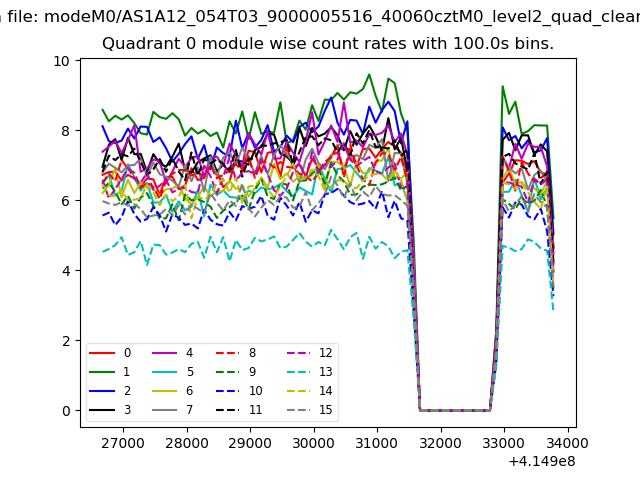 |
 |
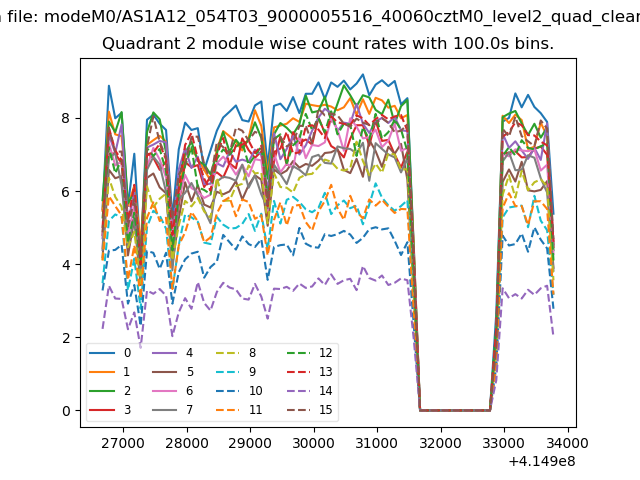
| Module-wise count rates for Quadrant B Data is divided into 100 sec bins |
 |
 |
| Module-wise count rates for Quadrant C Data is divided into 100 sec bins |
 |
 |
| Module-wise count rates for Quadrant D Data is divided into 100 sec bins |
 |
 |
| Parameter | Plot |
|---|---|
| CZT HV Monitor | 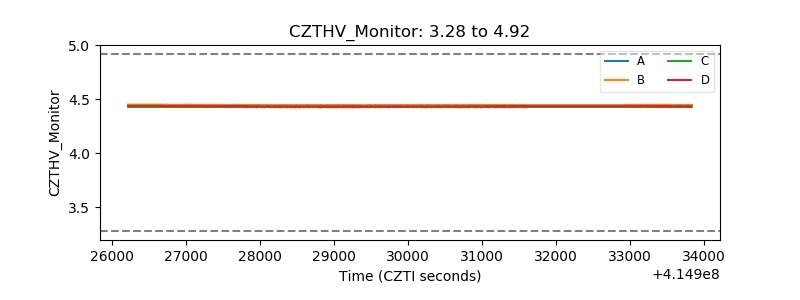 |
| D_VDD | 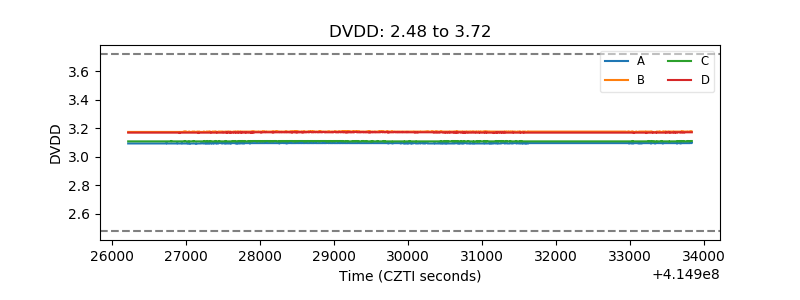 |
| Temperature 1 | 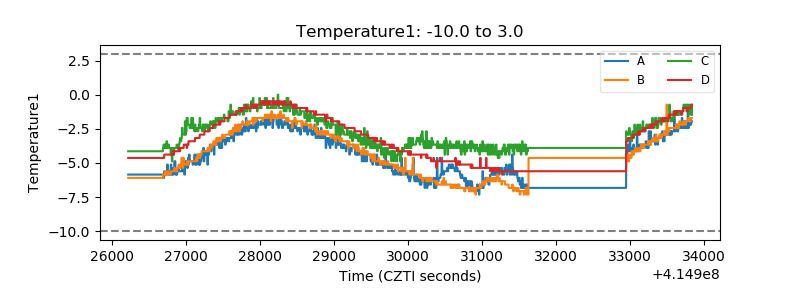 |
| Veto HV Monitor | 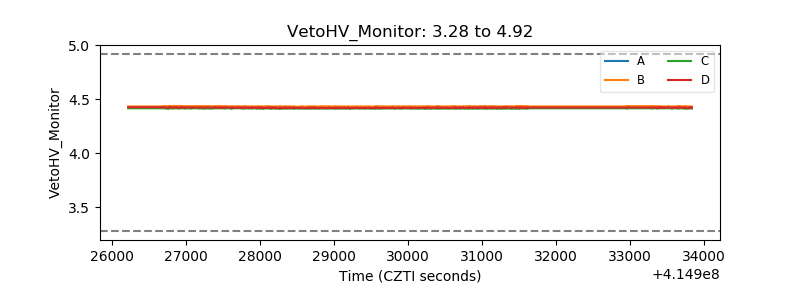 |
| Veto LLD | 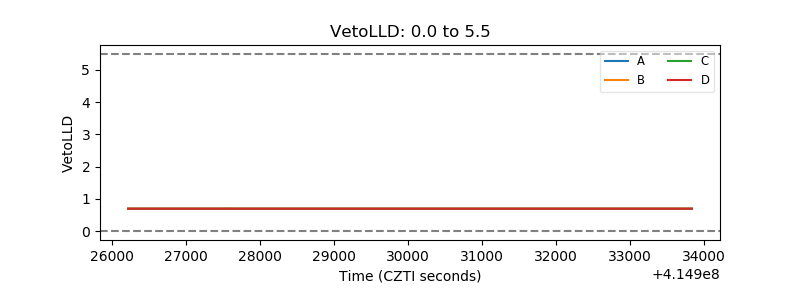 |
| Alpha Counter | 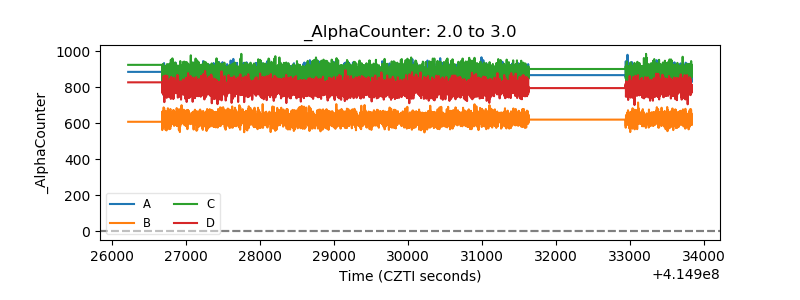 |
| _CPM_Rate | 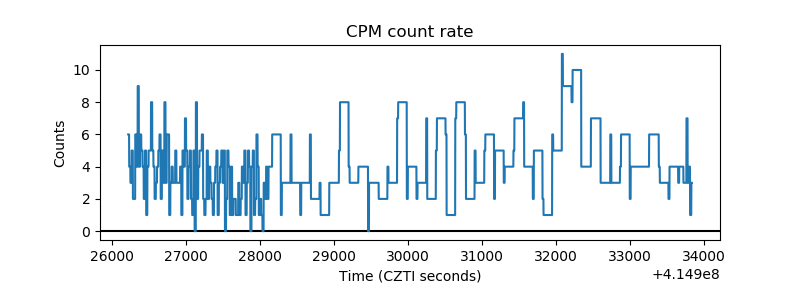 |
| CZT Counter | 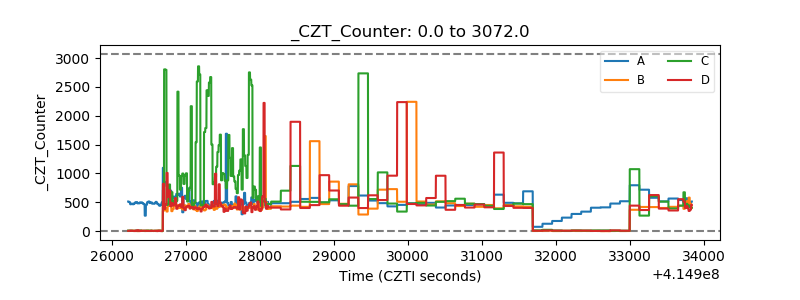 |
| +2.5 Volts monitor |  |
| +5 Volts monitor |  |
| _ROLL_ROT | 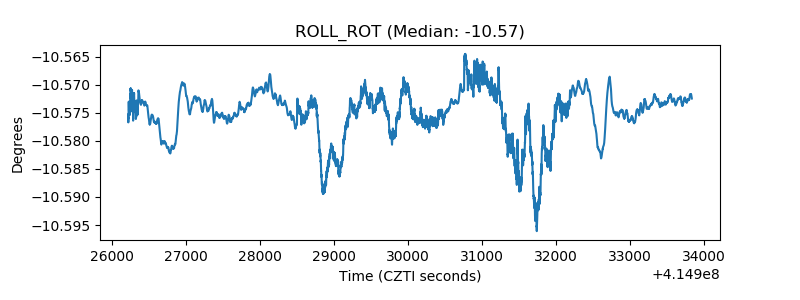 |
| _Roll_DEC | 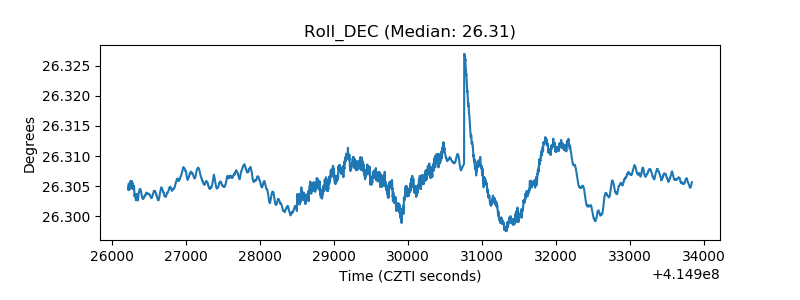 |
| _Roll_RA | 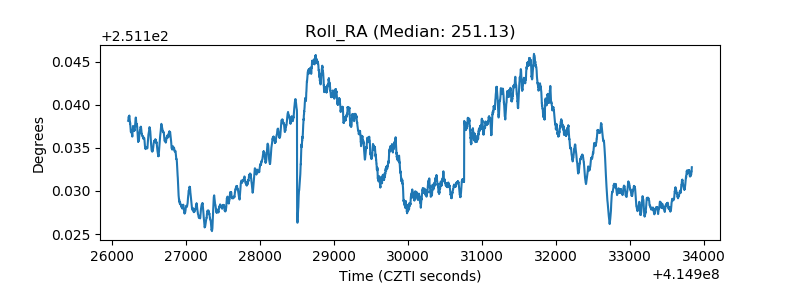 |
| Veto Counter | 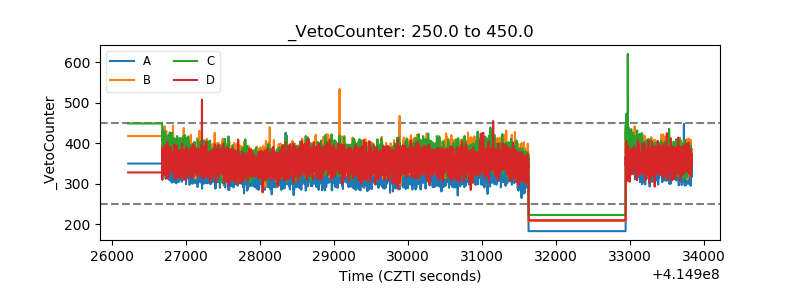 |