| Param | Original file | Final file |
|---|---|---|
| Filename | modeM0/AS1A12_054T03_9000005516_40061cztM0_level2.fits | modeM0/AS1A12_054T03_9000005516_40061cztM0_level2_quad_clean.evt |
| Size (bytes) | 426,623,040 | 95,417,280 |
| Size | 406.9 MB | 91.0 MB |
| Events in quadrant A | 3,427,371 | 642,141 |
| Events in quadrant B | 3,281,869 | 658,214 |
| Events in quadrant C | 4,650,132 | 614,784 |
| Events in quadrant D | 3,962,890 | 552,391 |
| Mode M9 | |||
|---|---|---|---|
| Quadrant | BADHDUFLAG | Total packets | Discarded packets |
| A | 0 | 21 | 0 |
| B | 0 | 21 | 0 |
| C | 0 | 21 | 0 |
| D | 0 | 22 | 0 |
| Mode SS | |||
|---|---|---|---|
| Quadrant | BADHDUFLAG | Total packets | Discarded packets |
| A | 0 | 120 | 0 |
| B | 0 | 120 | 0 |
| C | 0 | 120 | 0 |
| D | 0 | 120 | 0 |
| Mode M0 | |||
|---|---|---|---|
| Quadrant | BADHDUFLAG | Total packets | Discarded packets |
| A | 0 | 13819 | 2 |
| B | 0 | 13919 | 1 |
| C | 0 | 17757 | 1 |
| D | 0 | 16113 | 1 |
| Quadrant | Total seconds | Saturated seconds | Saturation percentage |
|---|---|---|---|
| A | 6043 | 79 | 1.307298% |
| B | 6043 | 148 | 2.449115% |
| C | 6043 | 333 | 5.510508% |
| D | 6043 | 408 | 6.751613% |
Noise dominated data is calculated using 1-second bins in cleaned event files. If a bin has >2000 counts, and if more than 50% of those come from <1% of pixels, then it is considered to be noise-dominated and hence unusable.
| Quadrant | # 1 sec bins | Bins with >0 counts | Bins with >2000 counts | High rate bins dominated by noise | Noise dominated (total time) | Noise dominated (detector-on time) | Marked lightcurve |
|---|---|---|---|---|---|---|---|
| A | 7356 | 6044 | 55 | 55 | 0.75% | 0.91% | 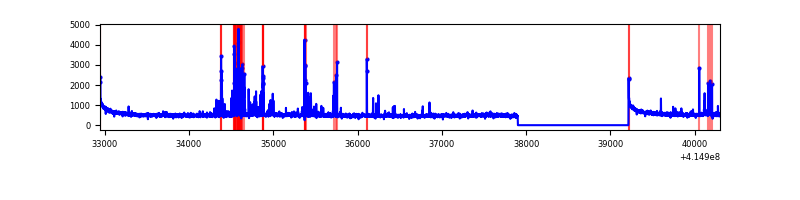 |
| B | 7356 | 6044 | 90 | 90 | 1.22% | 1.49% | 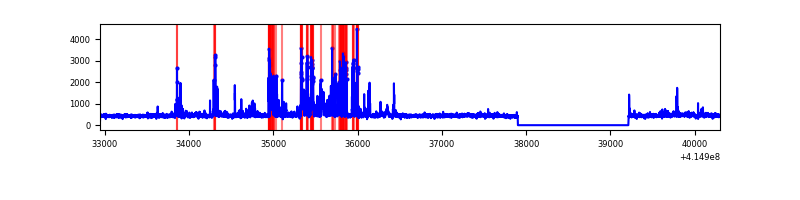 |
| C | 7356 | 6044 | 323 | 323 | 4.39% | 5.34% | 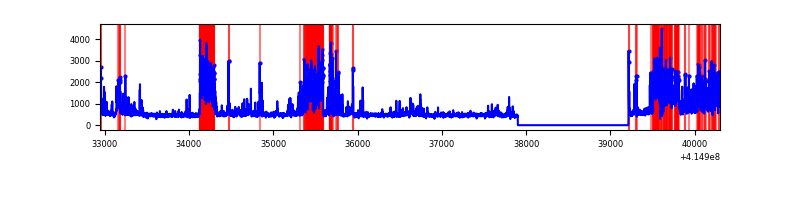 |
| D | 7356 | 6044 | 341 | 341 | 4.64% | 5.64% | 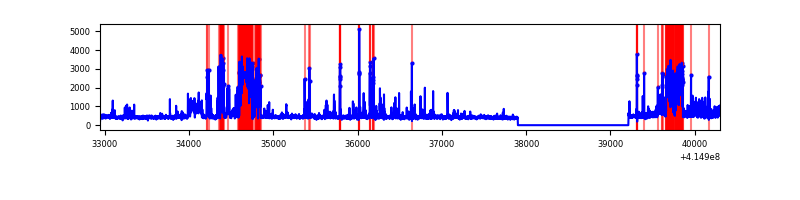 |
Top three noisy pixels from each quadrant. If the there are fewer than three noisy pixels in the level2.evt file, extra rows are filled as -1
| Pixel properties | Quadrant properties | ||||||
|---|---|---|---|---|---|---|---|
| Quadrant | DetID | PixID | Counts | Sigma | Mean | Median | Sigma |
| A | 10 | 83 | 521816 | 3886.29 | 657 | 643 | 134.1 |
| A | 13 | 248 | 272278 | 2025.53 | 657 | 643 | 134.1 |
| A | 7 | 3 | 32450 | 237.18 | 657 | 643 | 134.1 |
| B | 4 | 171 | 562806 | 4378.82 | 653 | 635 | 128.4 |
| B | 15 | 201 | 49651 | 381.79 | 653 | 635 | 128.4 |
| B | 0 | 230 | 41877 | 321.24 | 653 | 635 | 128.4 |
| C | 9 | 187 | 1860151 | 12498.51 | 637 | 641 | 148.8 |
| C | 15 | 214 | 248506 | 1666.0 | 637 | 641 | 148.8 |
| C | 14 | 254 | 19734 | 128.33 | 637 | 641 | 148.8 |
| D | 12 | 233 | 717410 | 4654.76 | 623 | 604 | 154.0 |
| D | 13 | 171 | 337355 | 2186.78 | 623 | 604 | 154.0 |
| D | 2 | 250 | 181231 | 1172.95 | 623 | 604 | 154.0 |
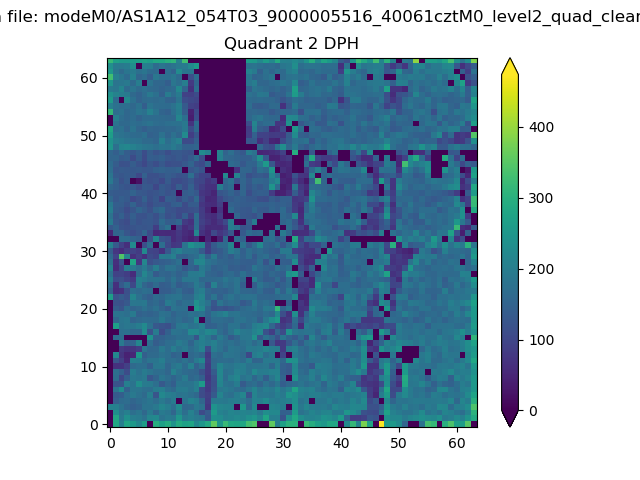
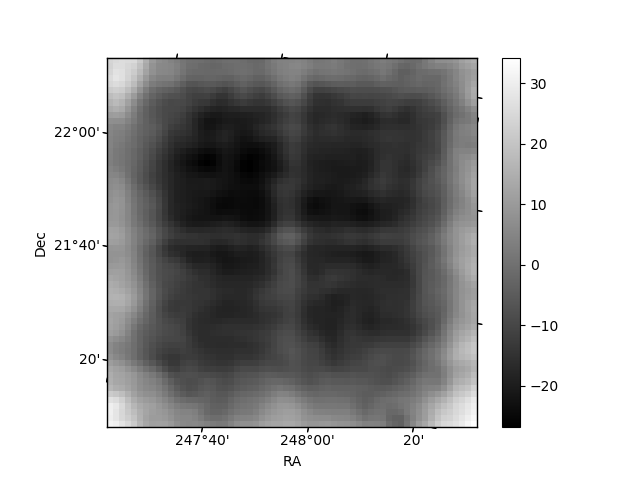
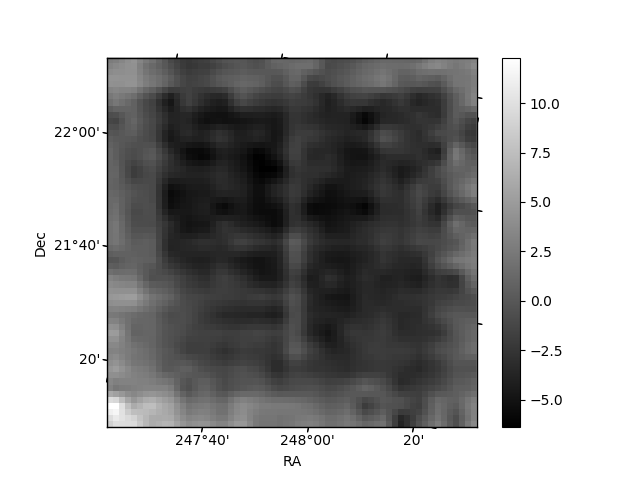
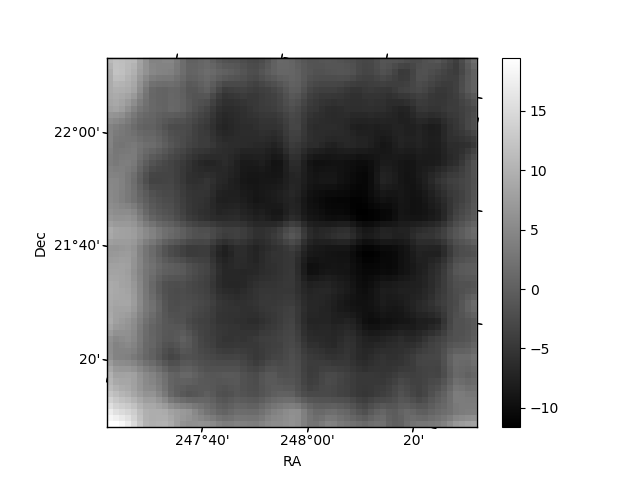
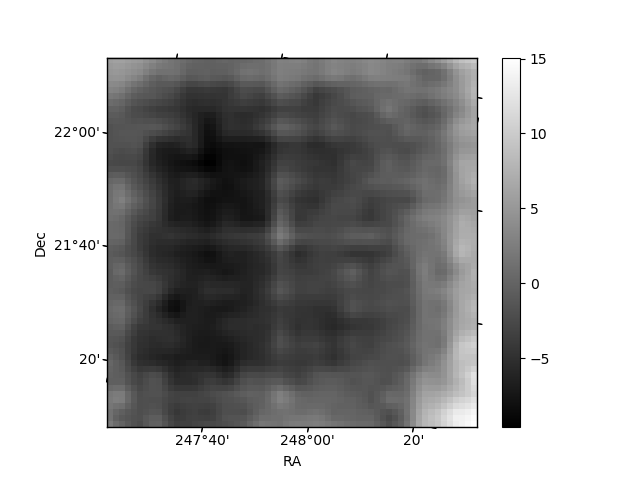
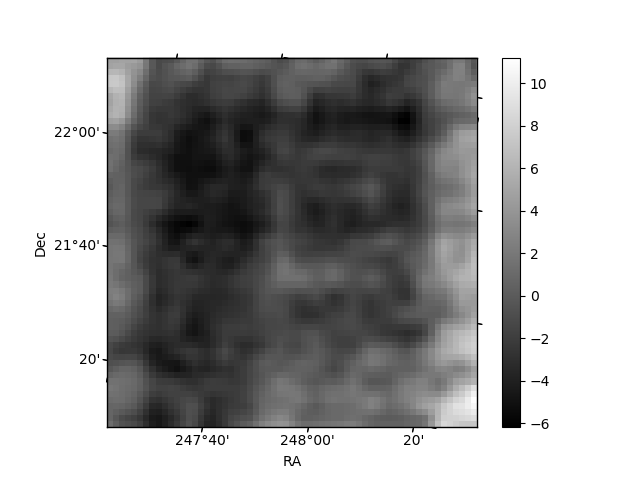
Histogram calculated using DETX and DETY for each event in the final _common_clean file
| Quadrant A | 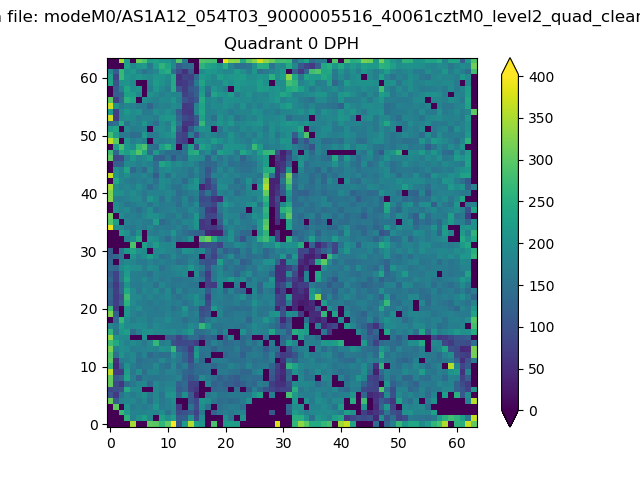 |
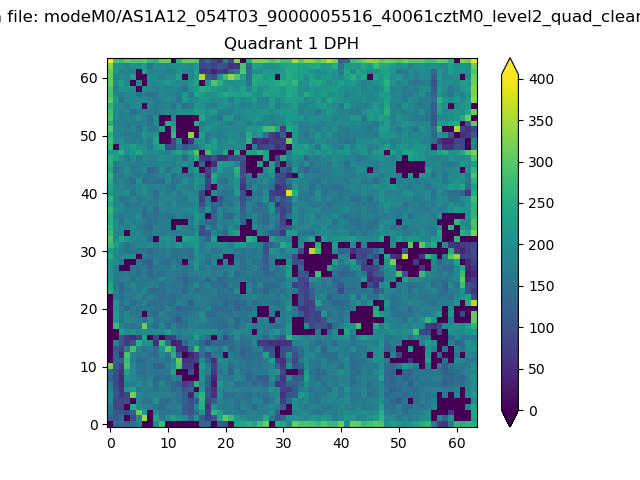 |
Quadrant B |
|---|---|---|---|
| Quadrant D | 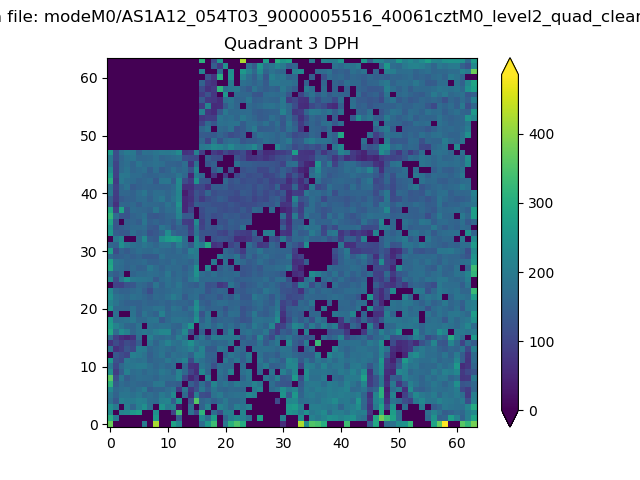 |
 |
Quadrant C |
| Plot type | Count rate plots | Images |
|---|---|---|
| Comparison with Poisson distribution Blue bars denote a histogram of data divided into 1 sec bins. Red curve is a Poisson curve with rate = median count rate of data. |
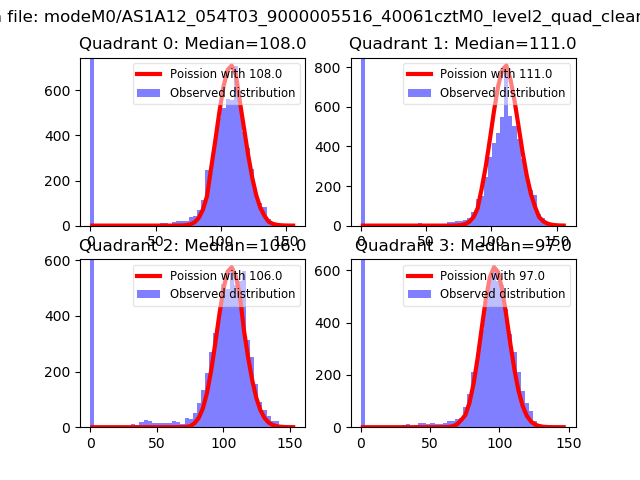 |
 |
| Quadrant-wise count rates Data is divided into 100 sec bins |
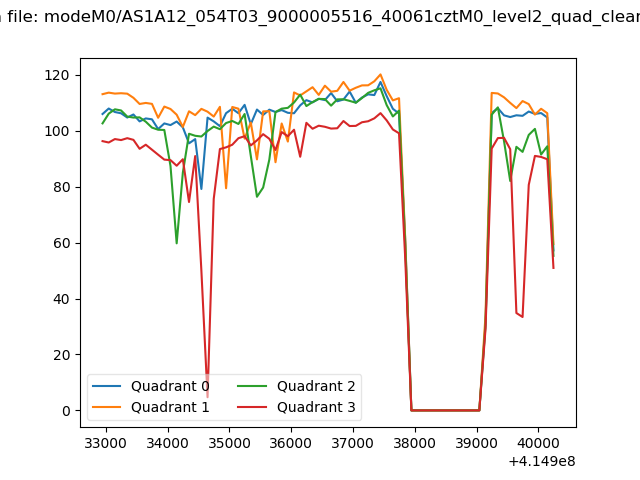 |
|
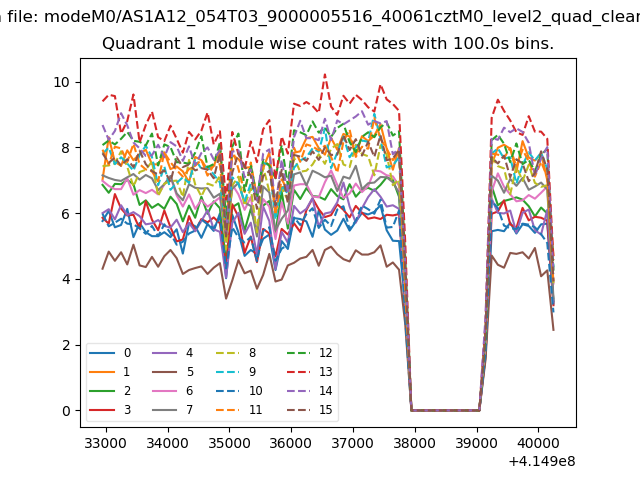
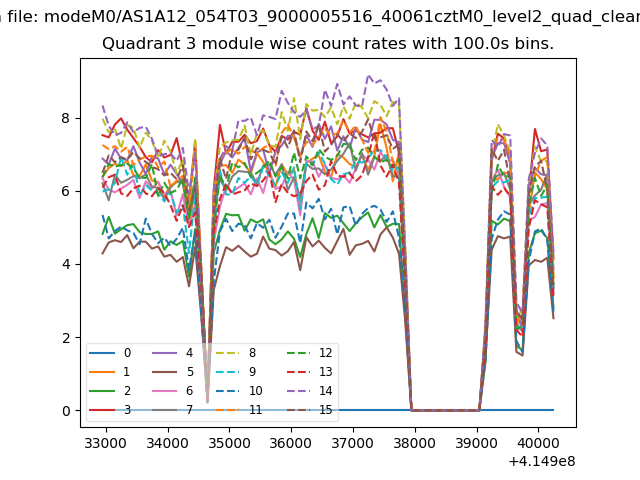
| Module-wise count rates for Quadrant A Data is divided into 100 sec bins |
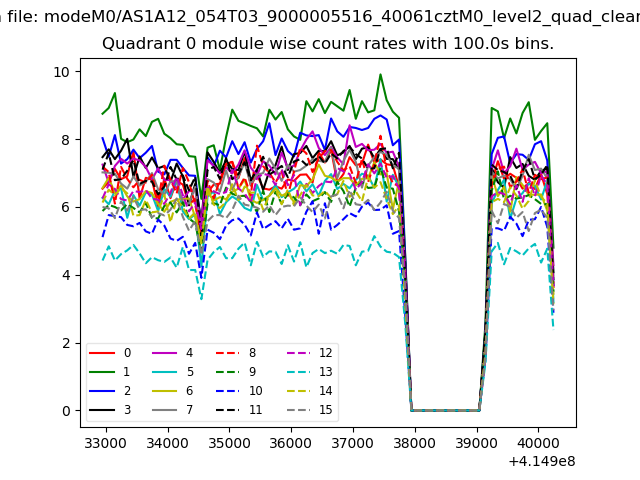 |
 |
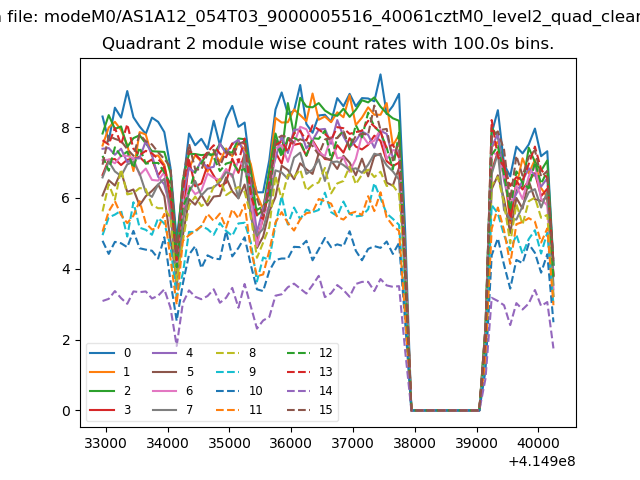
| Module-wise count rates for Quadrant B Data is divided into 100 sec bins |
 |
 |
| Module-wise count rates for Quadrant C Data is divided into 100 sec bins |
 |
 |
| Module-wise count rates for Quadrant D Data is divided into 100 sec bins |
 |
 |
| Parameter | Plot |
|---|---|
| CZT HV Monitor | 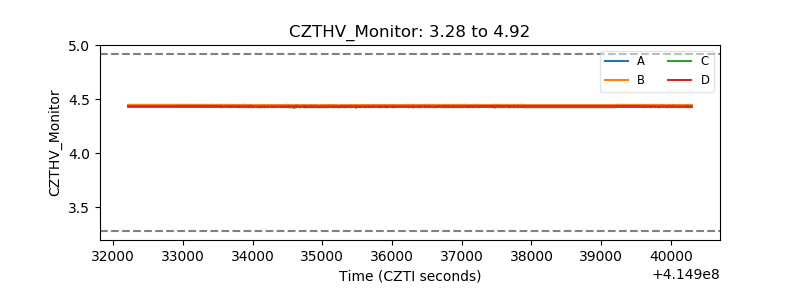 |
| D_VDD | 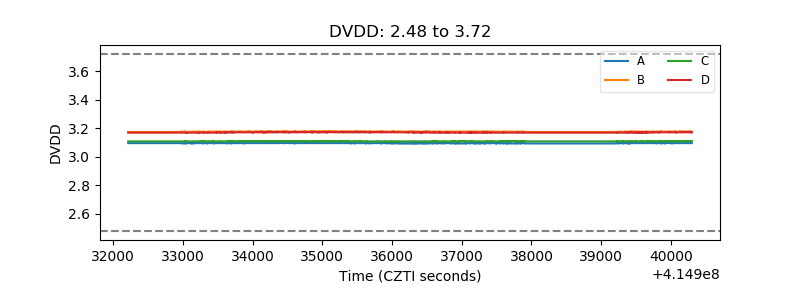 |
| Temperature 1 | 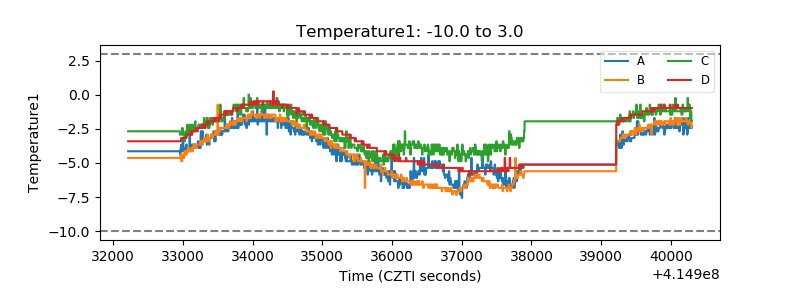 |
| Veto HV Monitor | 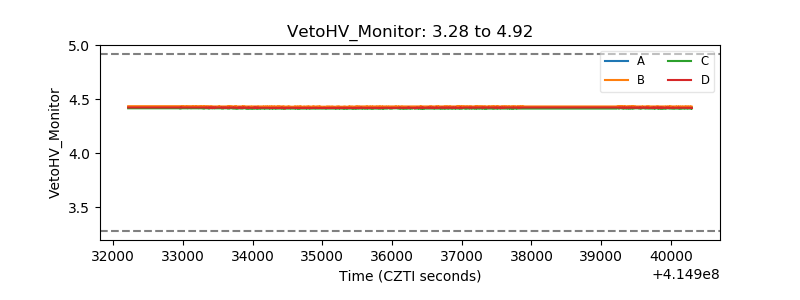 |
| Veto LLD | 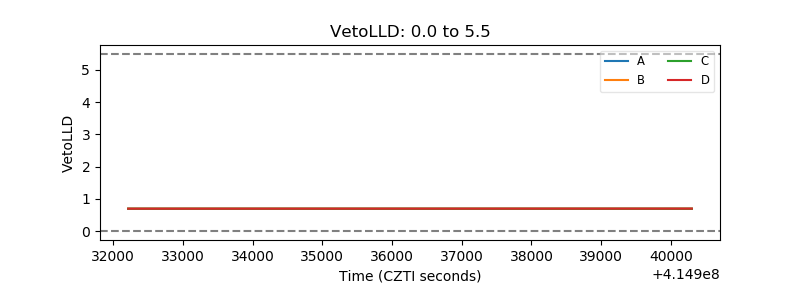 |
| Alpha Counter | 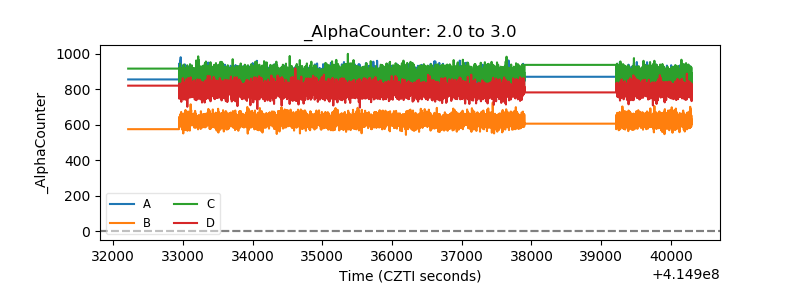 |
| _CPM_Rate | 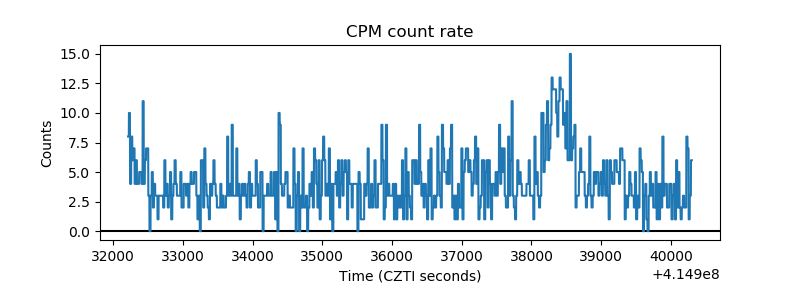 |
| CZT Counter | 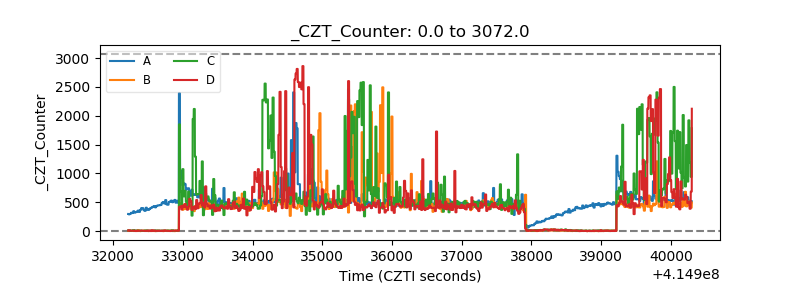 |
| +2.5 Volts monitor | 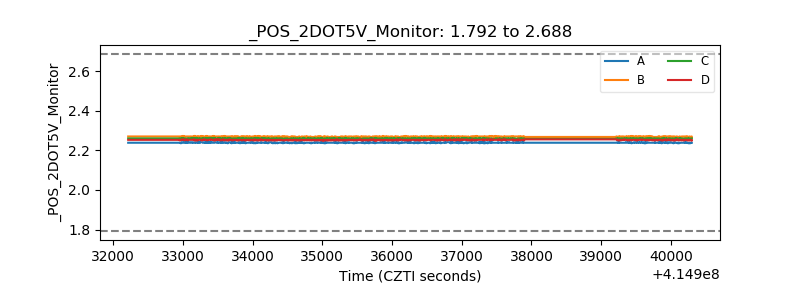 |
| +5 Volts monitor | 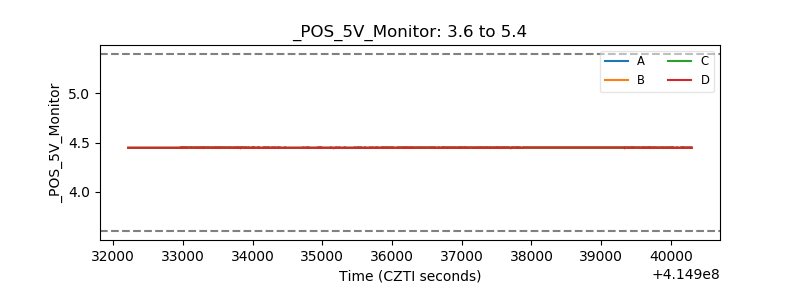 |
| _ROLL_ROT | 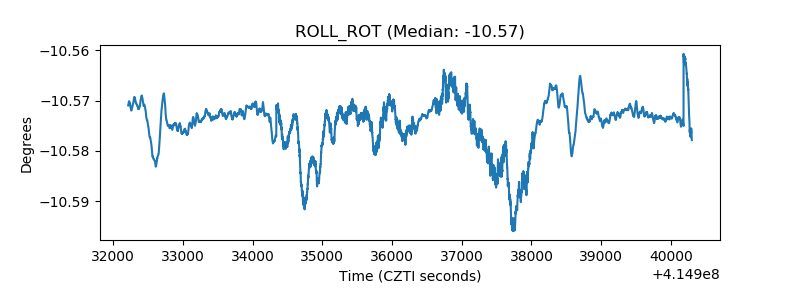 |
| _Roll_DEC | 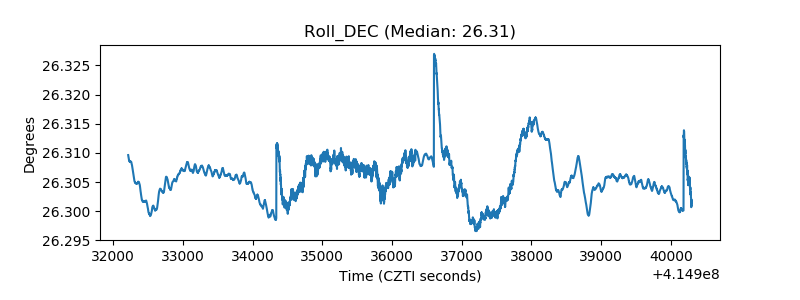 |
| _Roll_RA | 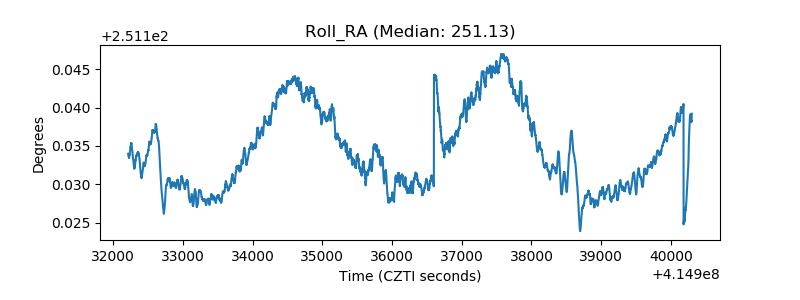 |
| Veto Counter | 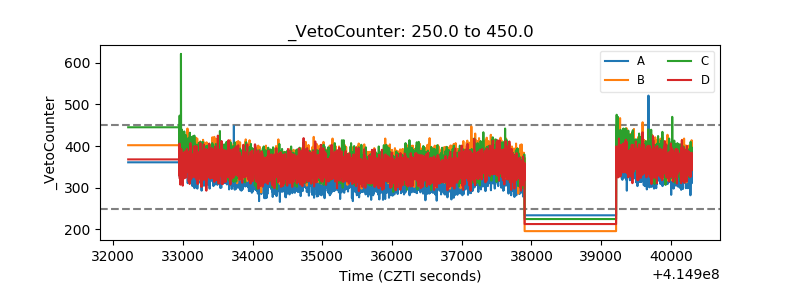 |