| Param | Original file | Final file |
|---|---|---|
| Filename | modeM0/AS1A12_054T03_9000005516_40063cztM0_level2.fits | modeM0/AS1A12_054T03_9000005516_40063cztM0_level2_quad_clean.evt |
| Size (bytes) | 1,183,150,080 | 261,624,960 |
| Size | 1.1 GB | 249.5 MB |
| Events in quadrant A | 9,243,620 | 1,764,463 |
| Events in quadrant B | 8,704,144 | 1,815,221 |
| Events in quadrant C | 13,637,677 | 1,657,898 |
| Events in quadrant D | 10,921,739 | 1,534,824 |
| Mode M9 | |||
|---|---|---|---|
| Quadrant | BADHDUFLAG | Total packets | Discarded packets |
| A | 0 | 53 | 0 |
| B | 0 | 53 | 0 |
| C | 0 | 53 | 0 |
| D | 0 | 53 | 0 |
| Mode SS | |||
|---|---|---|---|
| Quadrant | BADHDUFLAG | Total packets | Discarded packets |
| A | 0 | 336 | 0 |
| B | 0 | 336 | 0 |
| C | 0 | 336 | 0 |
| D | 0 | 336 | 0 |
| Mode M0 | |||
|---|---|---|---|
| Quadrant | BADHDUFLAG | Total packets | Discarded packets |
| A | 0 | 37584 | 4 |
| B | 0 | 37486 | 3 |
| C | 0 | 51382 | 3 |
| D | 0 | 44116 | 5 |
| Quadrant | Total seconds | Saturated seconds | Saturation percentage |
|---|---|---|---|
| A | 16667 | 170 | 1.019980% |
| B | 16667 | 303 | 1.817964% |
| C | 16667 | 1149 | 6.893862% |
| D | 16666 | 769 | 4.614185% |
Noise dominated data is calculated using 1-second bins in cleaned event files. If a bin has >2000 counts, and if more than 50% of those come from <1% of pixels, then it is considered to be noise-dominated and hence unusable.
| Quadrant | # 1 sec bins | Bins with >0 counts | Bins with >2000 counts | High rate bins dominated by noise | Noise dominated (total time) | Noise dominated (detector-on time) | Marked lightcurve |
|---|---|---|---|---|---|---|---|
| A | 25631 | 16671 | 118 | 118 | 0.46% | 0.71% | 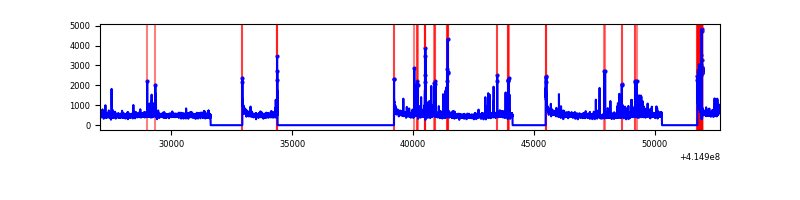 |
| B | 25631 | 16671 | 160 | 160 | 0.62% | 0.96% | 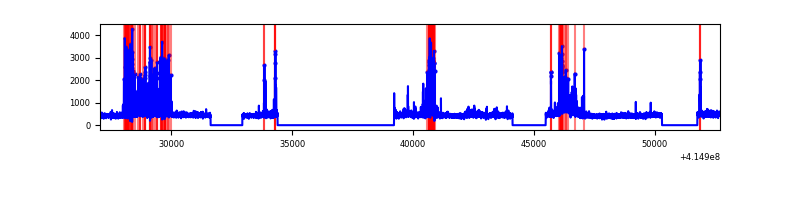 |
| C | 25630 | 16670 | 949 | 949 | 3.70% | 5.69% | 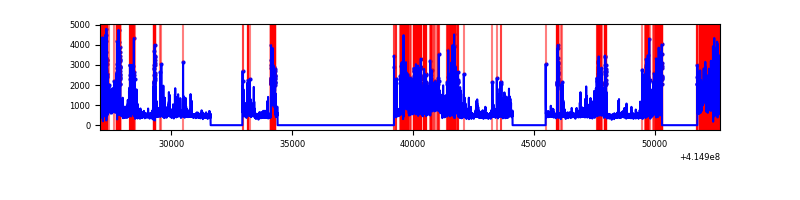 |
| D | 25631 | 16670 | 622 | 622 | 2.43% | 3.73% | 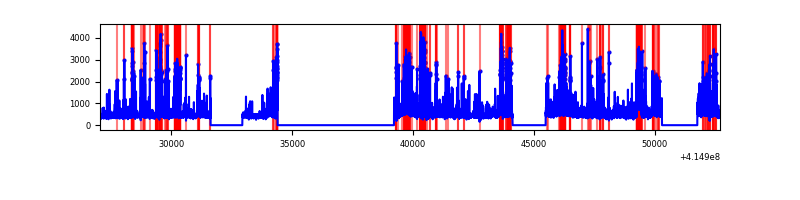 |
Top three noisy pixels from each quadrant. If the there are fewer than three noisy pixels in the level2.evt file, extra rows are filled as -1
| Pixel properties | Quadrant properties | ||||||
|---|---|---|---|---|---|---|---|
| Quadrant | DetID | PixID | Counts | Sigma | Mean | Median | Sigma |
| A | 10 | 83 | 1269009 | 3477.18 | 1808 | 1775 | 364.4 |
| A | 15 | 223 | 513585 | 1404.36 | 1808 | 1775 | 364.4 |
| A | 2 | 79 | 145717 | 394.96 | 1808 | 1775 | 364.4 |
| B | 4 | 171 | 1359366 | 3900.66 | 1800 | 1751 | 348.0 |
| B | 0 | 189 | 85630 | 241.0 | 1800 | 1751 | 348.0 |
| B | 0 | 230 | 82282 | 231.38 | 1800 | 1751 | 348.0 |
| C | 9 | 187 | 6031380 | 14890.61 | 1740 | 1750 | 404.9 |
| C | 15 | 214 | 668841 | 1647.43 | 1740 | 1750 | 404.9 |
| C | 14 | 254 | 99876 | 242.33 | 1740 | 1750 | 404.9 |
| D | 13 | 171 | 1280023 | 3006.8 | 1746 | 1697 | 425.1 |
| D | 12 | 227 | 845670 | 1985.14 | 1746 | 1697 | 425.1 |
| D | 13 | 249 | 677086 | 1588.61 | 1746 | 1697 | 425.1 |
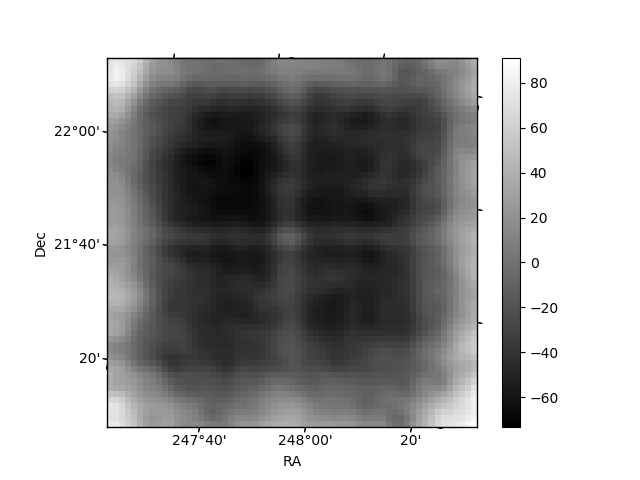
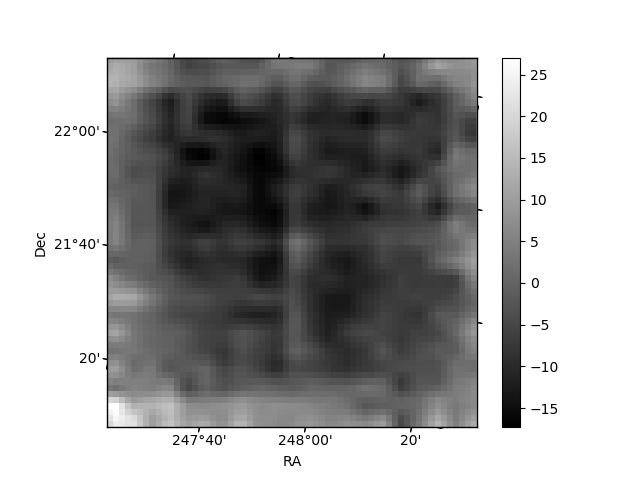
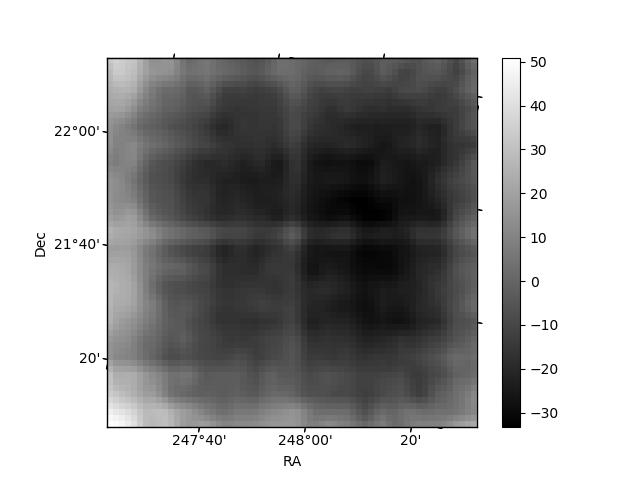
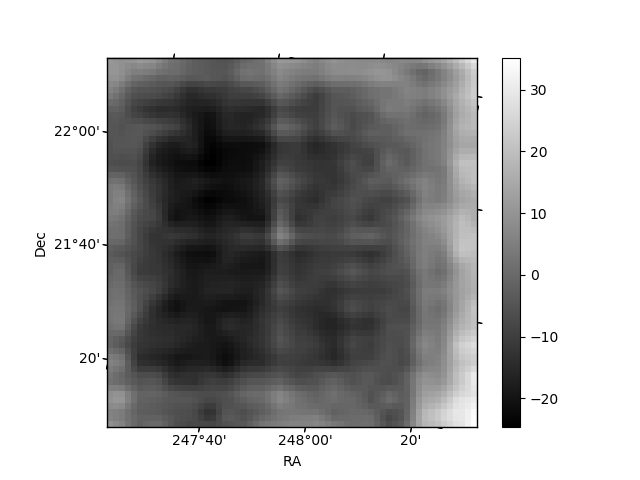
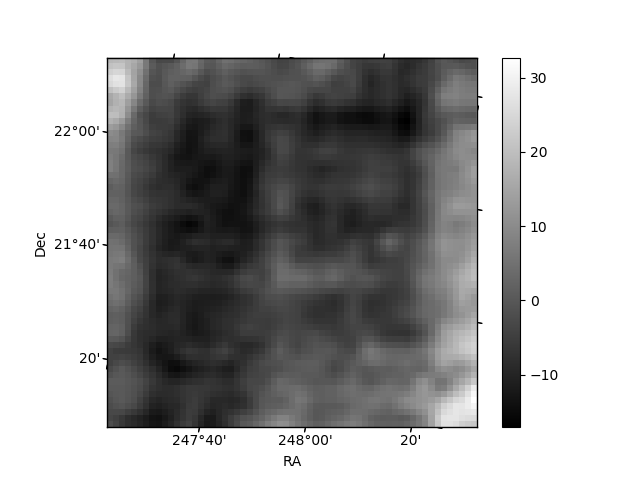
Histogram calculated using DETX and DETY for each event in the final _common_clean file
| Quadrant A | 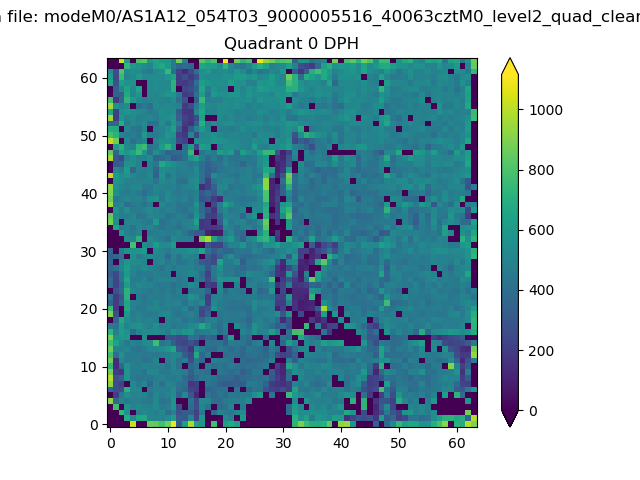 |
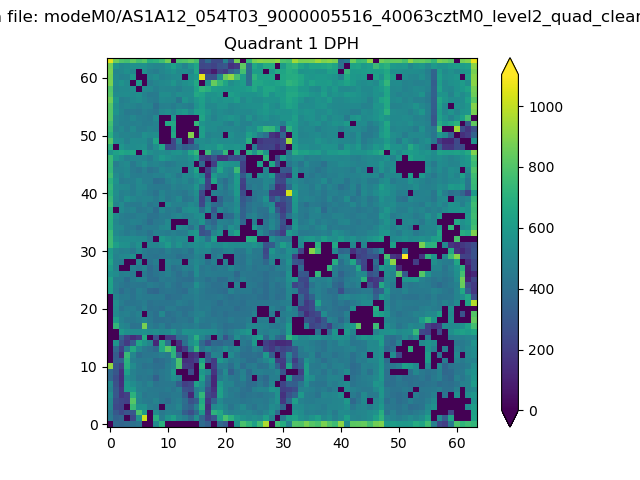 |
Quadrant B |
|---|---|---|---|
| Quadrant D | 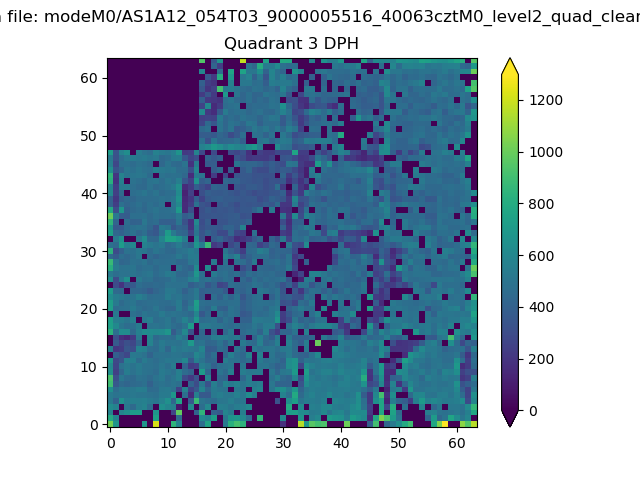 |
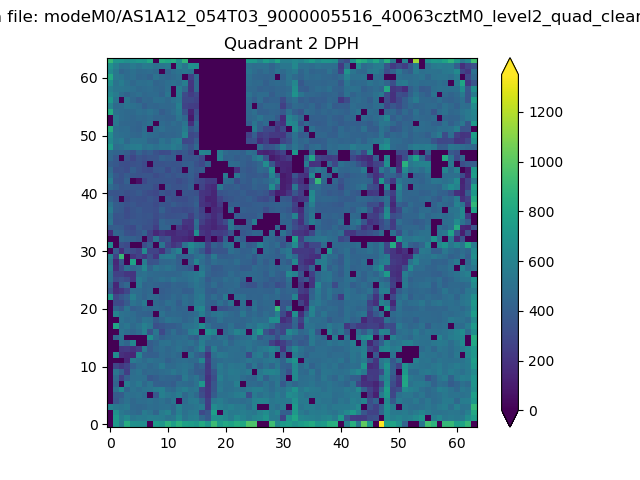 |
Quadrant C |
| Plot type | Count rate plots | Images |
|---|---|---|
| Comparison with Poisson distribution Blue bars denote a histogram of data divided into 1 sec bins. Red curve is a Poisson curve with rate = median count rate of data. |
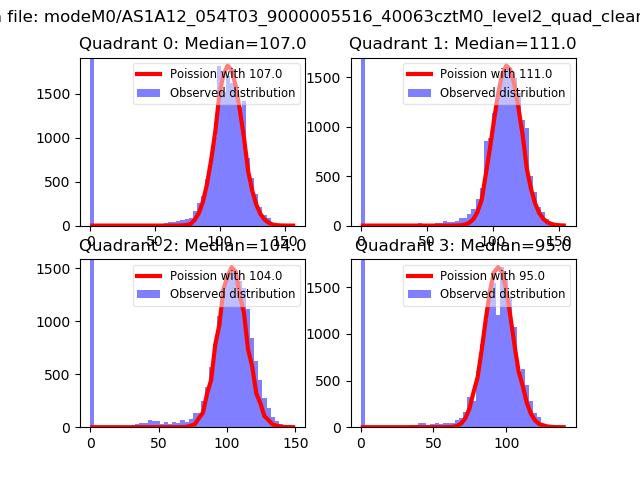 |
 |
| Quadrant-wise count rates Data is divided into 100 sec bins |
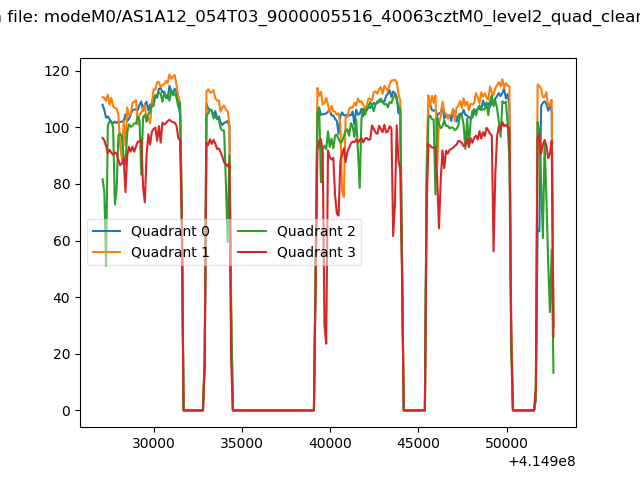 |
|
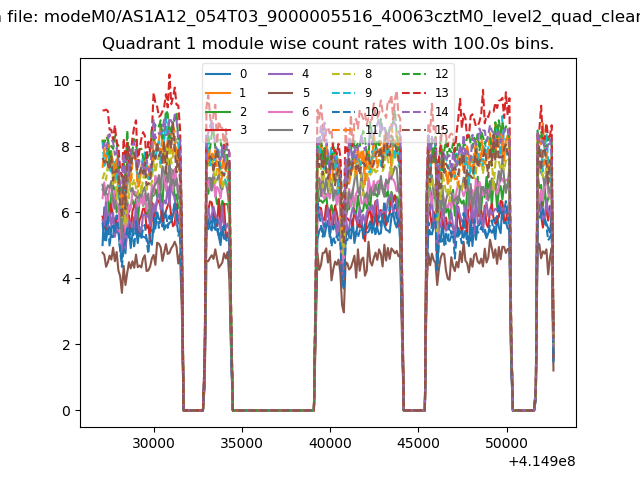
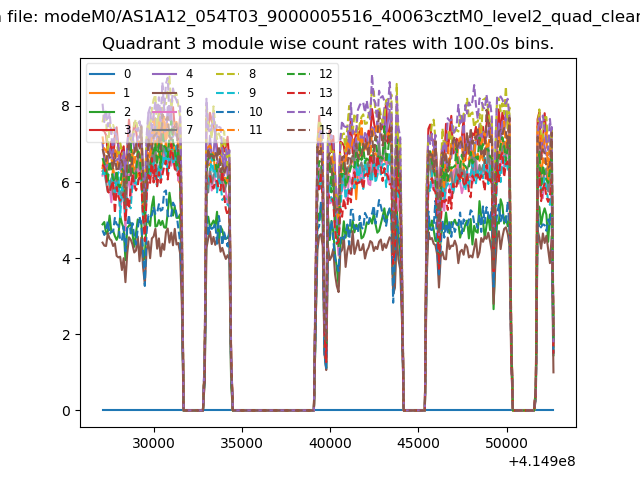
| Module-wise count rates for Quadrant A Data is divided into 100 sec bins |
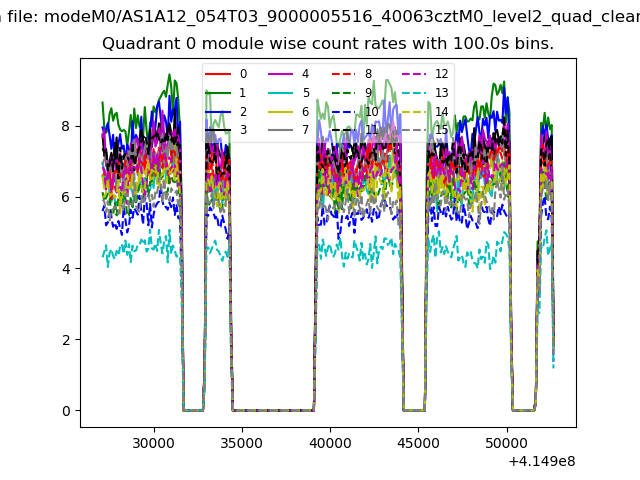 |
 |
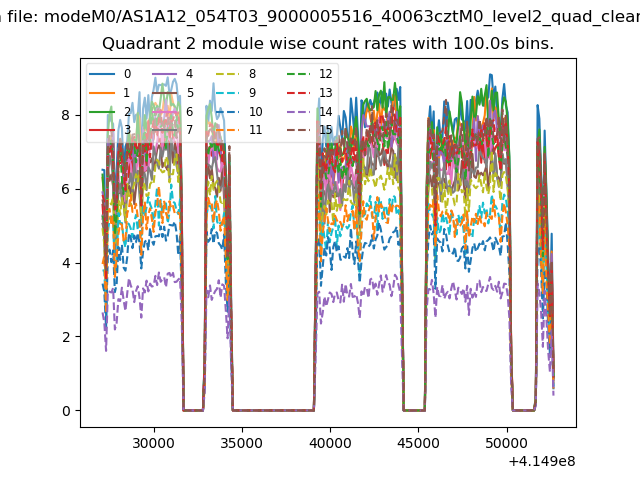
| Module-wise count rates for Quadrant B Data is divided into 100 sec bins |
 |
 |
| Module-wise count rates for Quadrant C Data is divided into 100 sec bins |
 |
 |
| Module-wise count rates for Quadrant D Data is divided into 100 sec bins |
 |
 |
| Parameter | Plot |
|---|---|
| CZT HV Monitor | 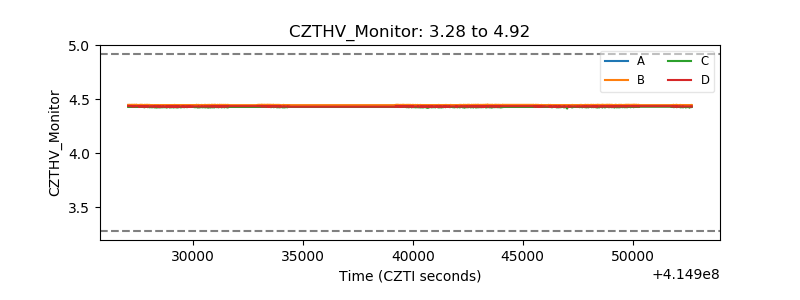 |
| D_VDD | 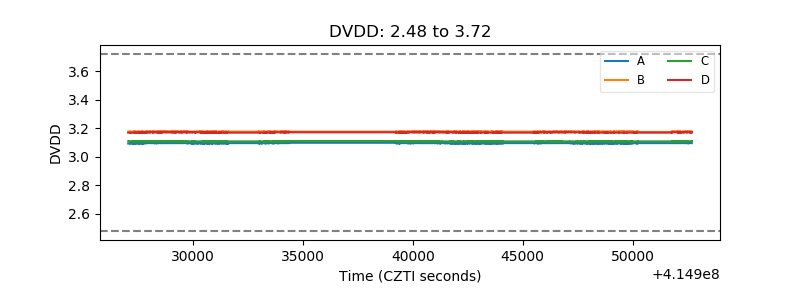 |
| Temperature 1 | 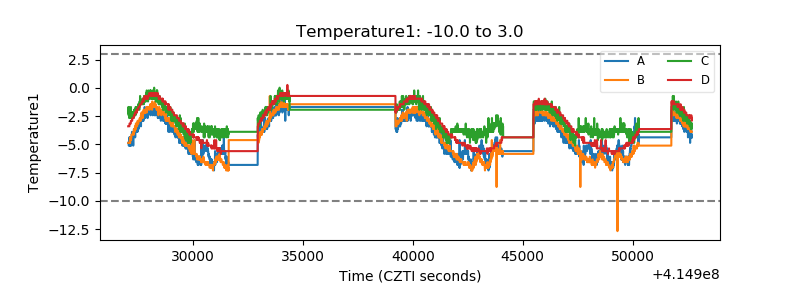 |
| Veto HV Monitor | 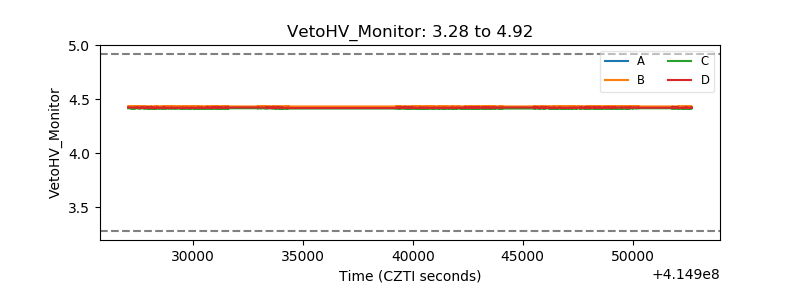 |
| Veto LLD | 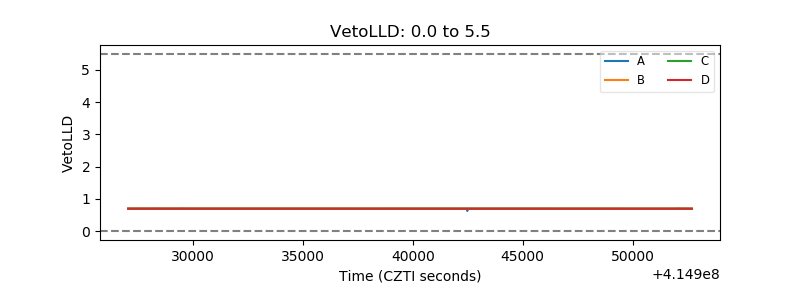 |
| Alpha Counter | 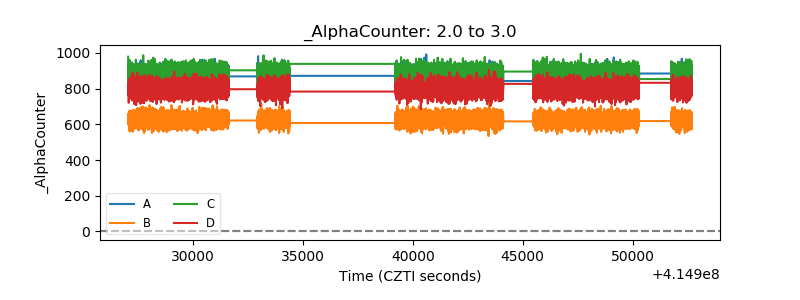 |
| _CPM_Rate | 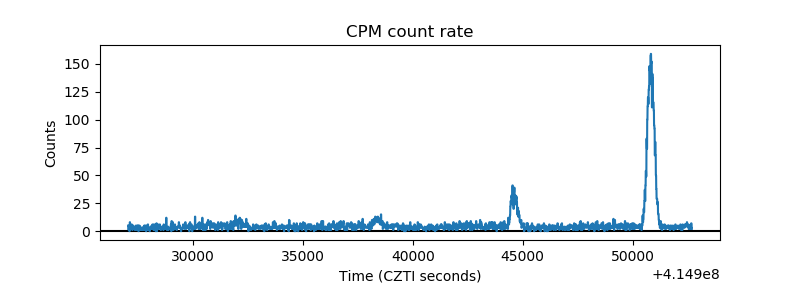 |
| CZT Counter | 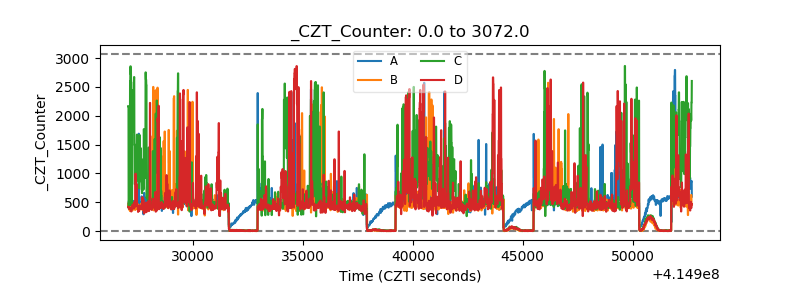 |
| +2.5 Volts monitor | 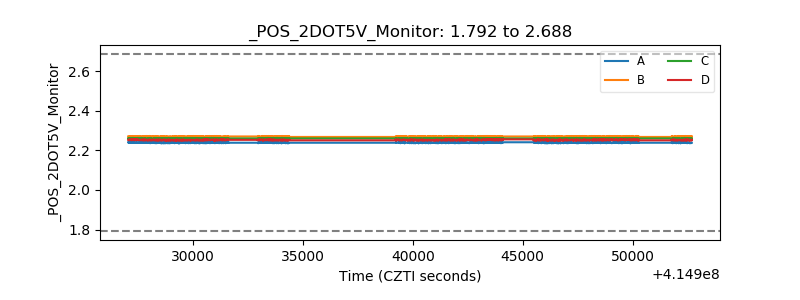 |
| +5 Volts monitor | 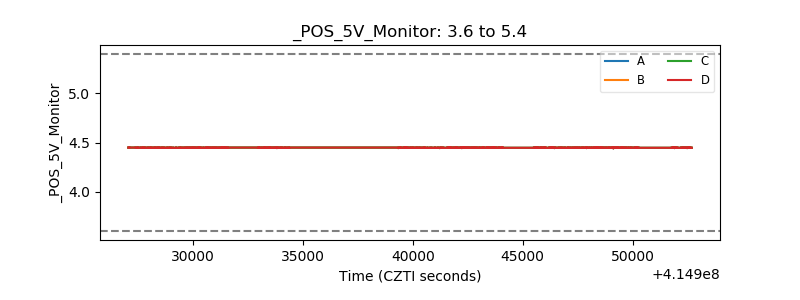 |
| _ROLL_ROT | 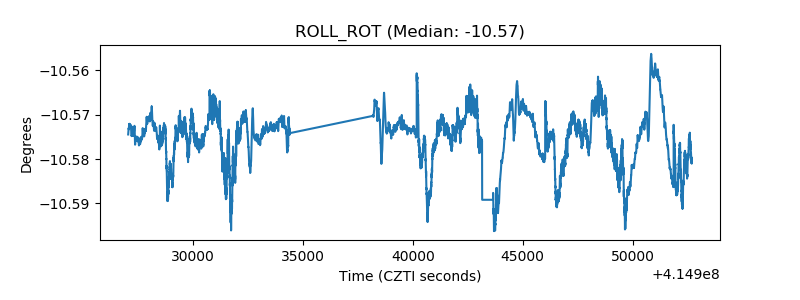 |
| _Roll_DEC |  |
| _Roll_RA | 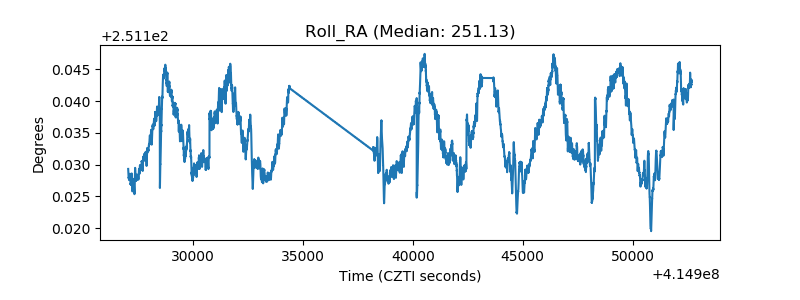 |
| Veto Counter | 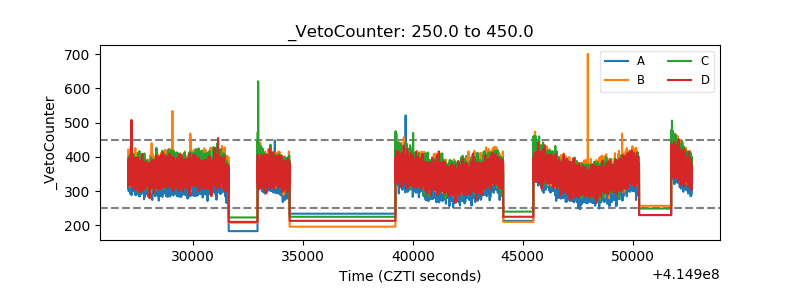 |