| Param | Original file | Final file |
|---|---|---|
| Filename | modeM0/AS1A12_054T03_9000005516_40064cztM0_level2.fits | modeM0/AS1A12_054T03_9000005516_40064cztM0_level2_quad_clean.evt |
| Size (bytes) | 357,255,360 | 26,622,720 |
| Size | 340.7 MB | 25.4 MB |
| Events in quadrant A | 3,249,643 | 98,652 |
| Events in quadrant B | 2,339,538 | 120,575 |
| Events in quadrant C | 4,288,945 | 110,098 |
| Events in quadrant D | 2,930,296 | 102,847 |
| Mode M9 | |||
|---|---|---|---|
| Quadrant | BADHDUFLAG | Total packets | Discarded packets |
| A | 0 | 78 | 59 |
| B | 0 | 78 | 59 |
| C | 0 | 78 | 59 |
| D | 0 | 79 | 59 |
| Mode SS | |||
|---|---|---|---|
| Quadrant | BADHDUFLAG | Total packets | Discarded packets |
| A | 0 | 502 | 394 |
| B | 0 | 502 | 394 |
| C | 0 | 502 | 394 |
| D | 0 | 502 | 394 |
| Mode M0 | |||
|---|---|---|---|
| Quadrant | BADHDUFLAG | Total packets | Discarded packets |
| A | 0 | 58790 | 45690 |
| B | 0 | 53762 | 43003 |
| C | 0 | 75049 | 58684 |
| D | 0 | 63965 | 51384 |
| Quadrant | Total seconds | Saturated seconds | Saturation percentage |
|---|---|---|---|
| A | 5342 | 199 | 3.725197% |
| B | 5341 | 8 | 0.149785% |
| C | 5342 | 243 | 4.548858% |
| D | 5342 | 131 | 2.452265% |
Noise dominated data is calculated using 1-second bins in cleaned event files. If a bin has >2000 counts, and if more than 50% of those come from <1% of pixels, then it is considered to be noise-dominated and hence unusable.
| Quadrant | # 1 sec bins | Bins with >0 counts | Bins with >2000 counts | High rate bins dominated by noise | Noise dominated (total time) | Noise dominated (detector-on time) | Marked lightcurve |
|---|---|---|---|---|---|---|---|
| A | 7044 | 5343 | 136 | 136 | 1.93% | 2.55% | 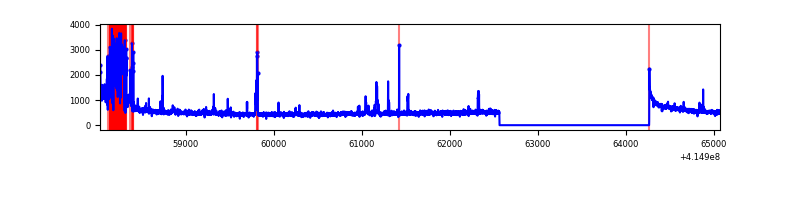 |
| B | 7043 | 5342 | 0 | 0 | 0.00% | 0.00% | 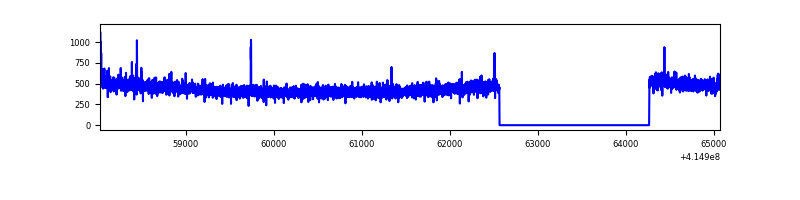 |
| C | 7044 | 5343 | 197 | 197 | 2.80% | 3.69% | 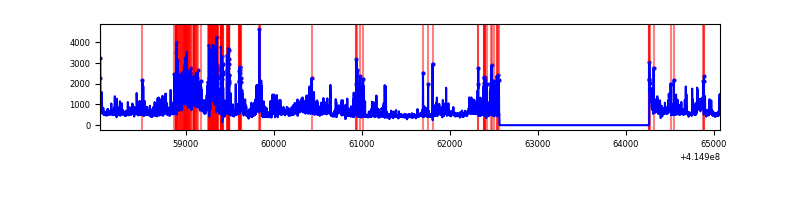 |
| D | 7044 | 5343 | 97 | 97 | 1.38% | 1.82% | 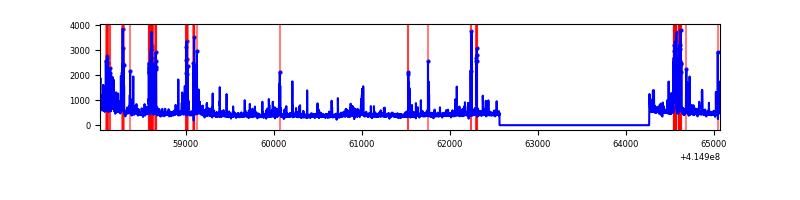 |
Top three noisy pixels from each quadrant. If the there are fewer than three noisy pixels in the level2.evt file, extra rows are filled as -1
| Pixel properties | Quadrant properties | ||||||
|---|---|---|---|---|---|---|---|
| Quadrant | DetID | PixID | Counts | Sigma | Mean | Median | Sigma |
| A | 10 | 83 | 445069 | 3779.8 | 576 | 565 | 117.6 |
| A | 6 | 10 | 386338 | 3280.39 | 576 | 565 | 117.6 |
| A | 2 | 79 | 63440 | 534.65 | 576 | 565 | 117.6 |
| B | 0 | 230 | 19114 | 162.15 | 586 | 569 | 114.4 |
| B | 4 | 171 | 15269 | 128.53 | 586 | 569 | 114.4 |
| B | 12 | 111 | 14354 | 120.53 | 586 | 569 | 114.4 |
| C | 9 | 187 | 1778514 | 13284.43 | 570 | 576 | 133.8 |
| C | 15 | 214 | 219123 | 1632.94 | 570 | 576 | 133.8 |
| C | 0 | 10 | 42425 | 312.69 | 570 | 576 | 133.8 |
| D | 2 | 250 | 385398 | 2758.74 | 571 | 555 | 139.5 |
| D | 12 | 227 | 110686 | 789.47 | 571 | 555 | 139.5 |
| D | 13 | 249 | 101196 | 721.44 | 571 | 555 | 139.5 |
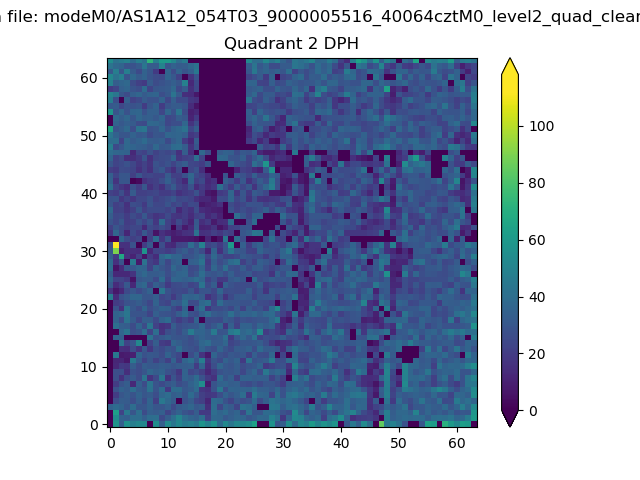
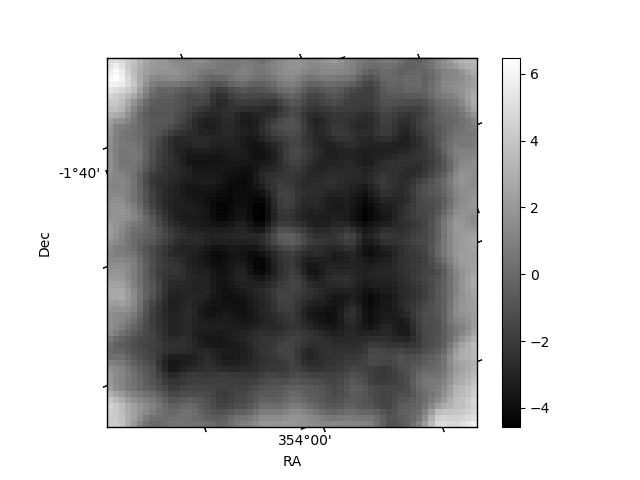
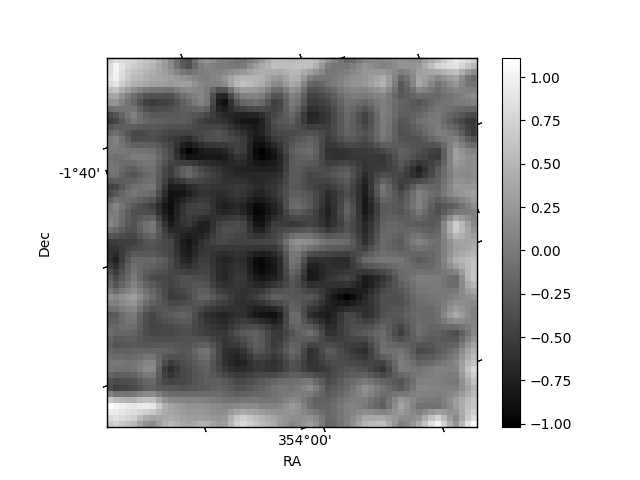
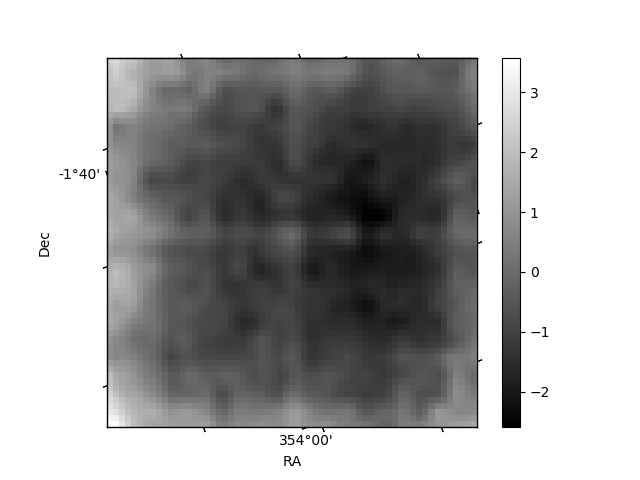
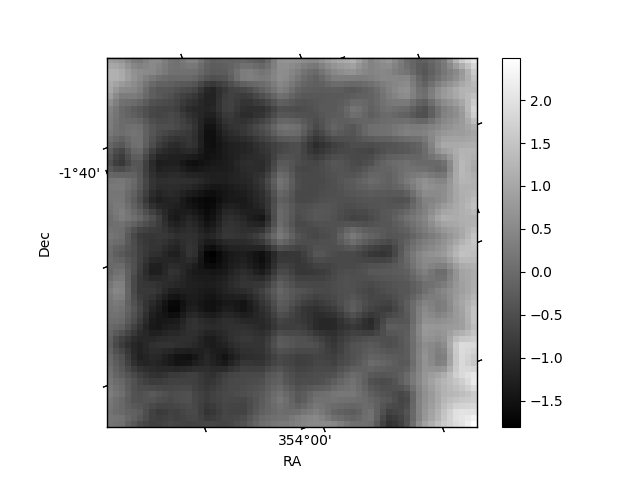
Histogram calculated using DETX and DETY for each event in the final _common_clean file
| Quadrant A | 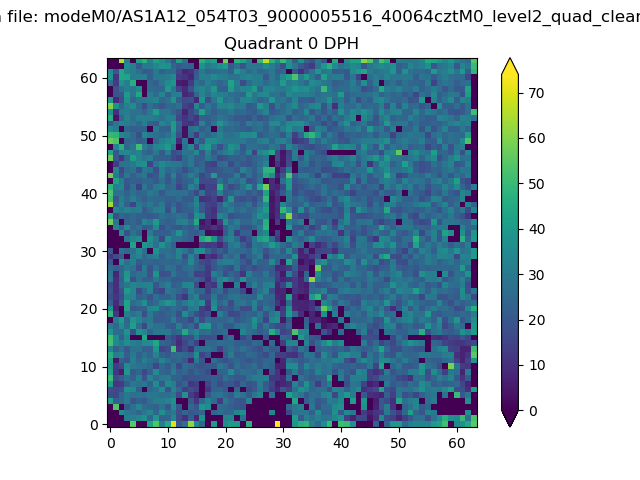 |
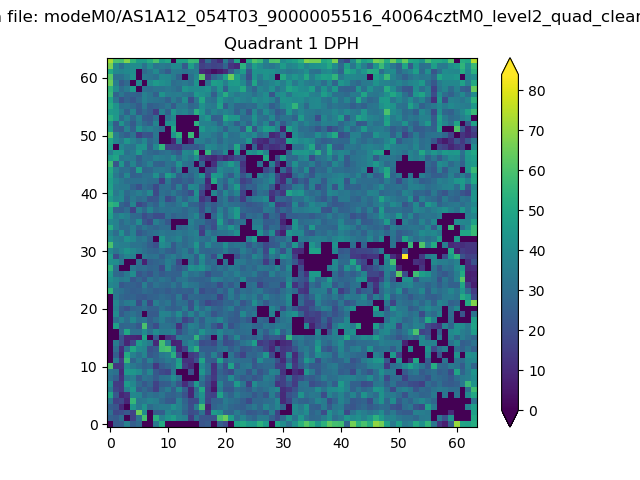 |
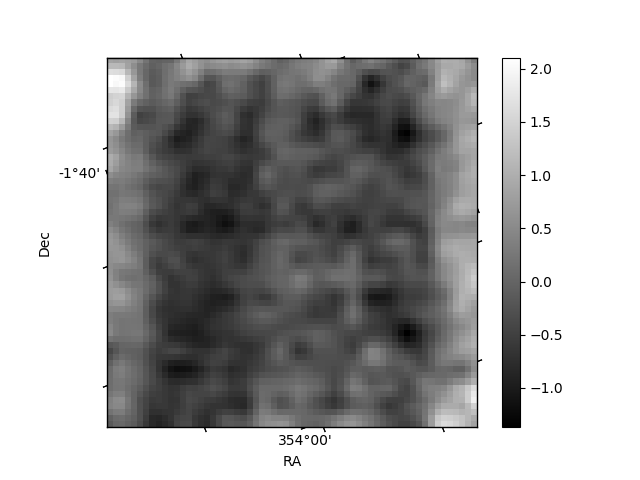
Quadrant B |
|---|---|---|---|
| Quadrant D | 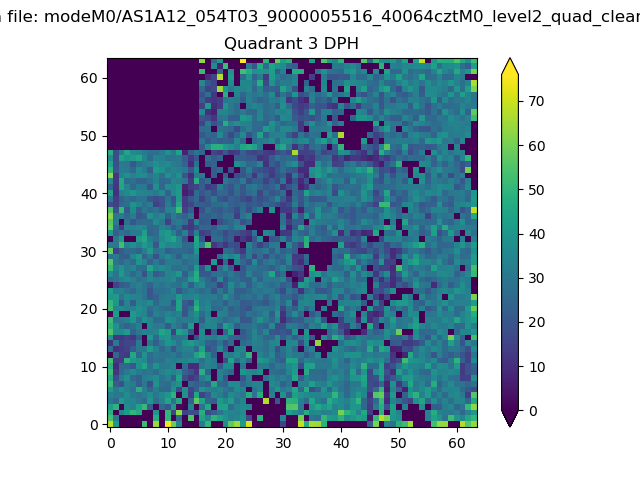 |
 |
Quadrant C |
| Plot type | Count rate plots | Images |
|---|---|---|
| Comparison with Poisson distribution Blue bars denote a histogram of data divided into 1 sec bins. Red curve is a Poisson curve with rate = median count rate of data. |
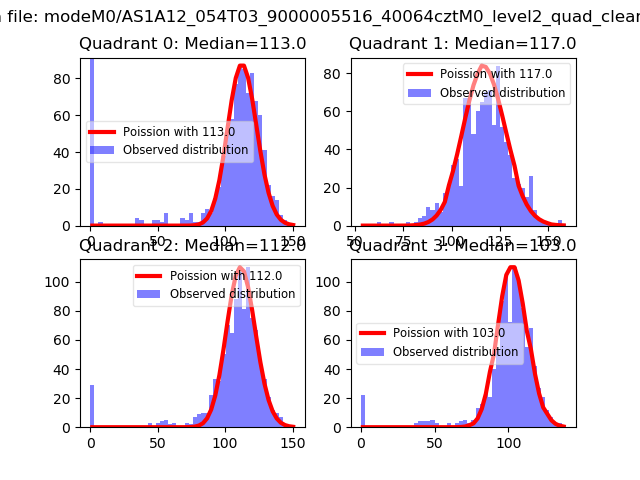 |
 |
| Quadrant-wise count rates Data is divided into 100 sec bins |
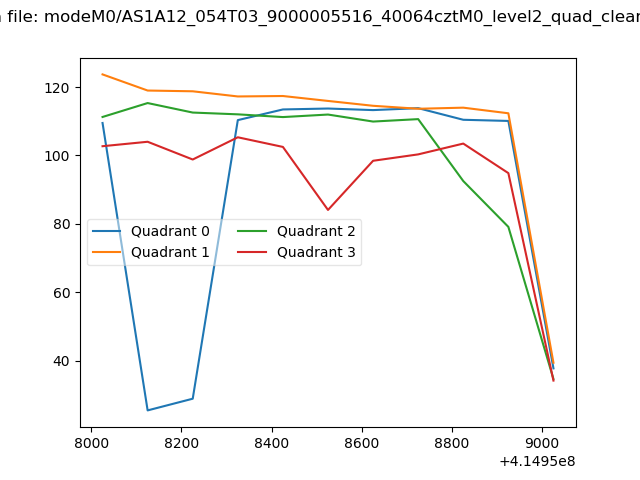 |
|
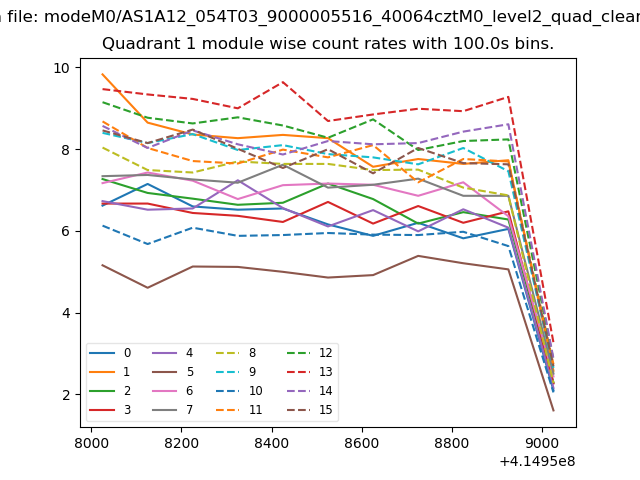
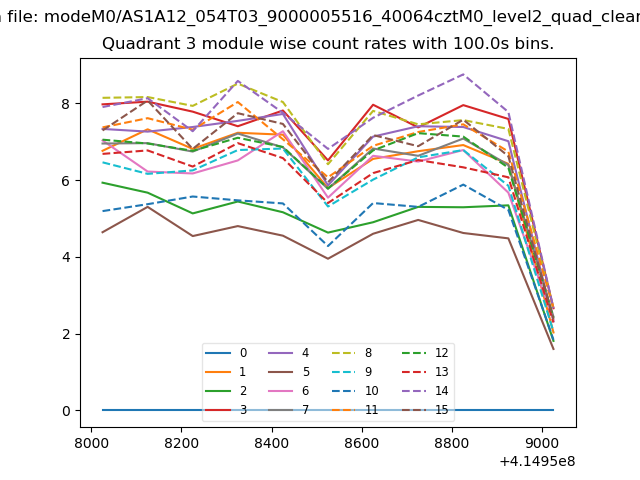
| Module-wise count rates for Quadrant A Data is divided into 100 sec bins |
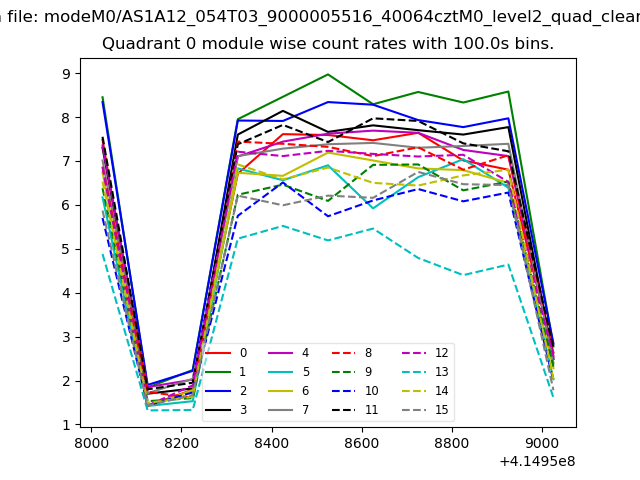 |
 |
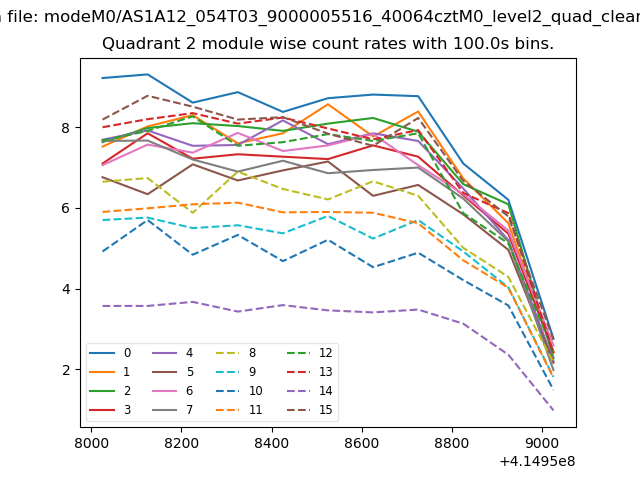
| Module-wise count rates for Quadrant B Data is divided into 100 sec bins |
 |
 |
| Module-wise count rates for Quadrant C Data is divided into 100 sec bins |
 |
 |
| Module-wise count rates for Quadrant D Data is divided into 100 sec bins |
 |
 |
| Parameter | Plot |
|---|---|
| CZT HV Monitor | 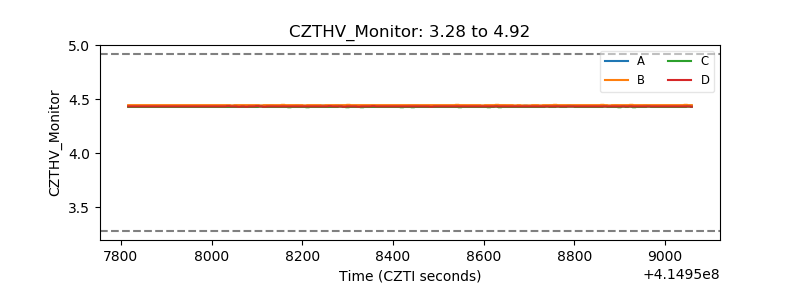 |
| D_VDD | 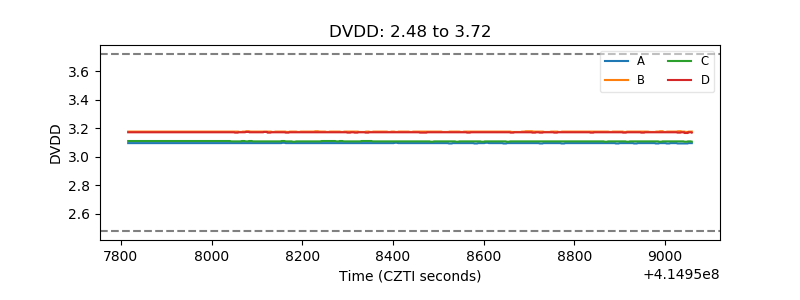 |
| Temperature 1 | 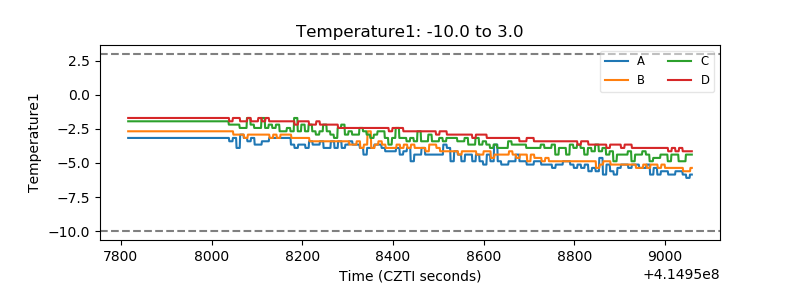 |
| Veto HV Monitor | 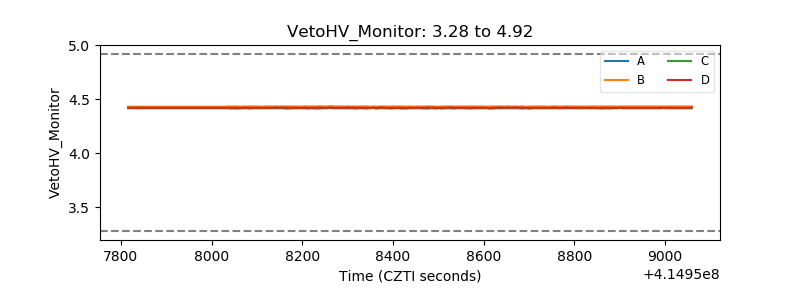 |
| Veto LLD | 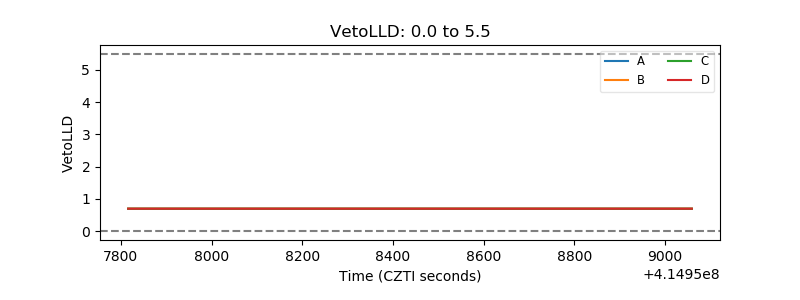 |
| Alpha Counter | 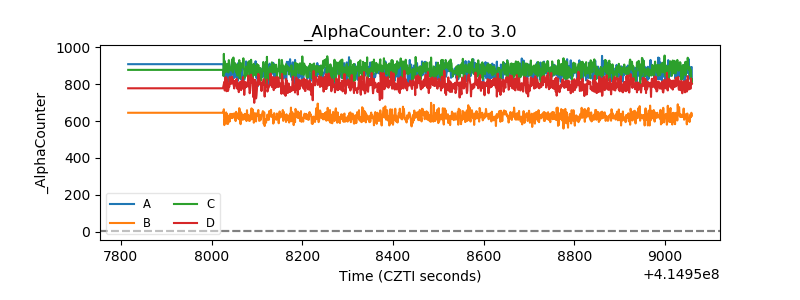 |
| _CPM_Rate | 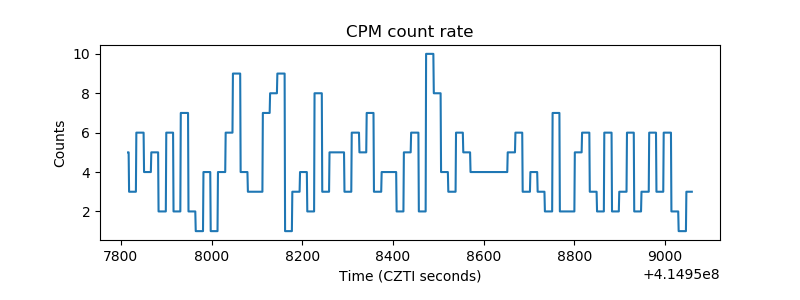 |
| CZT Counter | 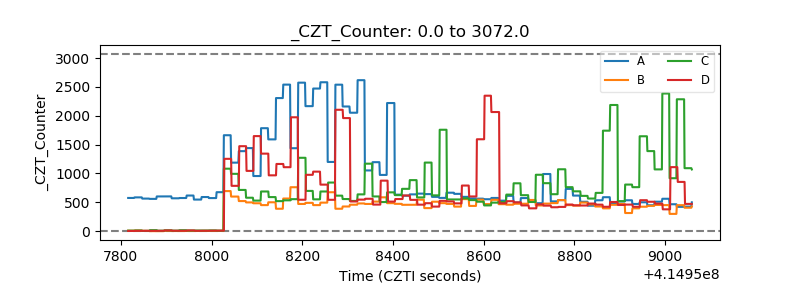 |
| +2.5 Volts monitor | 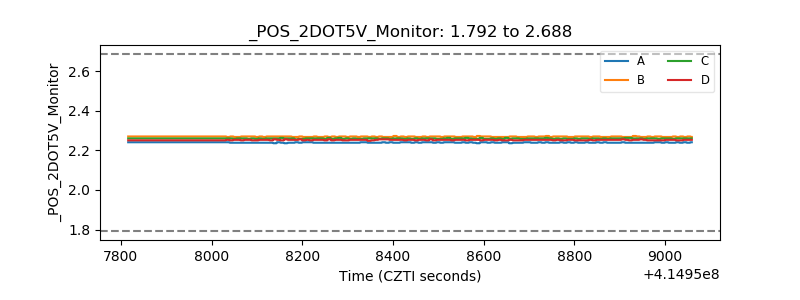 |
| +5 Volts monitor |  |
| _ROLL_ROT | 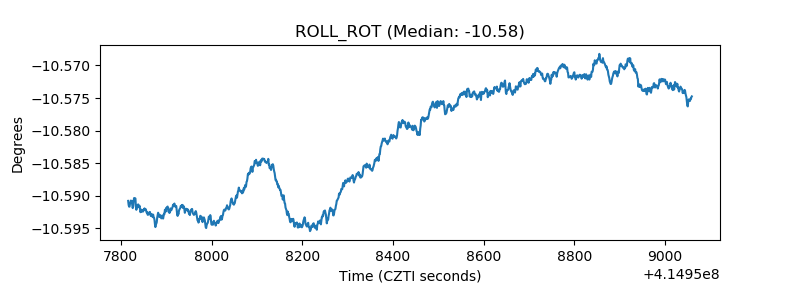 |
| _Roll_DEC | 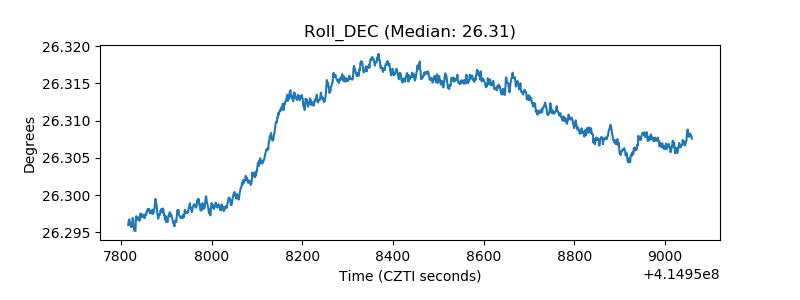 |
| _Roll_RA | 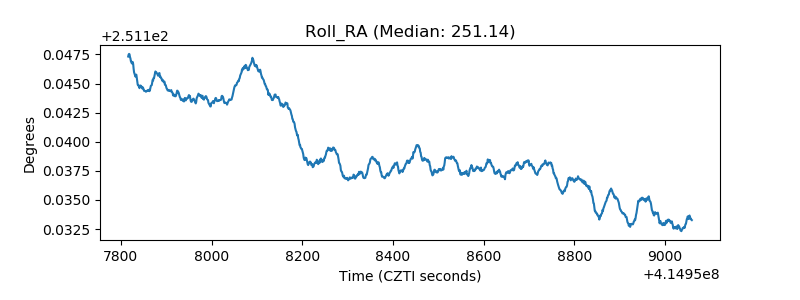 |
| Veto Counter | 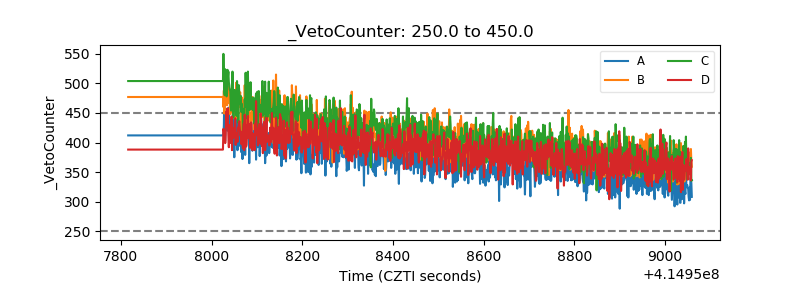 |