| Param | Original file | Final file |
|---|---|---|
| Filename | modeM0/AS1A12_054T03_9000005516_40067cztM0_level2.fits | modeM0/AS1A12_054T03_9000005516_40067cztM0_level2_quad_clean.evt |
| Size (bytes) | 357,563,520 | 95,022,720 |
| Size | 341.0 MB | 90.6 MB |
| Events in quadrant A | 2,899,676 | 635,448 |
| Events in quadrant B | 2,502,443 | 665,257 |
| Events in quadrant C | 4,197,120 | 622,219 |
| Events in quadrant D | 3,209,822 | 570,838 |
| Mode M9 | |||
|---|---|---|---|
| Quadrant | BADHDUFLAG | Total packets | Discarded packets |
| A | 0 | 36 | 0 |
| B | 0 | 36 | 0 |
| C | 0 | 36 | 0 |
| D | 0 | 36 | 0 |
| Mode SS | |||
|---|---|---|---|
| Quadrant | BADHDUFLAG | Total packets | Discarded packets |
| A | 0 | 114 | 0 |
| B | 0 | 114 | 0 |
| C | 0 | 114 | 0 |
| D | 0 | 114 | 0 |
| Mode M0 | |||
|---|---|---|---|
| Quadrant | BADHDUFLAG | Total packets | Discarded packets |
| A | 0 | 12118 | 3 |
| B | 0 | 11192 | 2 |
| C | 0 | 16157 | 2 |
| D | 0 | 13438 | 2 |
| Quadrant | Total seconds | Saturated seconds | Saturation percentage |
|---|---|---|---|
| A | 5481 | 19 | 0.346652% |
| B | 5481 | 9 | 0.164204% |
| C | 5481 | 236 | 4.305784% |
| D | 5481 | 177 | 3.229338% |
Noise dominated data is calculated using 1-second bins in cleaned event files. If a bin has >2000 counts, and if more than 50% of those come from <1% of pixels, then it is considered to be noise-dominated and hence unusable.
| Quadrant | # 1 sec bins | Bins with >0 counts | Bins with >2000 counts | High rate bins dominated by noise | Noise dominated (total time) | Noise dominated (detector-on time) | Marked lightcurve |
|---|---|---|---|---|---|---|---|
| A | 9035 | 5483 | 5 | 5 | 0.06% | 0.09% | 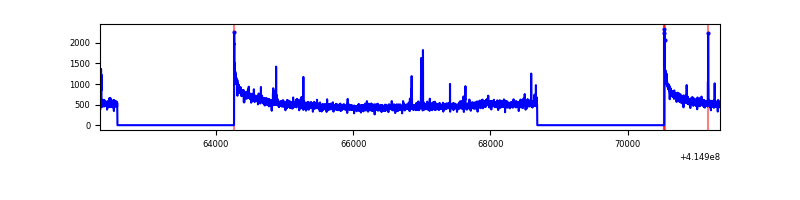 |
| B | 9035 | 5483 | 1 | 1 | 0.01% | 0.02% | 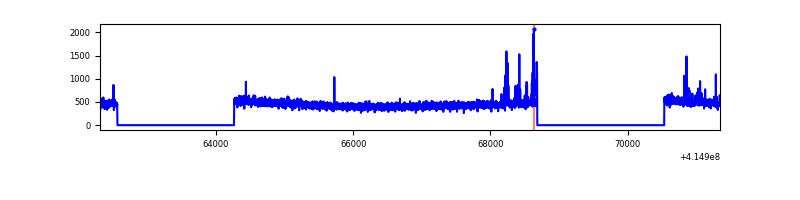 |
| C | 9035 | 5483 | 224 | 224 | 2.48% | 4.09% | 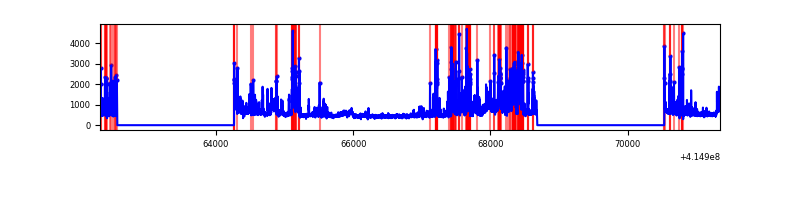 |
| D | 9035 | 5483 | 155 | 155 | 1.72% | 2.83% | 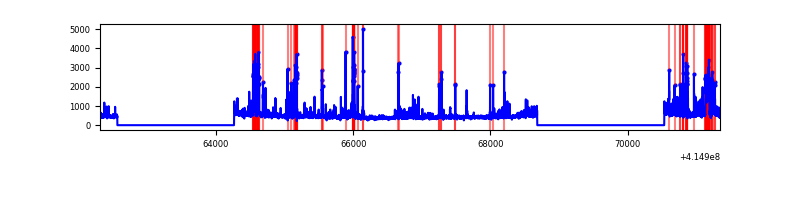 |
Top three noisy pixels from each quadrant. If the there are fewer than three noisy pixels in the level2.evt file, extra rows are filled as -1
| Pixel properties | Quadrant properties | ||||||
|---|---|---|---|---|---|---|---|
| Quadrant | DetID | PixID | Counts | Sigma | Mean | Median | Sigma |
| A | 10 | 83 | 451195 | 3626.75 | 611 | 600 | 124.2 |
| A | 7 | 3 | 26028 | 204.66 | 611 | 600 | 124.2 |
| A | 12 | 189 | 20202 | 157.77 | 611 | 600 | 124.2 |
| B | 15 | 201 | 50805 | 420.69 | 615 | 598 | 119.3 |
| B | 4 | 171 | 20950 | 170.53 | 615 | 598 | 119.3 |
| B | 12 | 111 | 14987 | 120.57 | 615 | 598 | 119.3 |
| C | 9 | 187 | 1542159 | 11047.97 | 598 | 603 | 139.5 |
| C | 15 | 214 | 224515 | 1604.72 | 598 | 603 | 139.5 |
| C | 14 | 254 | 50884 | 360.35 | 598 | 603 | 139.5 |
| D | 2 | 250 | 200506 | 1386.63 | 594 | 577 | 144.2 |
| D | 12 | 227 | 191973 | 1327.45 | 594 | 577 | 144.2 |
| D | 2 | 153 | 183611 | 1269.46 | 594 | 577 | 144.2 |
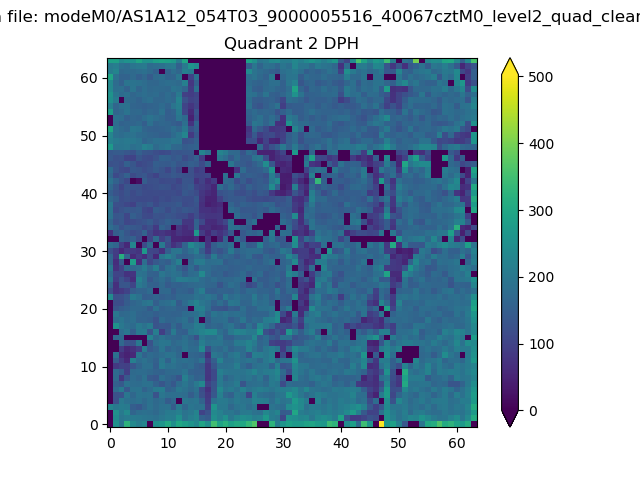
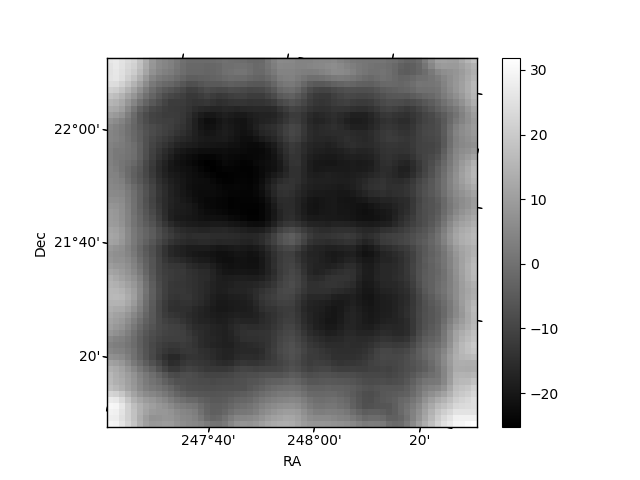
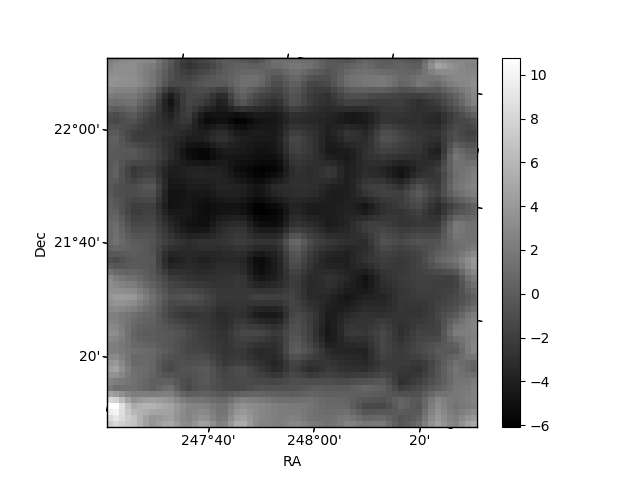
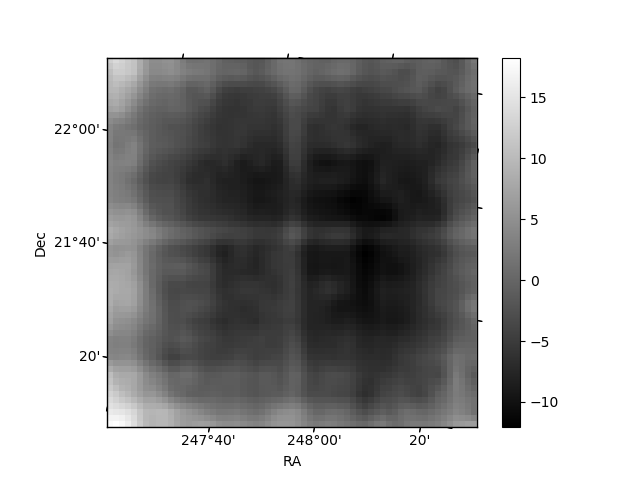
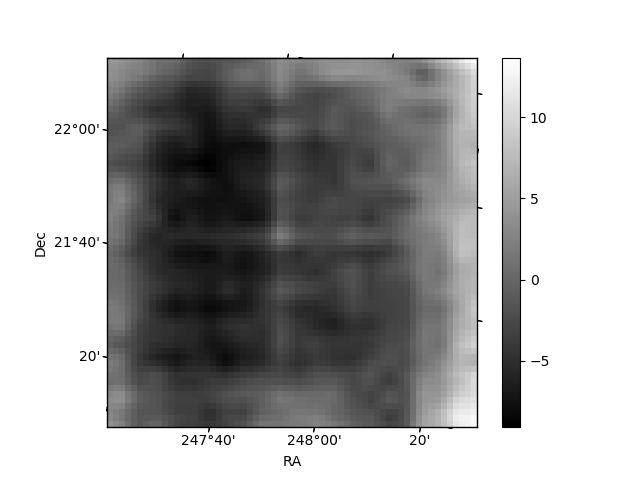
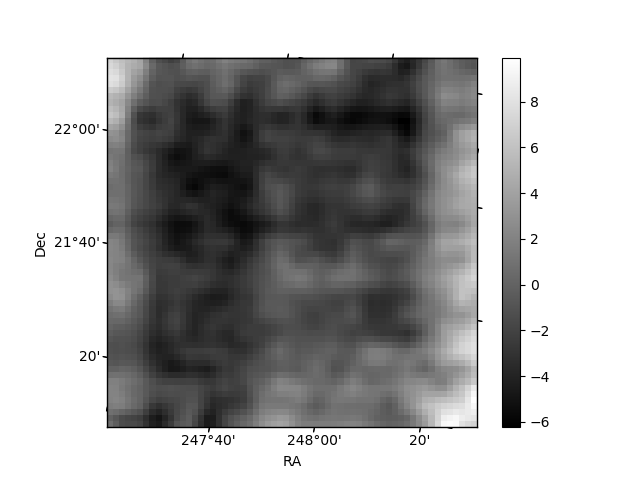
Histogram calculated using DETX and DETY for each event in the final _common_clean file
| Quadrant A | 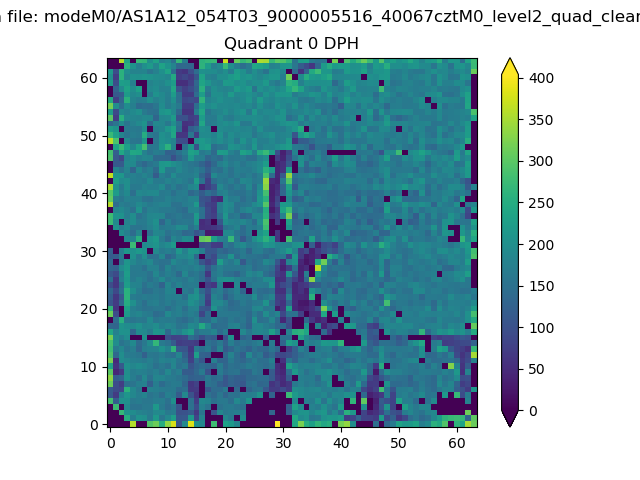 |
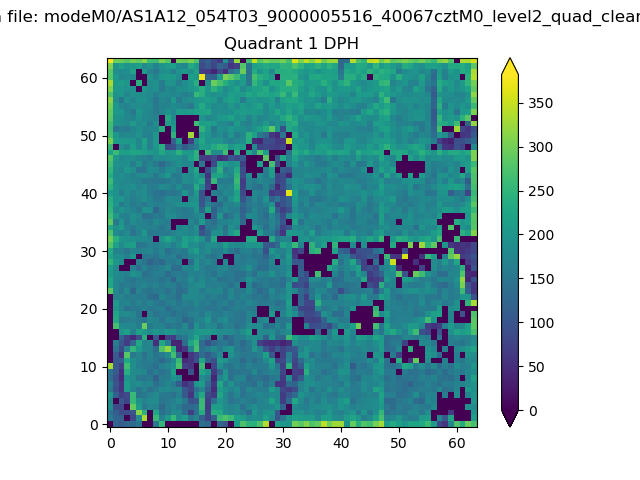 |
Quadrant B |
|---|---|---|---|
| Quadrant D | 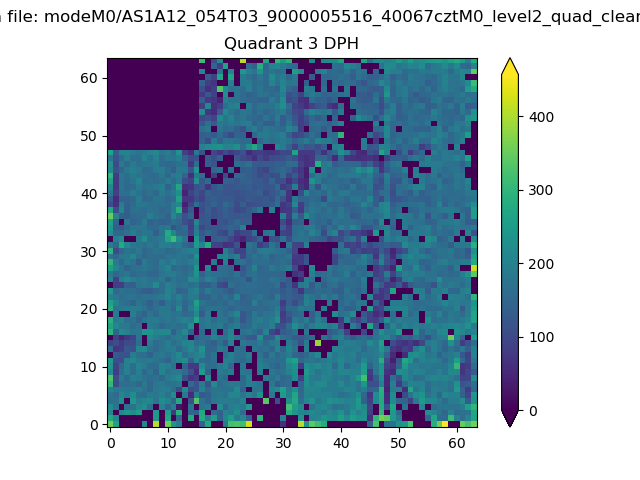 |
 |
Quadrant C |
| Plot type | Count rate plots | Images |
|---|---|---|
| Comparison with Poisson distribution Blue bars denote a histogram of data divided into 1 sec bins. Red curve is a Poisson curve with rate = median count rate of data. |
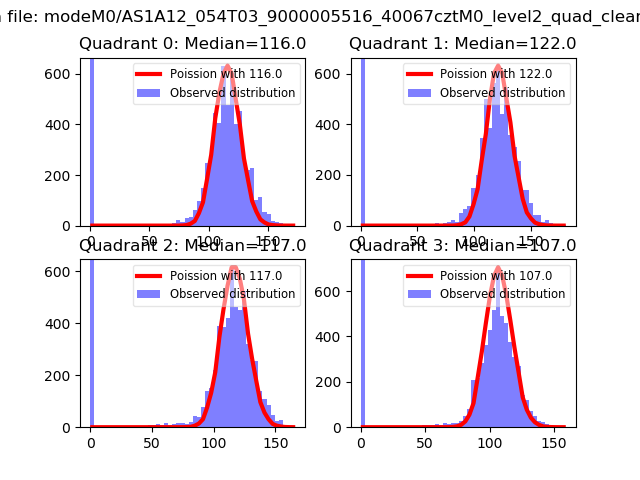 |
 |
| Quadrant-wise count rates Data is divided into 100 sec bins |
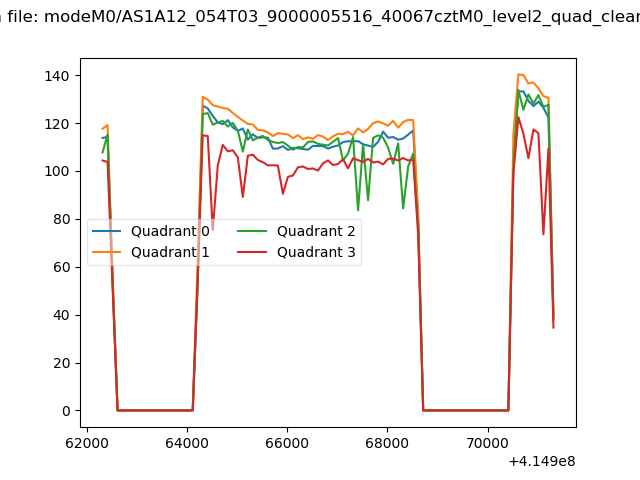 |
|
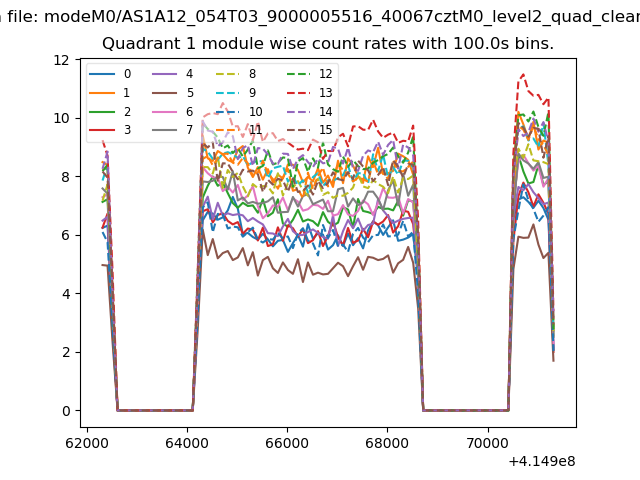
| Module-wise count rates for Quadrant A Data is divided into 100 sec bins |
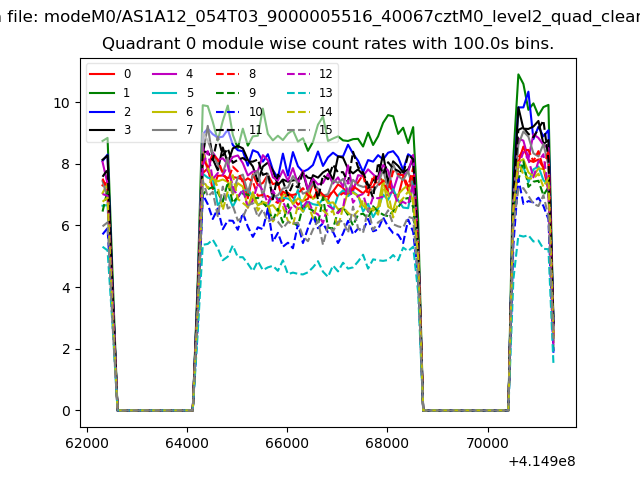 |
 |
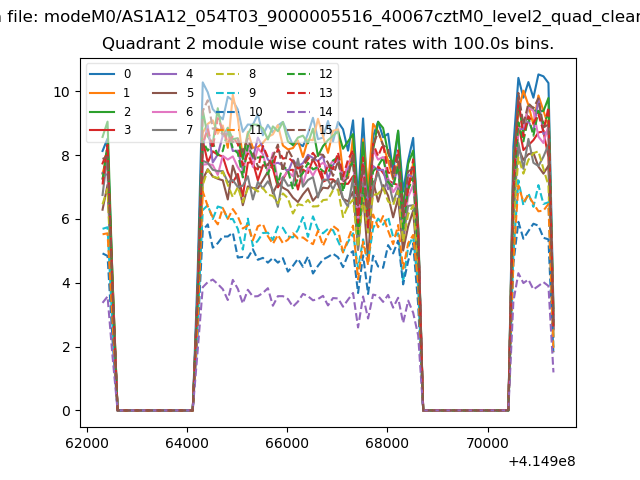
| Module-wise count rates for Quadrant B Data is divided into 100 sec bins |
 |
 |
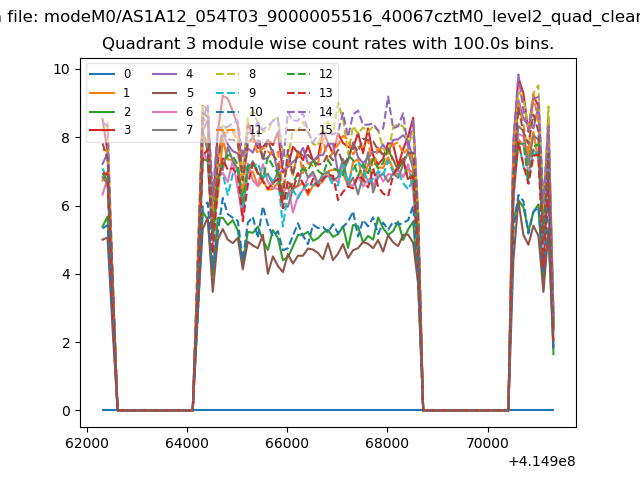
| Module-wise count rates for Quadrant C Data is divided into 100 sec bins |
 |
 |
| Module-wise count rates for Quadrant D Data is divided into 100 sec bins |
 |
 |
| Parameter | Plot |
|---|---|
| CZT HV Monitor | 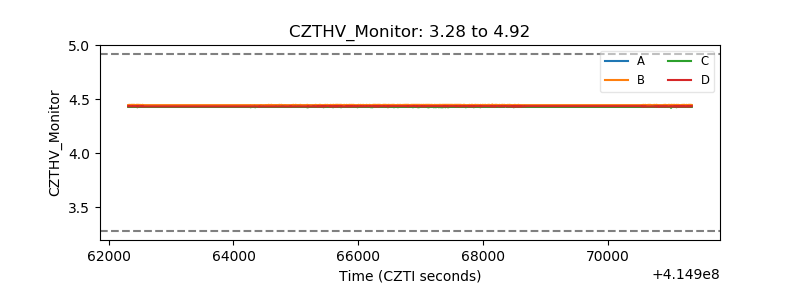 |
| D_VDD | 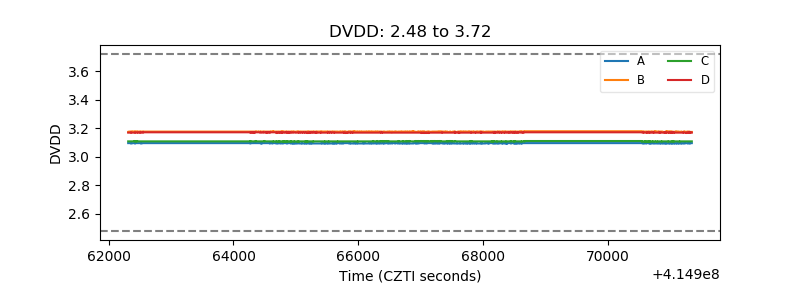 |
| Temperature 1 | 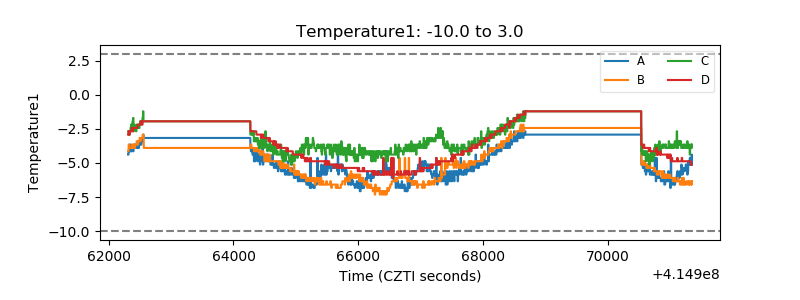 |
| Veto HV Monitor | 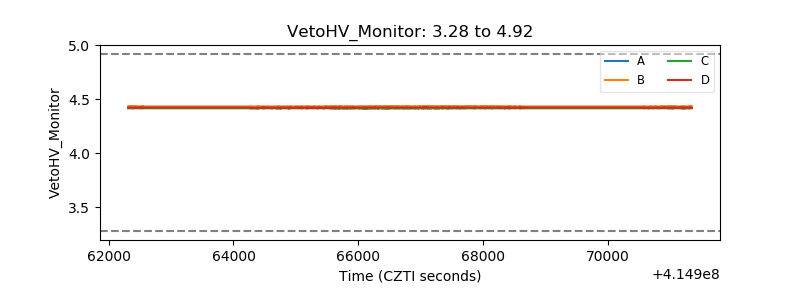 |
| Veto LLD | 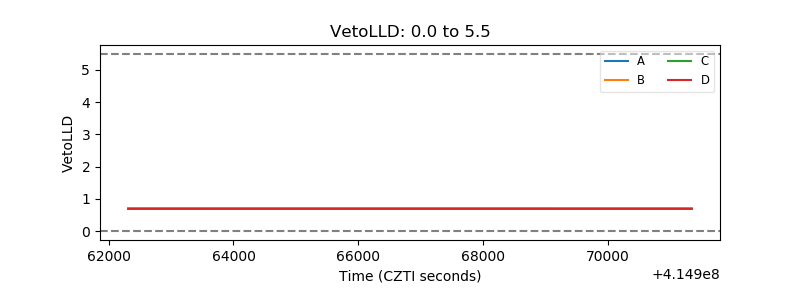 |
| Alpha Counter | 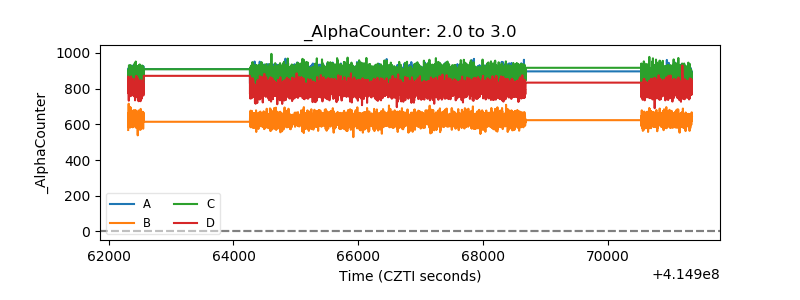 |
| _CPM_Rate | 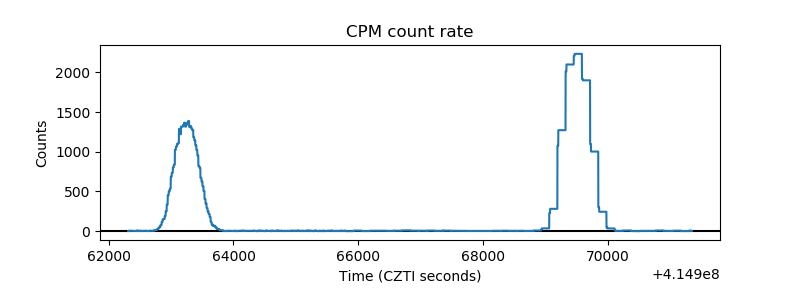 |
| CZT Counter | 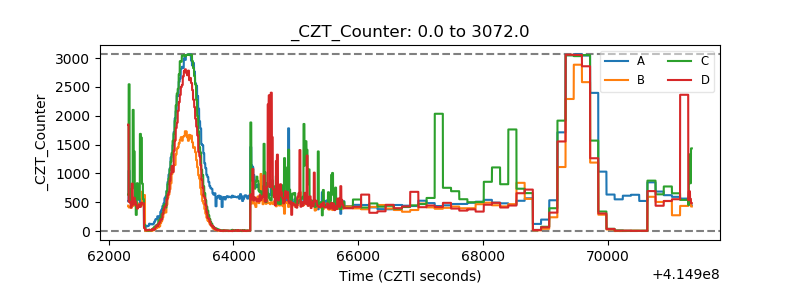 |
| +2.5 Volts monitor | 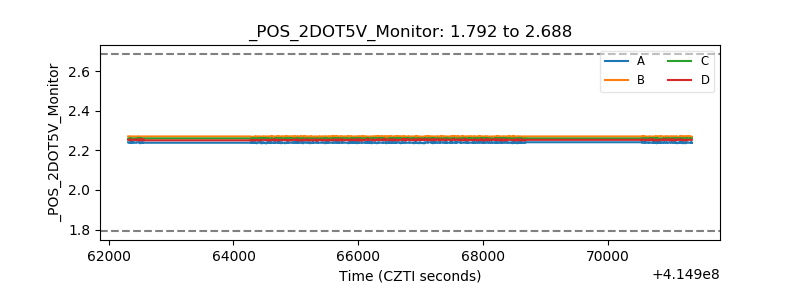 |
| +5 Volts monitor | 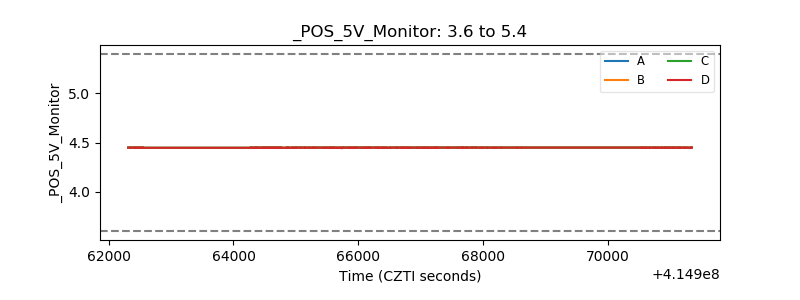 |
| _ROLL_ROT | 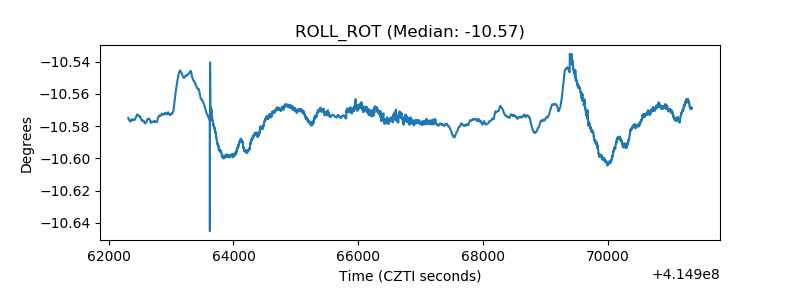 |
| _Roll_DEC | 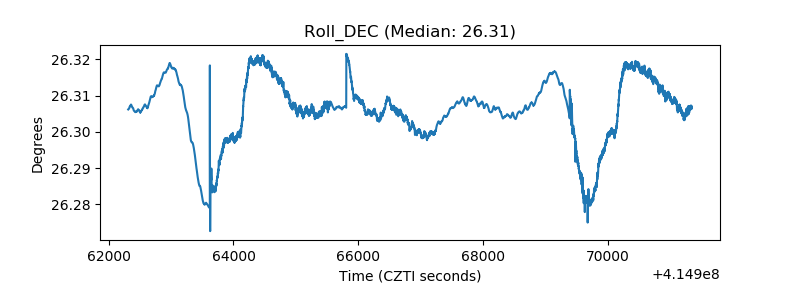 |
| _Roll_RA | 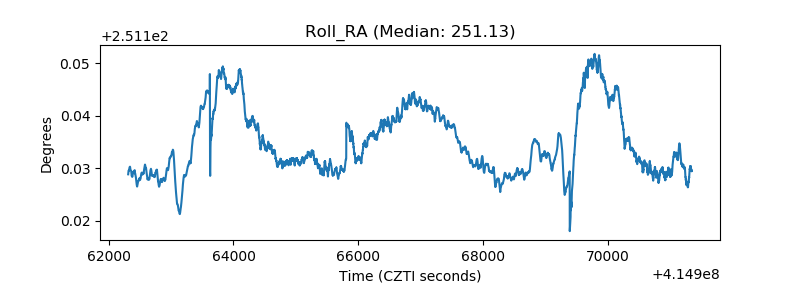 |
| Veto Counter | 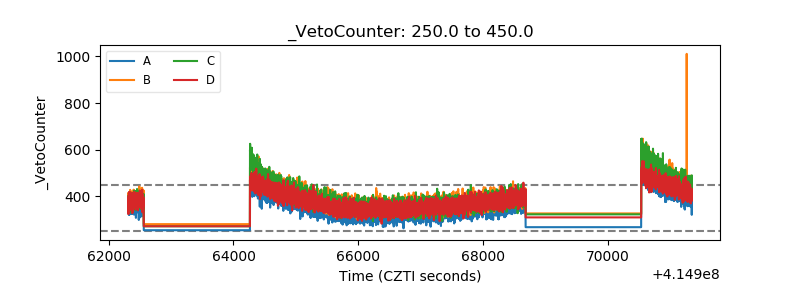 |