| Param | Original file | Final file |
|---|---|---|
| Filename | modeM0/AS1A12_054T03_9000005516_40068cztM0_level2.fits | modeM0/AS1A12_054T03_9000005516_40068cztM0_level2_quad_clean.evt |
| Size (bytes) | 339,030,720 | 94,334,400 |
| Size | 323.3 MB | 90.0 MB |
| Events in quadrant A | 2,899,005 | 632,395 |
| Events in quadrant B | 2,462,333 | 664,755 |
| Events in quadrant C | 3,666,153 | 625,851 |
| Events in quadrant D | 3,113,641 | 565,912 |
| Mode M9 | |||
|---|---|---|---|
| Quadrant | BADHDUFLAG | Total packets | Discarded packets |
| A | 0 | 38 | 0 |
| B | 0 | 38 | 0 |
| C | 0 | 38 | 0 |
| D | 0 | 38 | 0 |
| Mode SS | |||
|---|---|---|---|
| Quadrant | BADHDUFLAG | Total packets | Discarded packets |
| A | 0 | 110 | 0 |
| B | 0 | 110 | 0 |
| C | 0 | 110 | 0 |
| D | 0 | 110 | 0 |
| Mode M0 | |||
|---|---|---|---|
| Quadrant | BADHDUFLAG | Total packets | Discarded packets |
| A | 0 | 11879 | 3 |
| B | 0 | 10852 | 2 |
| C | 0 | 14321 | 2 |
| D | 0 | 12912 | 2 |
| Quadrant | Total seconds | Saturated seconds | Saturation percentage |
|---|---|---|---|
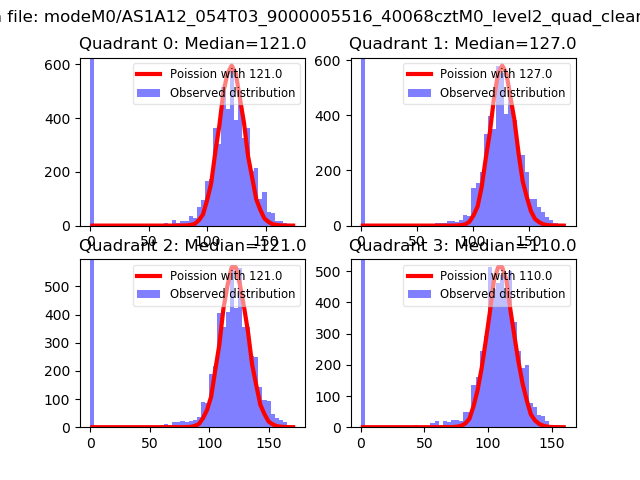
| A | 5246 | 24 | 0.457491% |
| B | 5246 | 24 | 0.457491% |
| C | 5246 | 130 | 2.478079% |
| D | 5246 | 144 | 2.744949% |
Noise dominated data is calculated using 1-second bins in cleaned event files. If a bin has >2000 counts, and if more than 50% of those come from <1% of pixels, then it is considered to be noise-dominated and hence unusable.
| Quadrant | # 1 sec bins | Bins with >0 counts | Bins with >2000 counts | High rate bins dominated by noise | Noise dominated (total time) | Noise dominated (detector-on time) | Marked lightcurve |
|---|---|---|---|---|---|---|---|
| A | 9070 | 5248 | 18 | 18 | 0.20% | 0.34% | 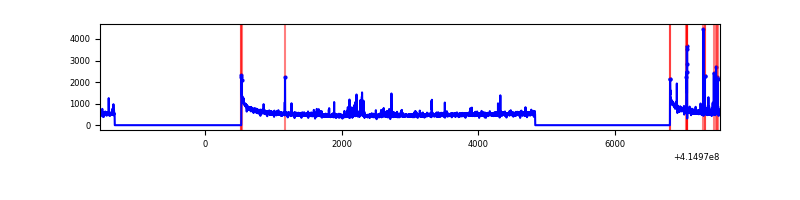 |
| B | 9070 | 5248 | 5 | 5 | 0.06% | 0.10% | 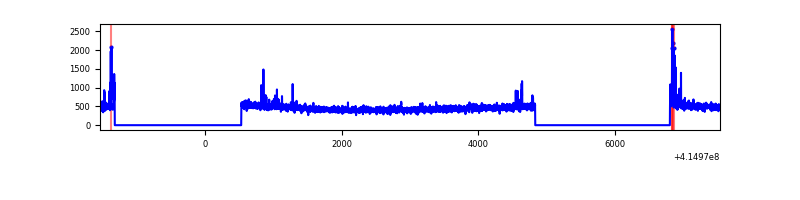 |
| C | 9070 | 5248 | 113 | 113 | 1.25% | 2.15% | 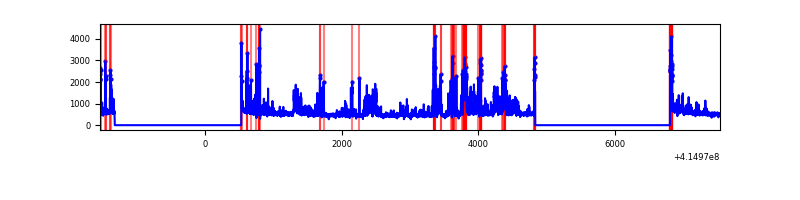 |
| D | 9070 | 5248 | 122 | 122 | 1.35% | 2.32% | 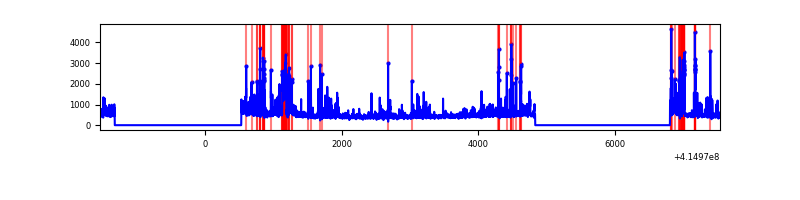 |
Top three noisy pixels from each quadrant. If the there are fewer than three noisy pixels in the level2.evt file, extra rows are filled as -1
| Pixel properties | Quadrant properties | ||||||
|---|---|---|---|---|---|---|---|
| Quadrant | DetID | PixID | Counts | Sigma | Mean | Median | Sigma |
| A | 10 | 83 | 440573 | 3605.36 | 596 | 586 | 122.0 |
| A | 2 | 79 | 52520 | 425.56 | 596 | 586 | 122.0 |
| A | 13 | 248 | 51369 | 416.13 | 596 | 586 | 122.0 |
| B | 4 | 171 | 73946 | 635.29 | 599 | 584 | 115.5 |
| B | 15 | 201 | 26292 | 222.62 | 599 | 584 | 115.5 |
| B | 12 | 111 | 14219 | 118.07 | 599 | 584 | 115.5 |
| C | 9 | 187 | 996783 | 7308.67 | 584 | 590 | 136.3 |
| C | 15 | 214 | 216234 | 1582.09 | 584 | 590 | 136.3 |
| C | 14 | 254 | 127365 | 930.1 | 584 | 590 | 136.3 |
| D | 12 | 227 | 210059 | 1487.77 | 575 | 559 | 140.8 |
| D | 13 | 249 | 179956 | 1274.0 | 575 | 559 | 140.8 |
| D | 2 | 153 | 177958 | 1259.81 | 575 | 559 | 140.8 |
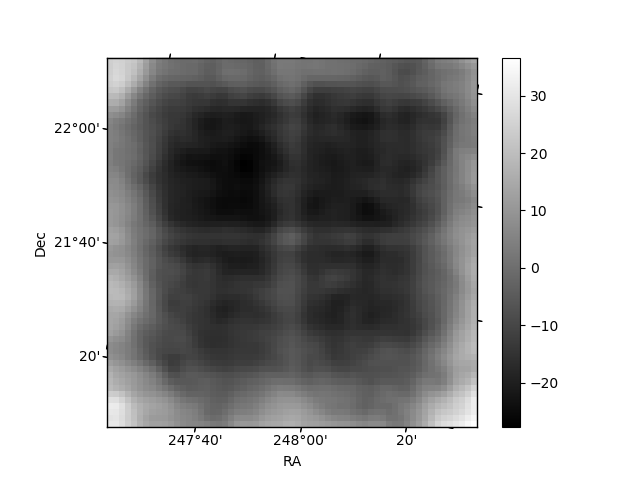
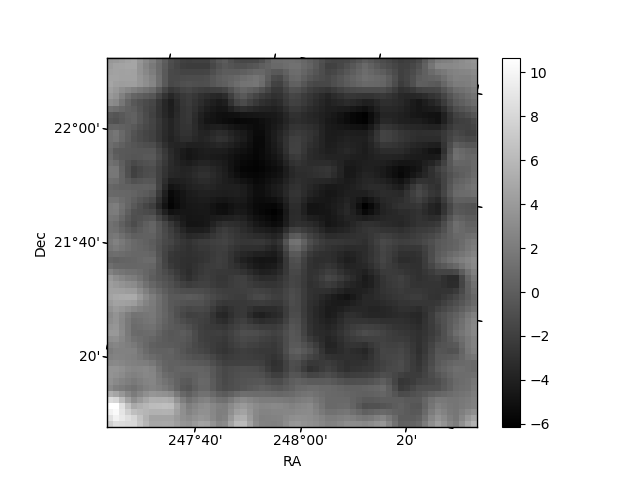
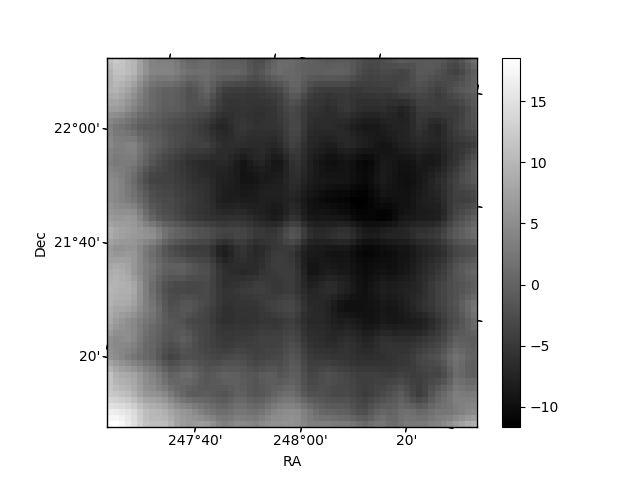
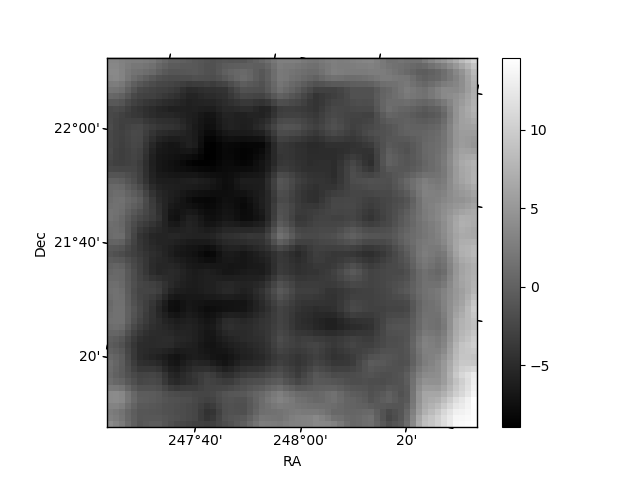
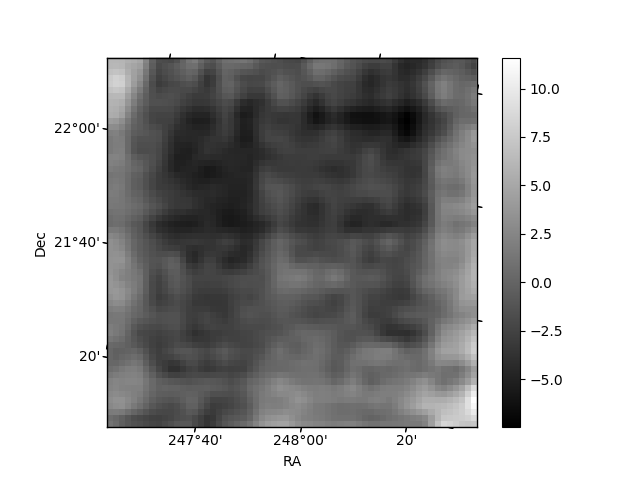
Histogram calculated using DETX and DETY for each event in the final _common_clean file
| Quadrant A | 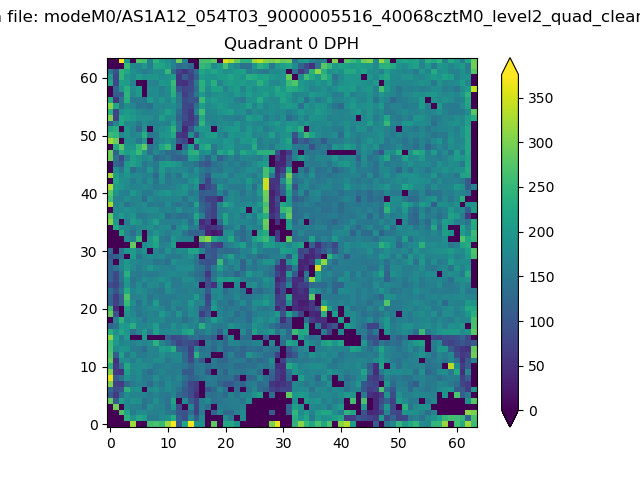 |
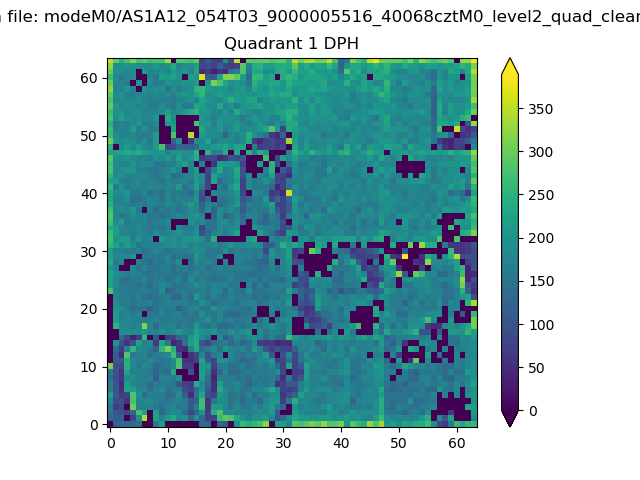 |
Quadrant B |
|---|---|---|---|
| Quadrant D | 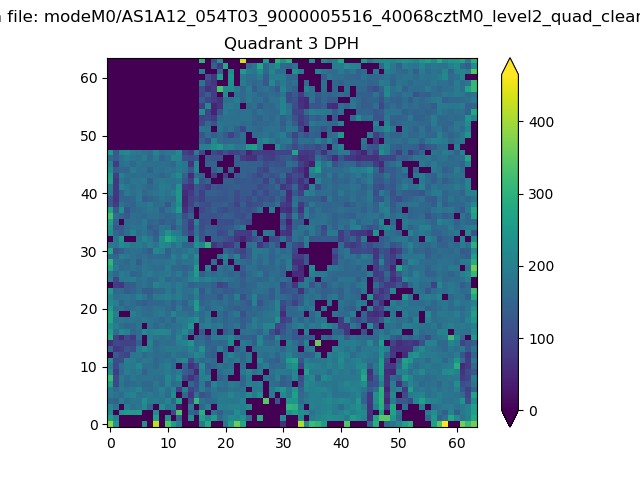 |
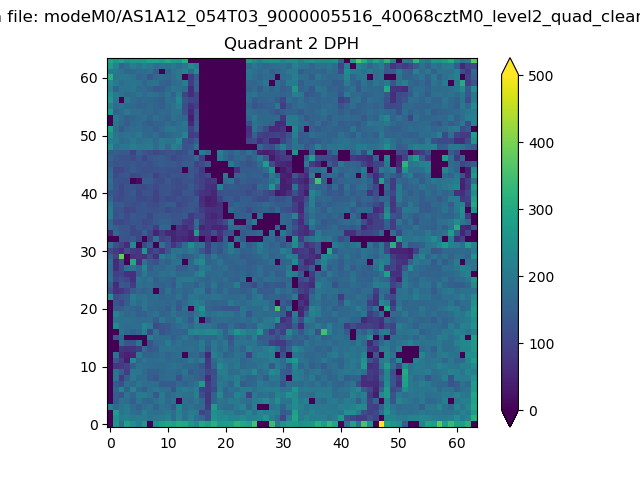 |
Quadrant C |
| Plot type | Count rate plots | Images |
|---|---|---|
| Comparison with Poisson distribution Blue bars denote a histogram of data divided into 1 sec bins. Red curve is a Poisson curve with rate = median count rate of data. |
 |
 |
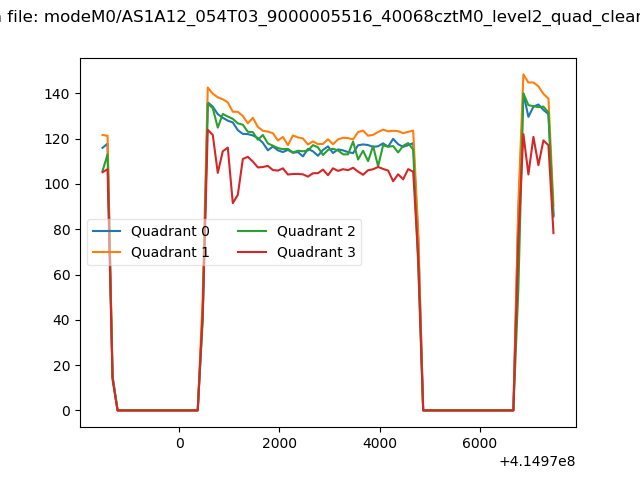
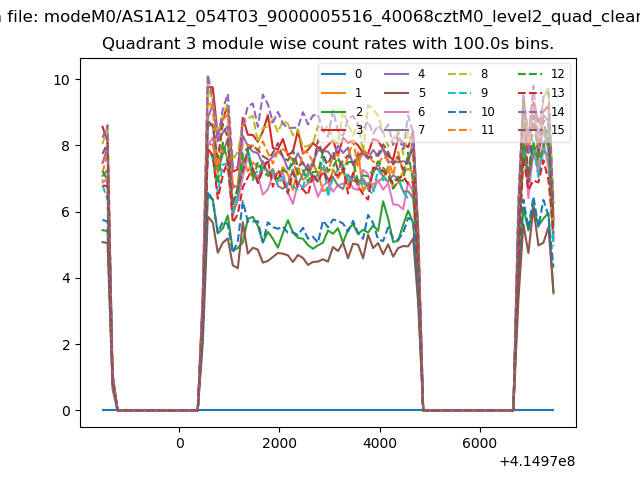
| Quadrant-wise count rates Data is divided into 100 sec bins |
 |
|
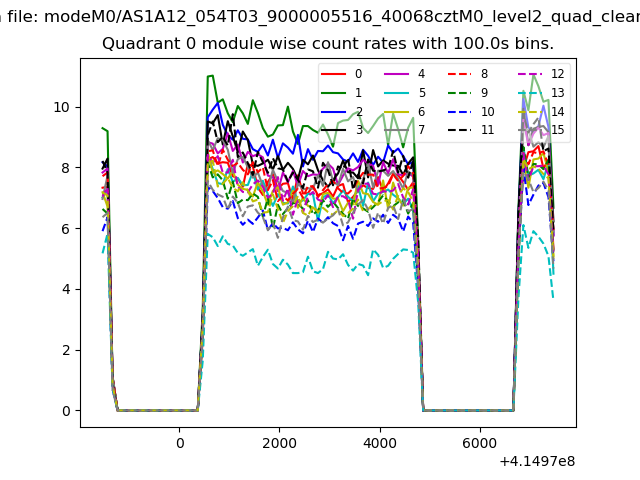
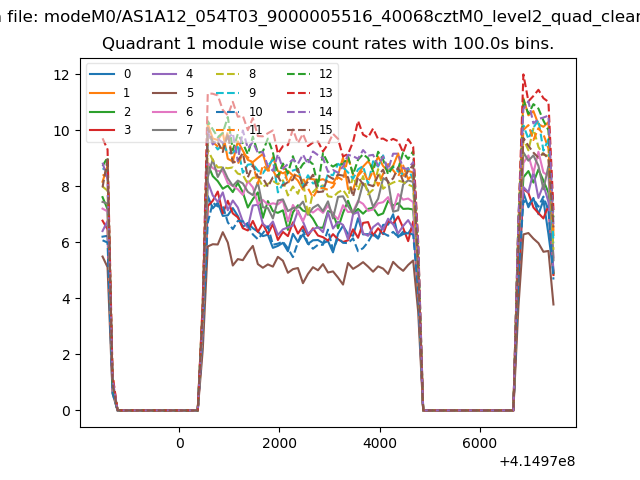
| Module-wise count rates for Quadrant A Data is divided into 100 sec bins |
 |
 |
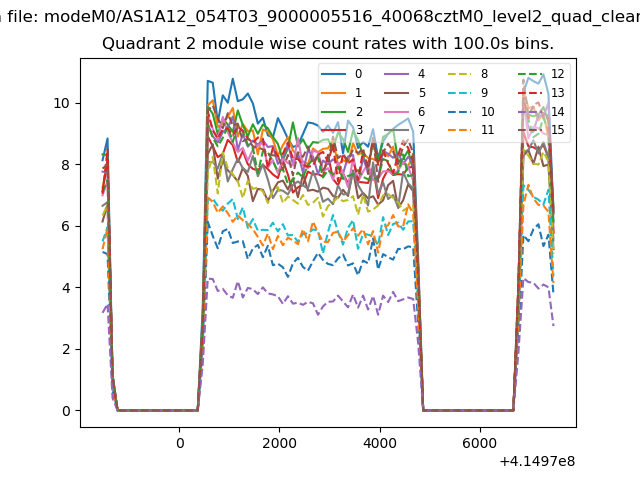
| Module-wise count rates for Quadrant B Data is divided into 100 sec bins |
 |
 |
| Module-wise count rates for Quadrant C Data is divided into 100 sec bins |
 |
 |
| Module-wise count rates for Quadrant D Data is divided into 100 sec bins |
 |
 |
| Parameter | Plot |
|---|---|
| CZT HV Monitor | 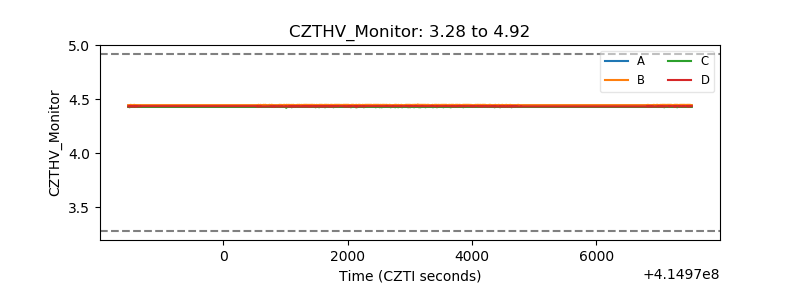 |
| D_VDD | 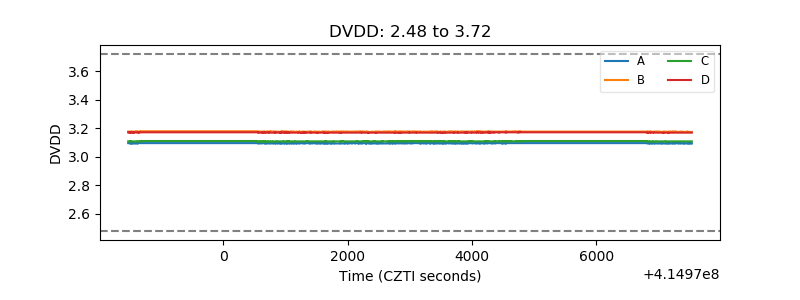 |
| Temperature 1 | 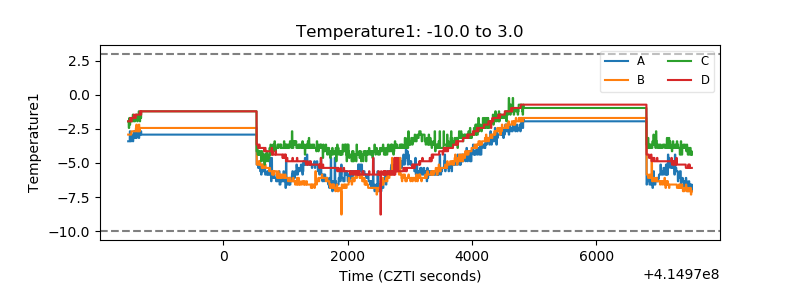 |
| Veto HV Monitor | 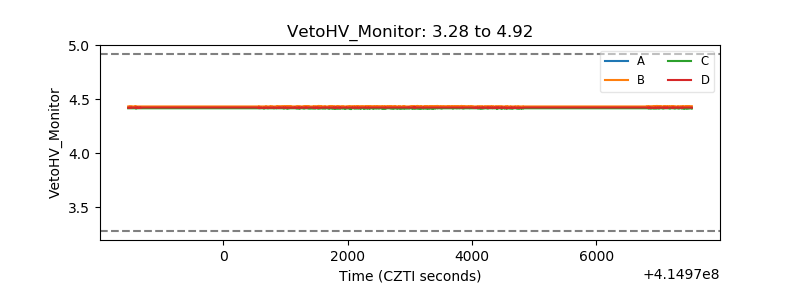 |
| Veto LLD | 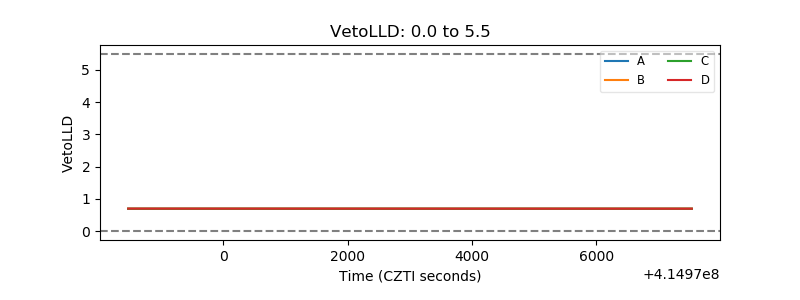 |
| Alpha Counter | 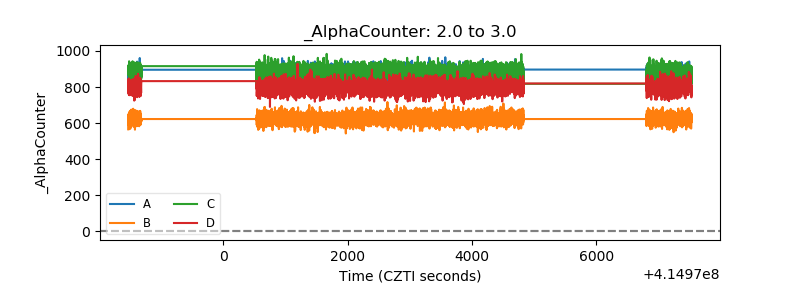 |
| _CPM_Rate | 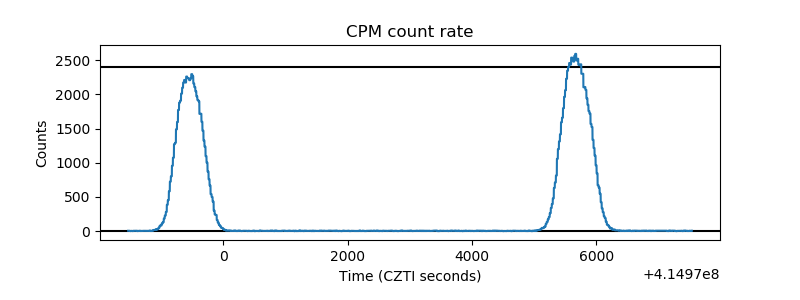 |
| CZT Counter | 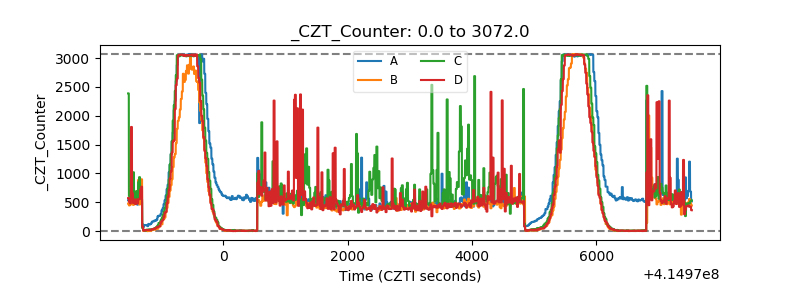 |
| +2.5 Volts monitor | 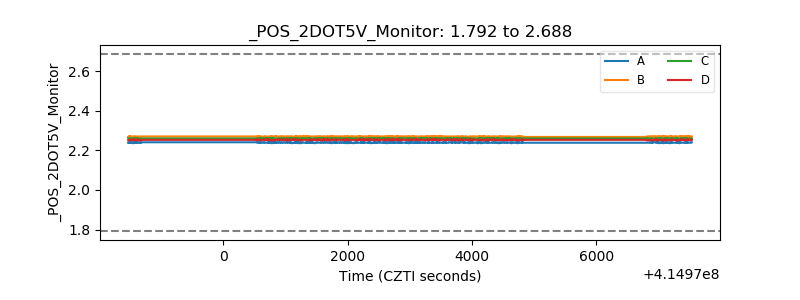 |
| +5 Volts monitor | 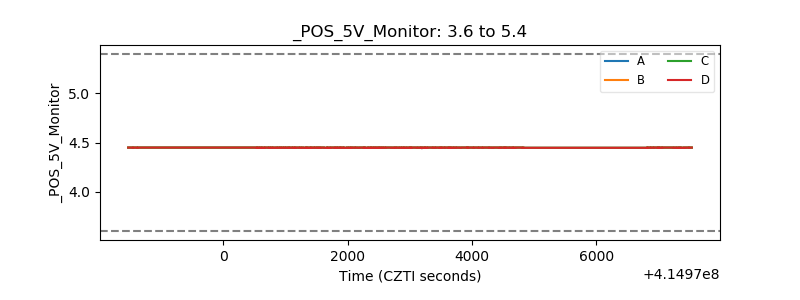 |
| _ROLL_ROT | 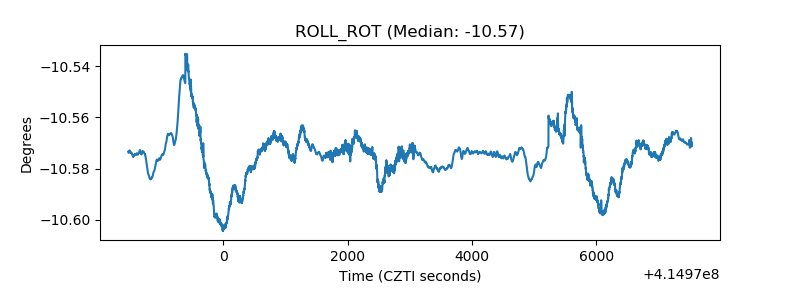 |
| _Roll_DEC | 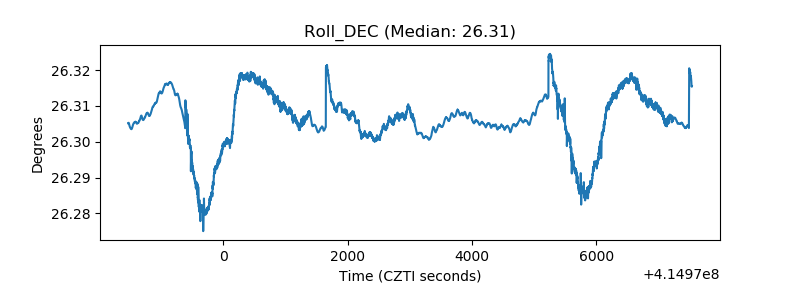 |
| _Roll_RA | 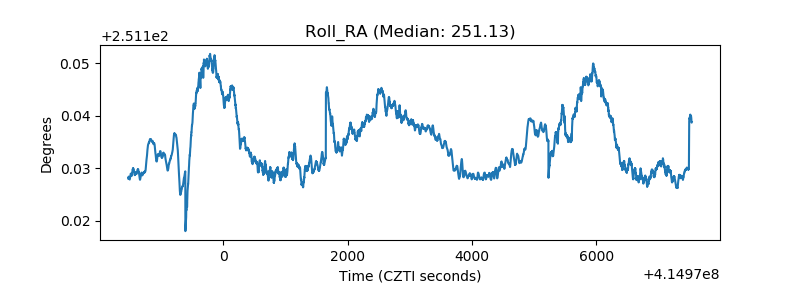 |
| Veto Counter | 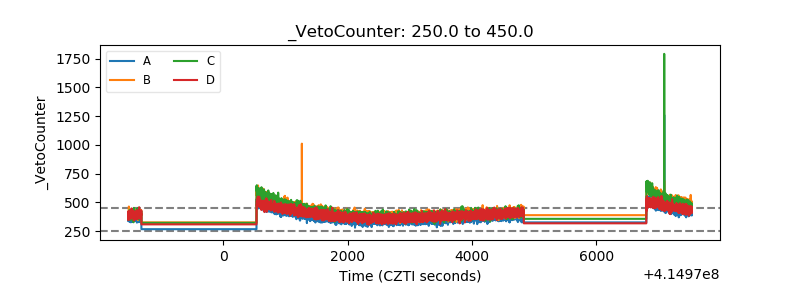 |