| Param | Original file | Final file |
|---|---|---|
| Filename | modeM0/AS1A12_054T03_9000005516_40069cztM0_level2.fits | modeM0/AS1A12_054T03_9000005516_40069cztM0_level2_quad_clean.evt |
| Size (bytes) | 302,843,520 | 90,636,480 |
| Size | 288.8 MB | 86.4 MB |
| Events in quadrant A | 2,706,970 | 607,617 |
| Events in quadrant B | 2,342,421 | 643,310 |
| Events in quadrant C | 3,069,250 | 598,583 |
| Events in quadrant D | 2,705,043 | 547,219 |
| Mode M9 | |||
|---|---|---|---|
| Quadrant | BADHDUFLAG | Total packets | Discarded packets |
| A | 0 | 34 | 0 |
| B | 0 | 34 | 0 |
| C | 0 | 34 | 0 |
| D | 0 | 35 | 0 |
| Mode SS | |||
|---|---|---|---|
| Quadrant | BADHDUFLAG | Total packets | Discarded packets |
| A | 0 | 102 | 0 |
| B | 0 | 102 | 0 |
| C | 0 | 102 | 0 |
| D | 0 | 102 | 0 |
| Mode M0 | |||
|---|---|---|---|
| Quadrant | BADHDUFLAG | Total packets | Discarded packets |
| A | 0 | 11127 | 3 |
| B | 0 | 10201 | 2 |
| C | 0 | 12273 | 2 |
| D | 0 | 11481 | 2 |
| Quadrant | Total seconds | Saturated seconds | Saturation percentage |
|---|---|---|---|
| A | 4959 | 23 | 0.463803% |
| B | 4959 | 20 | 0.403307% |
| C | 4959 | 103 | 2.077032% |
| D | 4959 | 61 | 1.230087% |
Noise dominated data is calculated using 1-second bins in cleaned event files. If a bin has >2000 counts, and if more than 50% of those come from <1% of pixels, then it is considered to be noise-dominated and hence unusable.
| Quadrant | # 1 sec bins | Bins with >0 counts | Bins with >2000 counts | High rate bins dominated by noise | Noise dominated (total time) | Noise dominated (detector-on time) | Marked lightcurve |
|---|---|---|---|---|---|---|---|
| A | 7021 | 4960 | 17 | 17 | 0.24% | 0.34% | 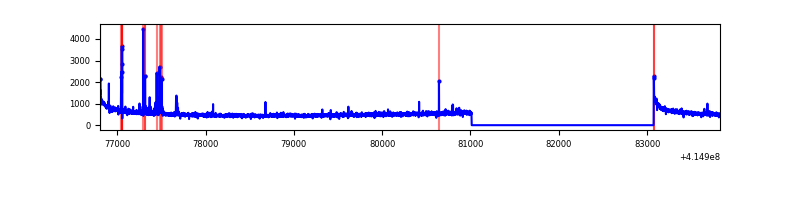 |
| B | 7021 | 4960 | 4 | 4 | 0.06% | 0.08% | 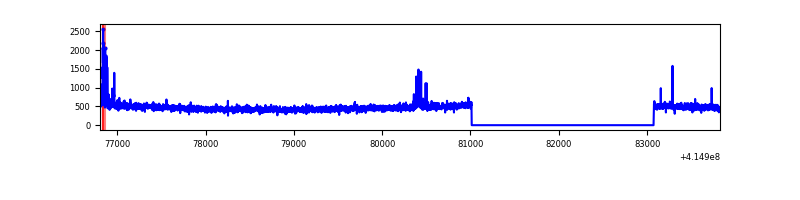 |
| C | 7021 | 4960 | 92 | 92 | 1.31% | 1.85% | 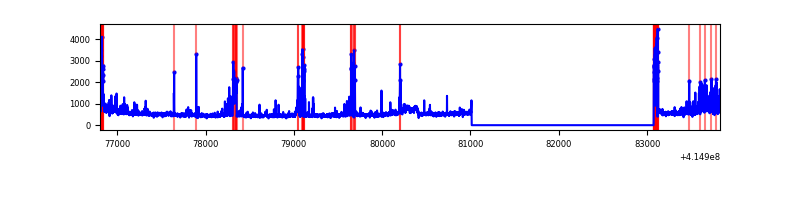 |
| D | 7021 | 4960 | 52 | 52 | 0.74% | 1.05% | 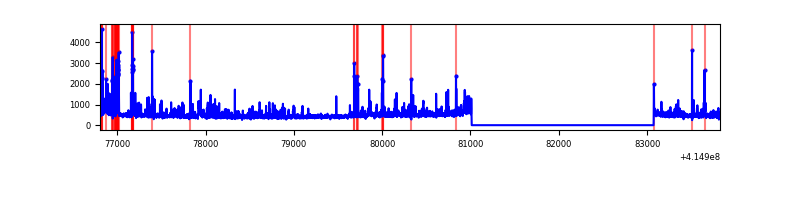 |
Top three noisy pixels from each quadrant. If the there are fewer than three noisy pixels in the level2.evt file, extra rows are filled as -1
| Pixel properties | Quadrant properties | ||||||
|---|---|---|---|---|---|---|---|
| Quadrant | DetID | PixID | Counts | Sigma | Mean | Median | Sigma |
| A | 10 | 83 | 421587 | 3671.25 | 564 | 554 | 114.7 |
| A | 13 | 248 | 51600 | 445.1 | 564 | 554 | 114.7 |
| A | 9 | 143 | 35523 | 304.92 | 564 | 554 | 114.7 |
| B | 4 | 171 | 67197 | 616.09 | 570 | 557 | 108.2 |
| B | 0 | 230 | 20799 | 187.14 | 570 | 557 | 108.2 |
| B | 0 | 190 | 13490 | 119.57 | 570 | 557 | 108.2 |
| C | 9 | 187 | 458552 | 3551.16 | 553 | 558 | 129.0 |
| C | 15 | 214 | 205560 | 1589.53 | 553 | 558 | 129.0 |
| C | 9 | 54 | 81566 | 628.11 | 553 | 558 | 129.0 |
| D | 12 | 227 | 209576 | 1548.64 | 546 | 532 | 135.0 |
| D | 2 | 249 | 207909 | 1536.29 | 546 | 532 | 135.0 |
| D | 13 | 249 | 91629 | 674.87 | 546 | 532 | 135.0 |
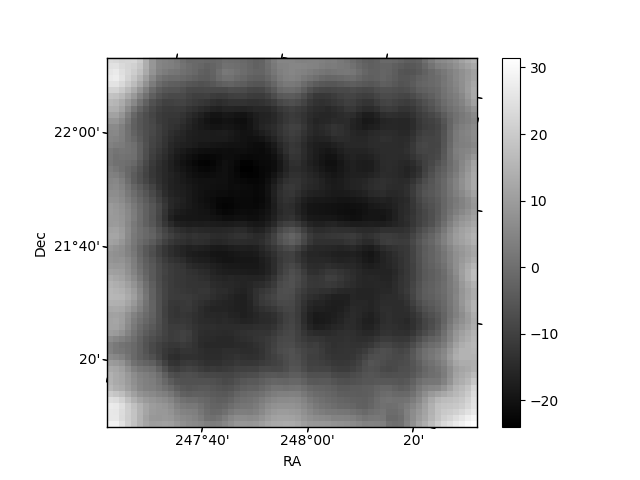
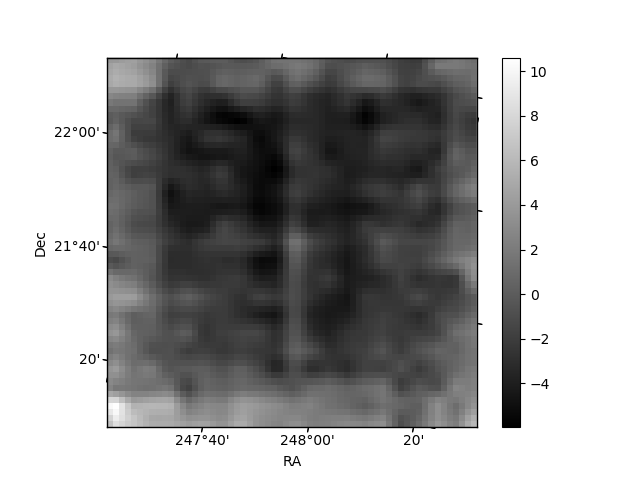
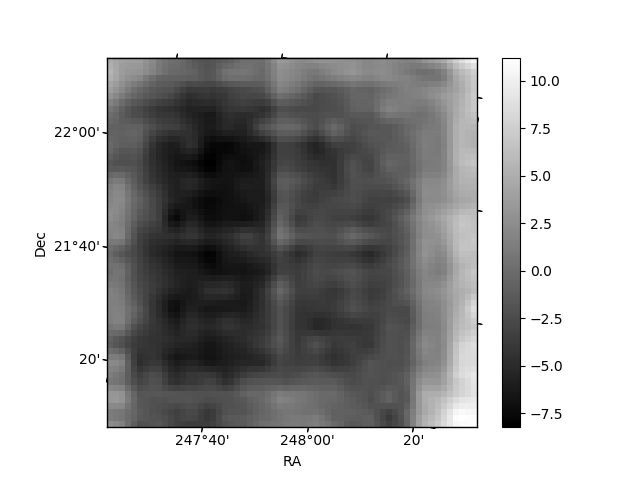
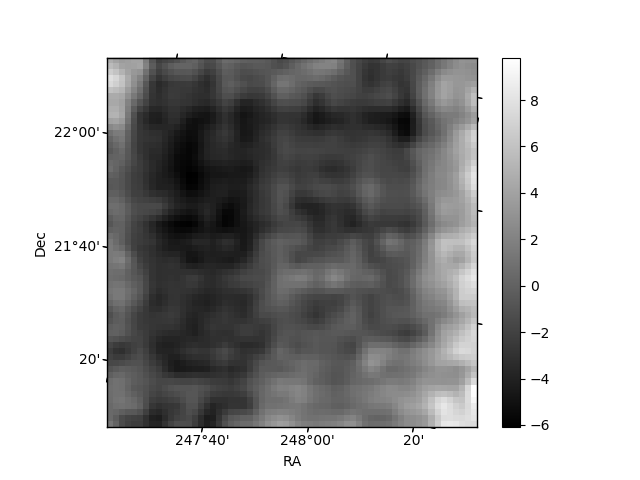
Histogram calculated using DETX and DETY for each event in the final _common_clean file
| Quadrant A | 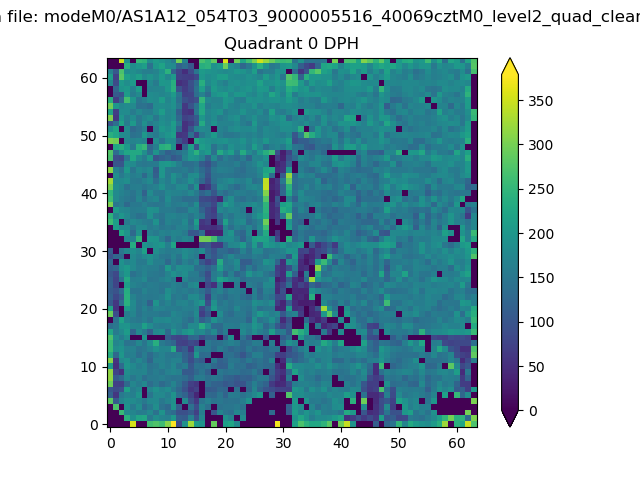 |
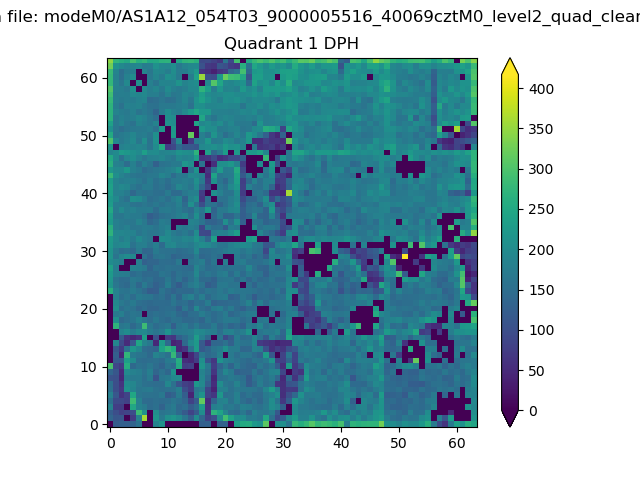 |
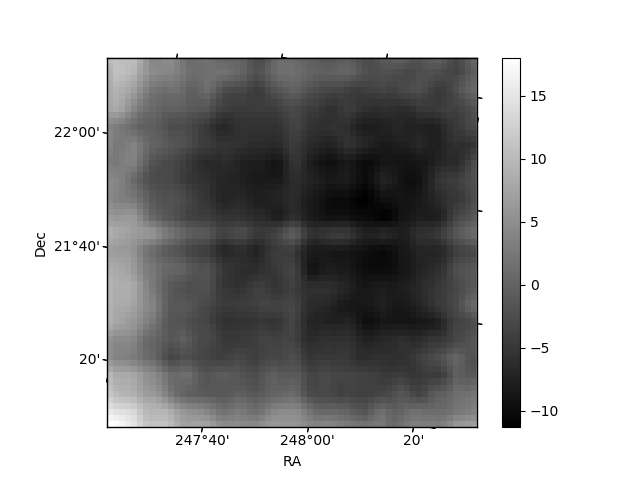
Quadrant B |
|---|---|---|---|
| Quadrant D | 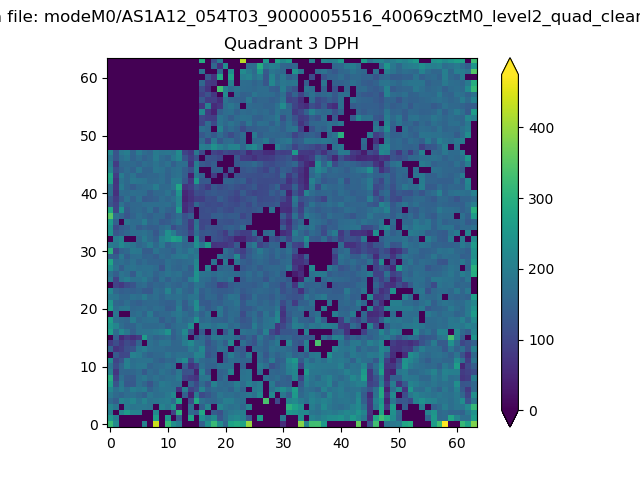 |
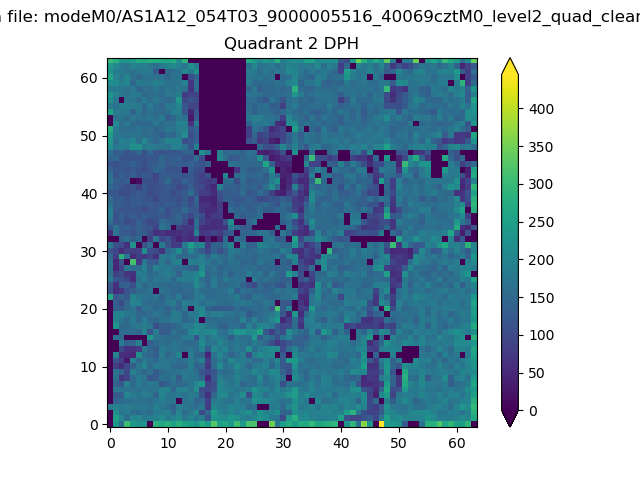 |
Quadrant C |
| Plot type | Count rate plots | Images |
|---|---|---|
| Comparison with Poisson distribution Blue bars denote a histogram of data divided into 1 sec bins. Red curve is a Poisson curve with rate = median count rate of data. |
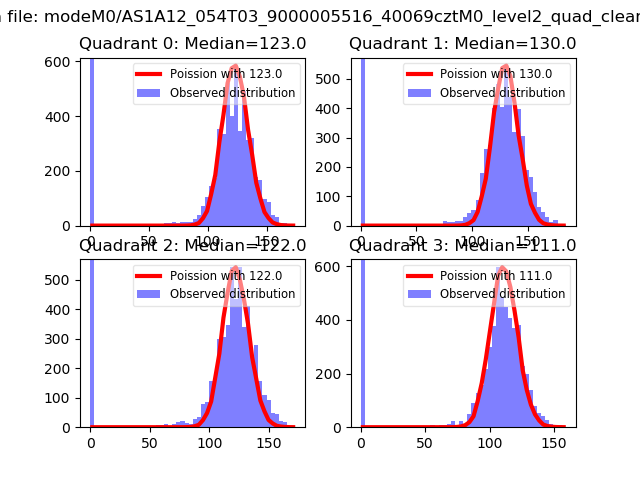 |
 |
| Quadrant-wise count rates Data is divided into 100 sec bins |
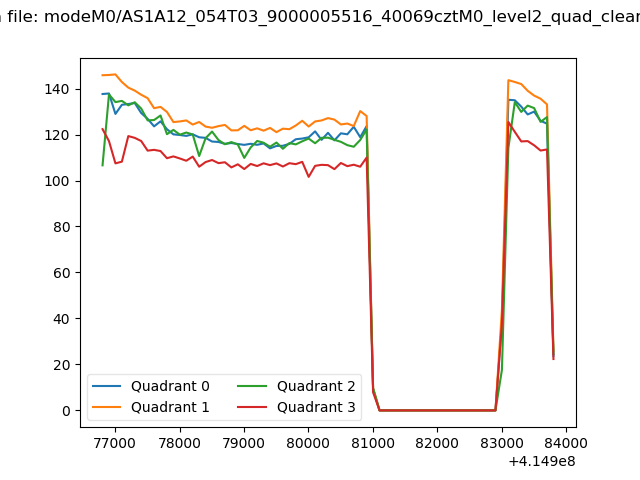 |
|
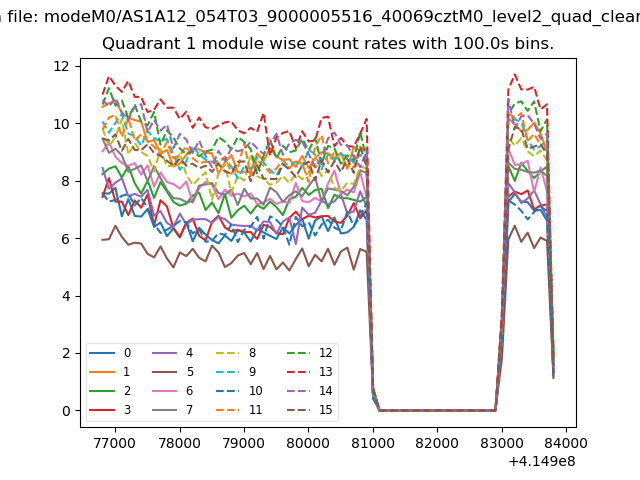
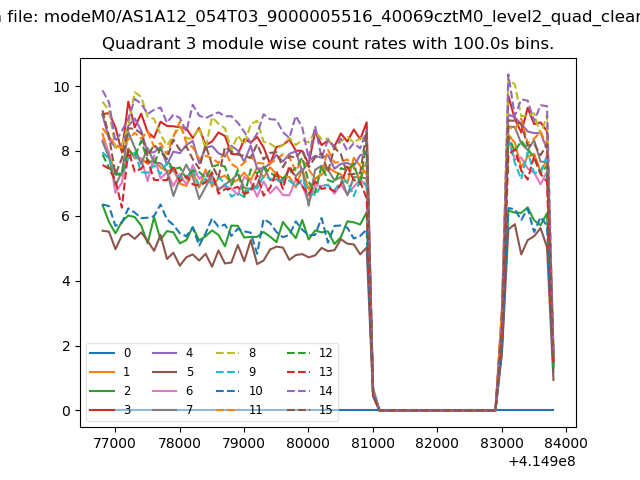
| Module-wise count rates for Quadrant A Data is divided into 100 sec bins |
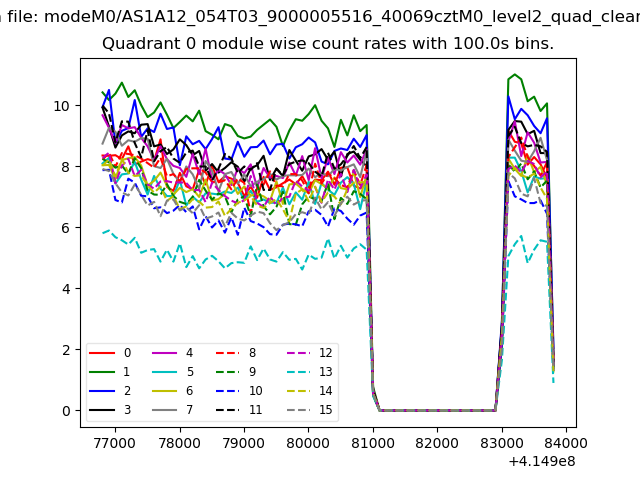 |
 |
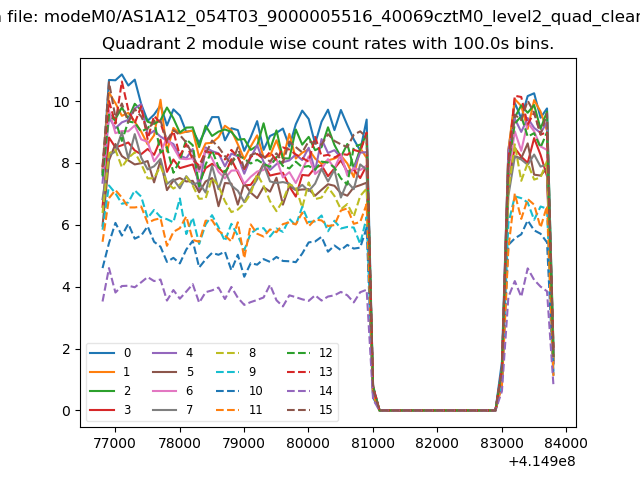
| Module-wise count rates for Quadrant B Data is divided into 100 sec bins |
 |
 |
| Module-wise count rates for Quadrant C Data is divided into 100 sec bins |
 |
 |
| Module-wise count rates for Quadrant D Data is divided into 100 sec bins |
 |
 |
| Parameter | Plot |
|---|---|
| CZT HV Monitor | 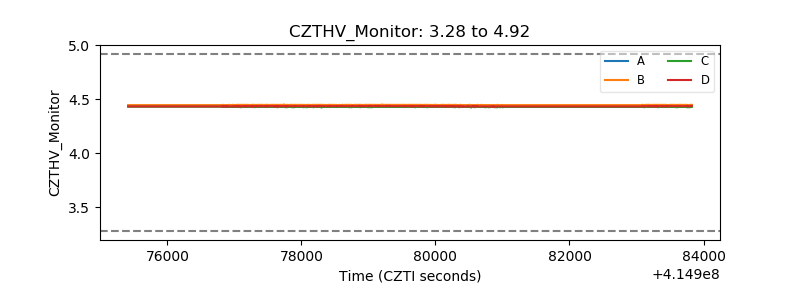 |
| D_VDD | 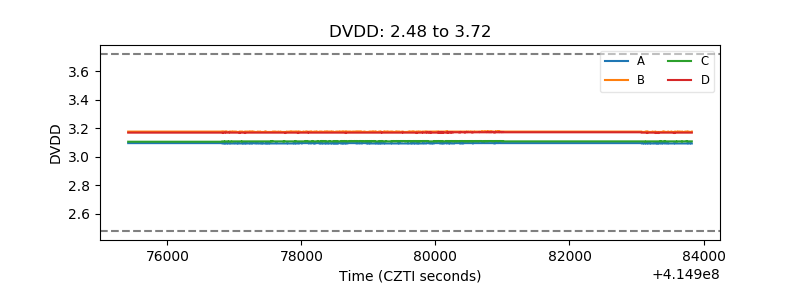 |
| Temperature 1 | 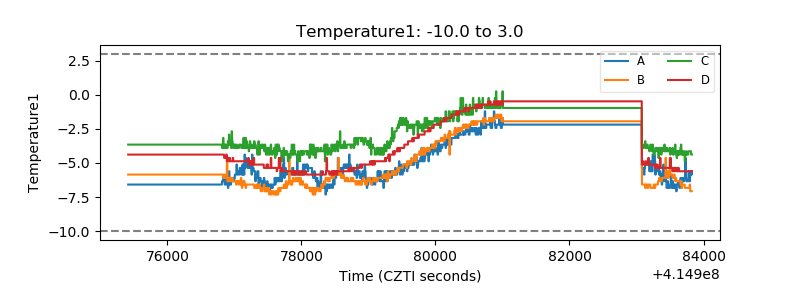 |
| Veto HV Monitor | 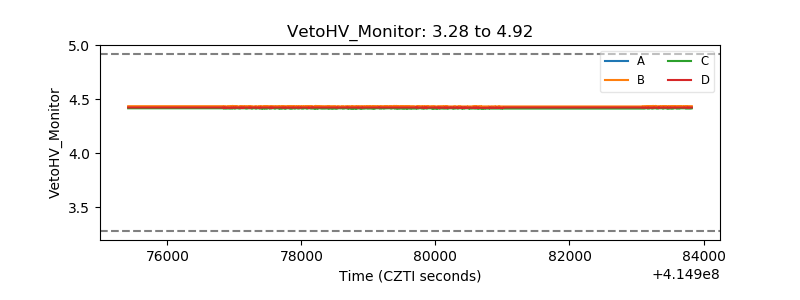 |
| Veto LLD | 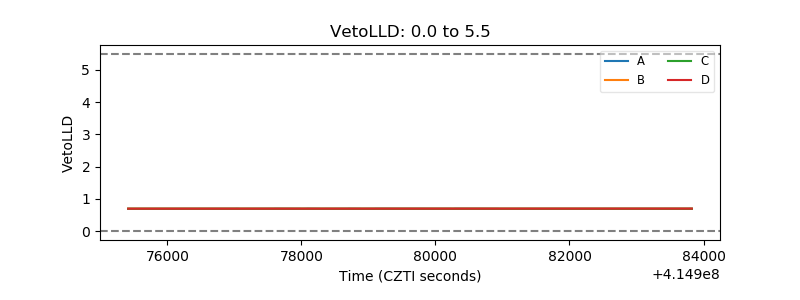 |
| Alpha Counter | 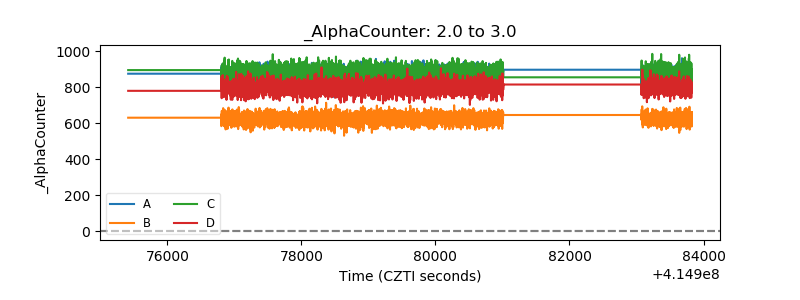 |
| _CPM_Rate | 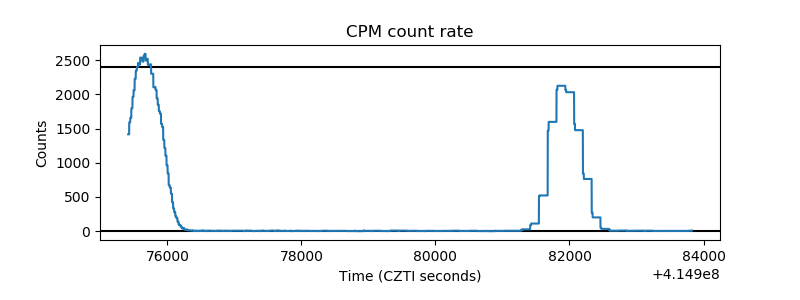 |
| CZT Counter | 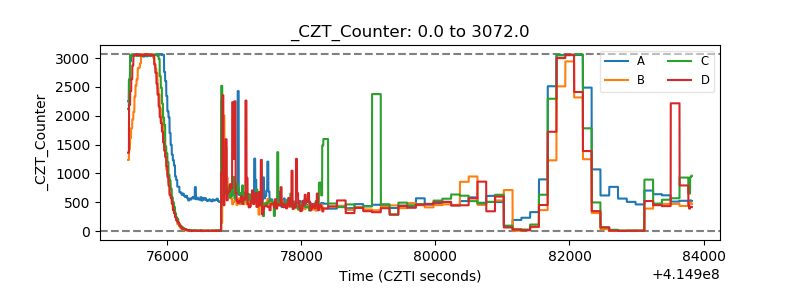 |
| +2.5 Volts monitor | 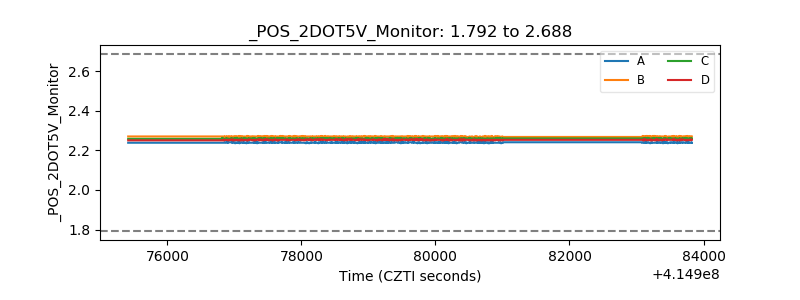 |
| +5 Volts monitor | 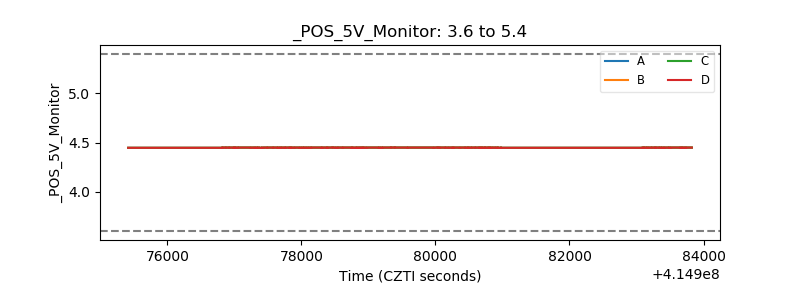 |
| _ROLL_ROT | 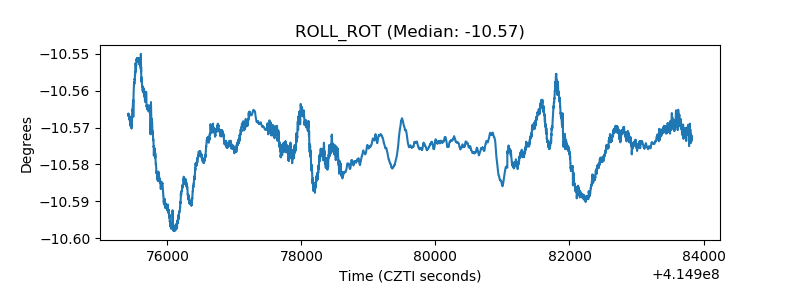 |
| _Roll_DEC | 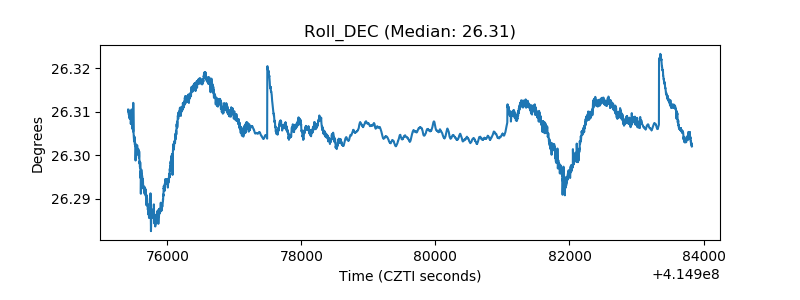 |
| _Roll_RA | 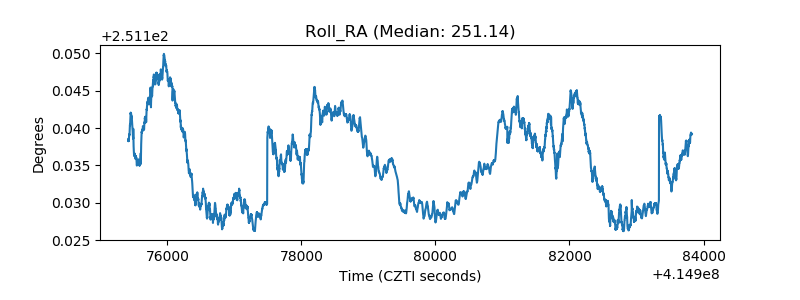 |
| Veto Counter | 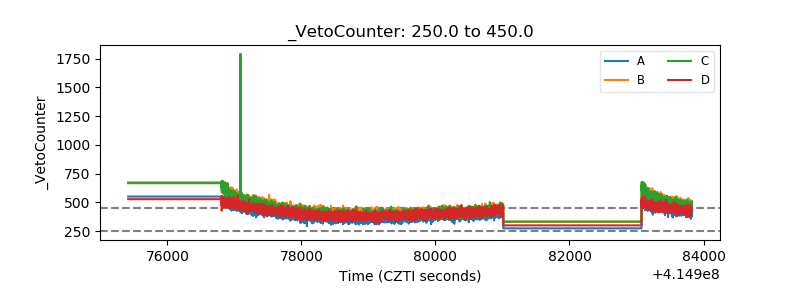 |