| Param | Original file | Final file |
|---|---|---|
| Filename | modeM0/AS1A12_054T03_9000005516_40070cztM0_level2.fits | modeM0/AS1A12_054T03_9000005516_40070cztM0_level2_quad_clean.evt |
| Size (bytes) | 350,671,680 | 93,009,600 |
| Size | 334.4 MB | 88.7 MB |
| Events in quadrant A | 2,786,938 | 629,862 |
| Events in quadrant B | 2,469,660 | 661,933 |
| Events in quadrant C | 4,720,232 | 589,134 |
| Events in quadrant D | 2,596,142 | 568,492 |
| Mode M9 | |||
|---|---|---|---|
| Quadrant | BADHDUFLAG | Total packets | Discarded packets |
| A | 0 | 36 | 0 |
| B | 0 | 36 | 0 |
| C | 0 | 36 | 0 |
| D | 0 | 37 | 0 |
| Mode SS | |||
|---|---|---|---|
| Quadrant | BADHDUFLAG | Total packets | Discarded packets |
| A | 0 | 108 | 0 |
| B | 0 | 108 | 0 |
| C | 0 | 108 | 0 |
| D | 0 | 108 | 0 |
| Mode M0 | |||
|---|---|---|---|
| Quadrant | BADHDUFLAG | Total packets | Discarded packets |
| A | 0 | 11481 | 3 |
| B | 0 | 10843 | 2 |
| C | 0 | 17548 | 2 |
| D | 0 | 11460 | 2 |
| Quadrant | Total seconds | Saturated seconds | Saturation percentage |
|---|---|---|---|
| A | 5236 | 13 | 0.248281% |
| B | 5236 | 32 | 0.611154% |
| C | 5236 | 445 | 8.498854% |
| D | 5236 | 22 | 0.420168% |
Noise dominated data is calculated using 1-second bins in cleaned event files. If a bin has >2000 counts, and if more than 50% of those come from <1% of pixels, then it is considered to be noise-dominated and hence unusable.
| Quadrant | # 1 sec bins | Bins with >0 counts | Bins with >2000 counts | High rate bins dominated by noise | Noise dominated (total time) | Noise dominated (detector-on time) | Marked lightcurve |
|---|---|---|---|---|---|---|---|
| A | 7358 | 5237 | 7 | 7 | 0.10% | 0.13% | 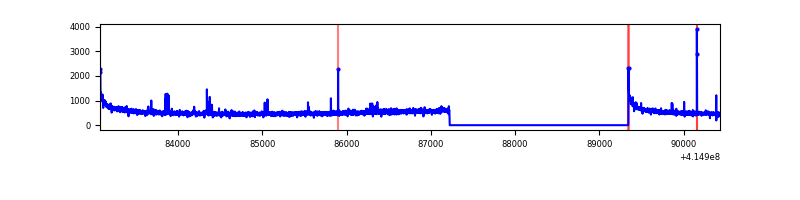 |
| B | 7358 | 5237 | 10 | 10 | 0.14% | 0.19% | 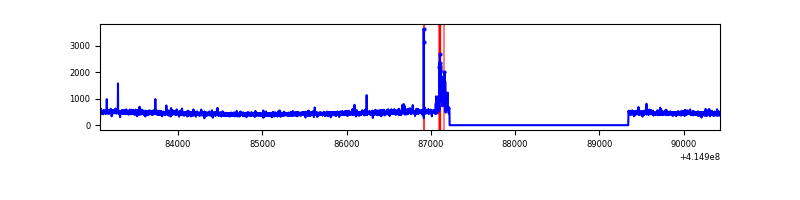 |
| C | 7358 | 5237 | 476 | 476 | 6.47% | 9.09% | 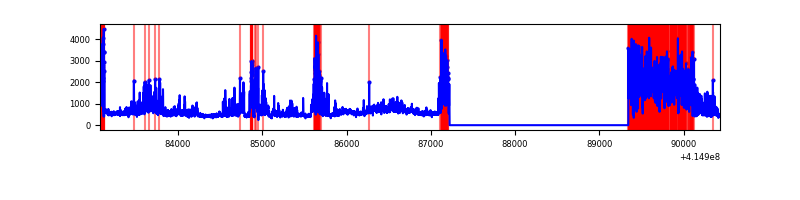 |
| D | 7358 | 5237 | 20 | 20 | 0.27% | 0.38% | 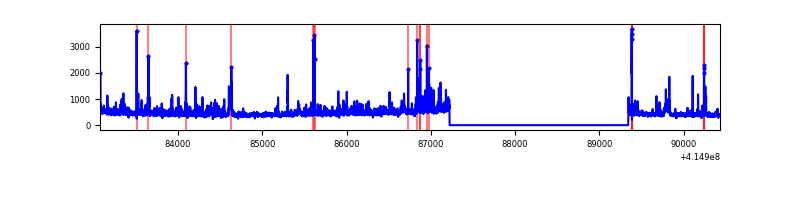 |
Top three noisy pixels from each quadrant. If the there are fewer than three noisy pixels in the level2.evt file, extra rows are filled as -1
| Pixel properties | Quadrant properties | ||||||
|---|---|---|---|---|---|---|---|
| Quadrant | DetID | PixID | Counts | Sigma | Mean | Median | Sigma |
| A | 10 | 83 | 452473 | 3792.52 | 587 | 576 | 119.2 |
| A | 6 | 10 | 36495 | 301.45 | 587 | 576 | 119.2 |
| A | 10 | 255 | 9128 | 71.77 | 587 | 576 | 119.2 |
| B | 5 | 32 | 71625 | 630.47 | 592 | 576 | 112.7 |
| B | 0 | 230 | 23351 | 202.1 | 592 | 576 | 112.7 |
| B | 0 | 190 | 17957 | 154.23 | 592 | 576 | 112.7 |
| C | 9 | 187 | 2052306 | 15700.78 | 563 | 568 | 130.7 |
| C | 15 | 214 | 214223 | 1634.98 | 563 | 568 | 130.7 |
| C | 3 | 233 | 178066 | 1358.29 | 563 | 568 | 130.7 |
| D | 12 | 227 | 221403 | 1586.33 | 568 | 553 | 139.2 |
| D | 9 | 19 | 54053 | 384.28 | 568 | 553 | 139.2 |
| D | 13 | 249 | 53465 | 380.06 | 568 | 553 | 139.2 |
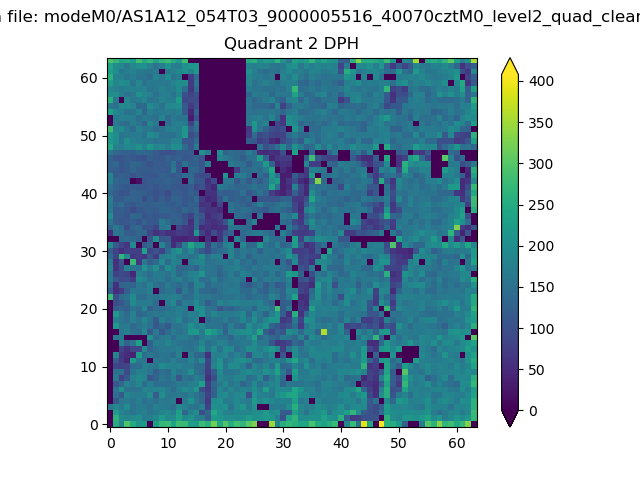
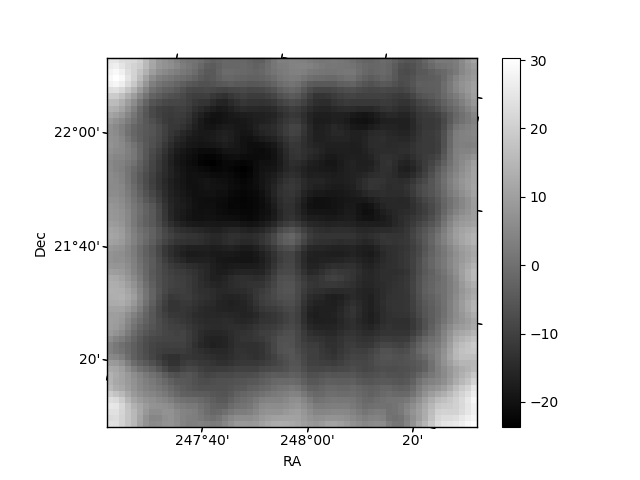
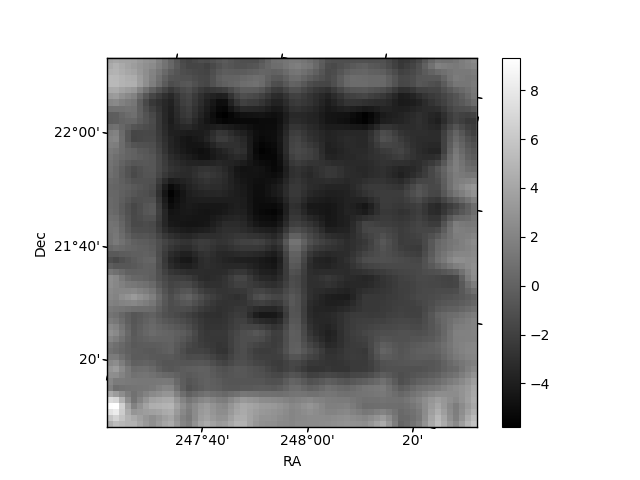
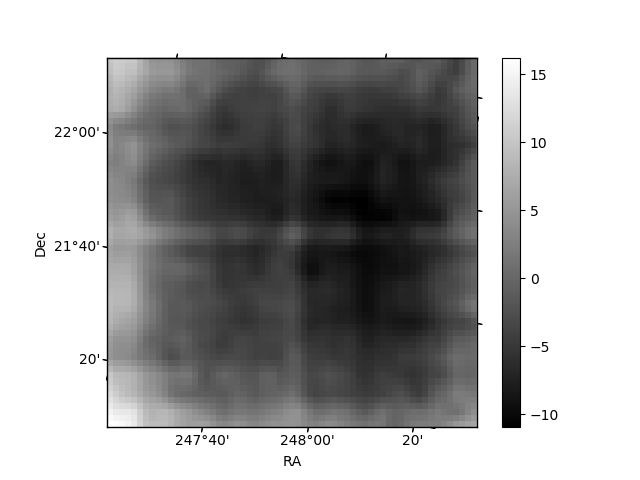
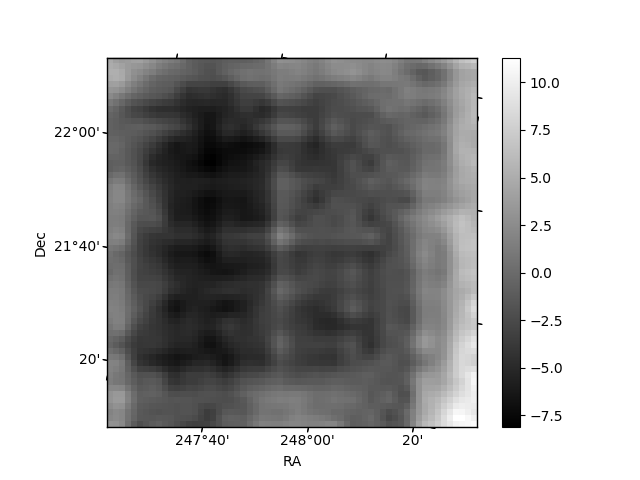
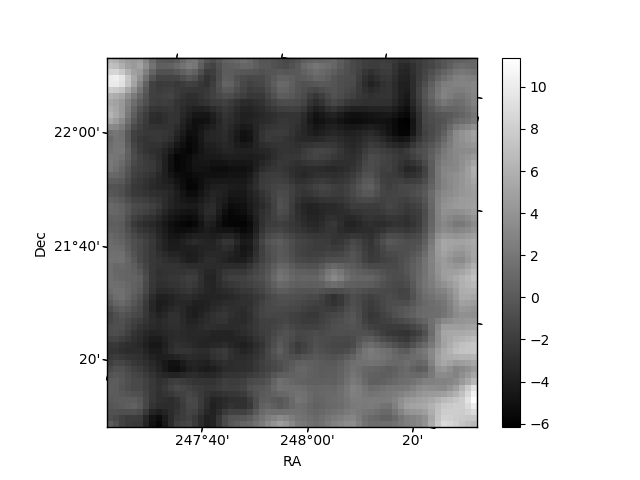
Histogram calculated using DETX and DETY for each event in the final _common_clean file
| Quadrant A | 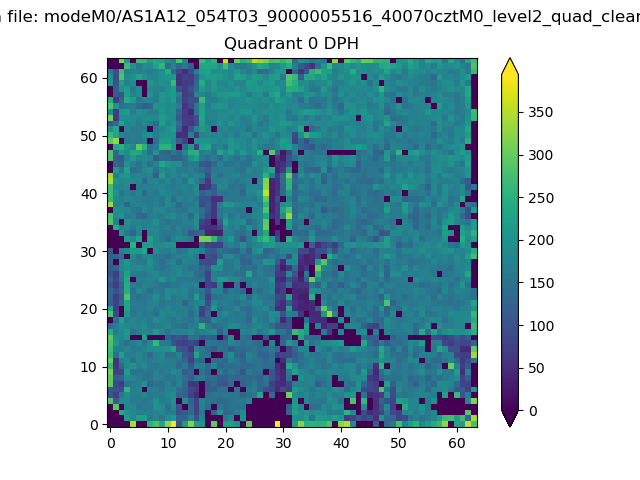 |
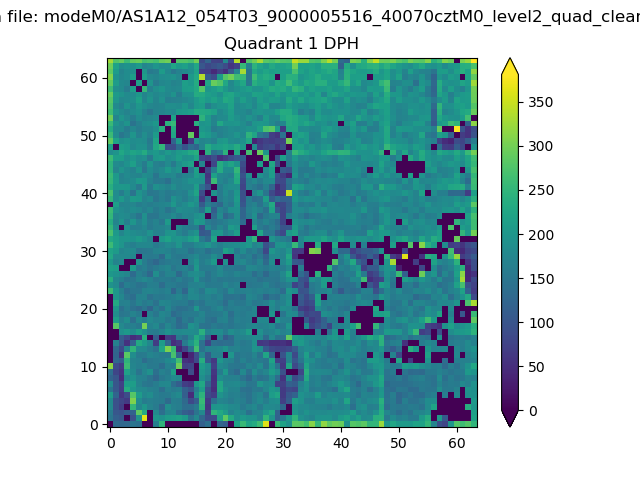 |
Quadrant B |
|---|---|---|---|
| Quadrant D | 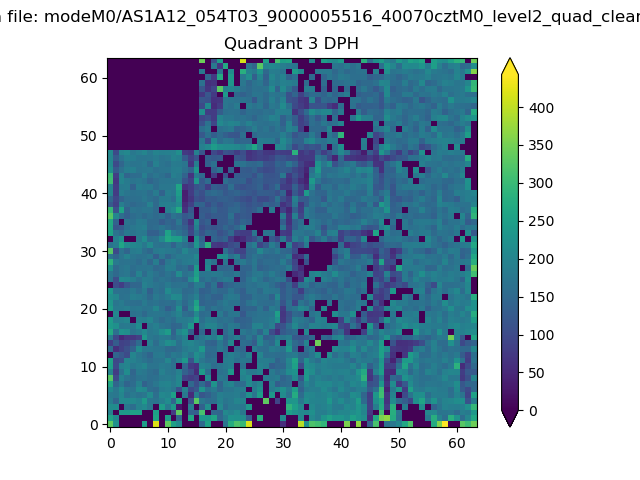 |
 |
Quadrant C |
| Plot type | Count rate plots | Images |
|---|---|---|
| Comparison with Poisson distribution Blue bars denote a histogram of data divided into 1 sec bins. Red curve is a Poisson curve with rate = median count rate of data. |
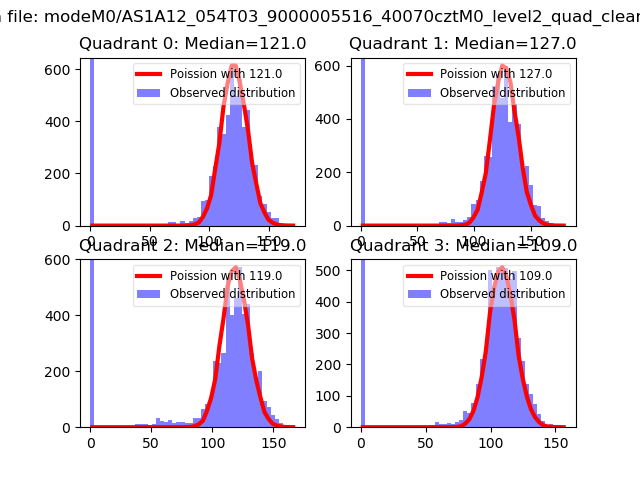 |
 |
| Quadrant-wise count rates Data is divided into 100 sec bins |
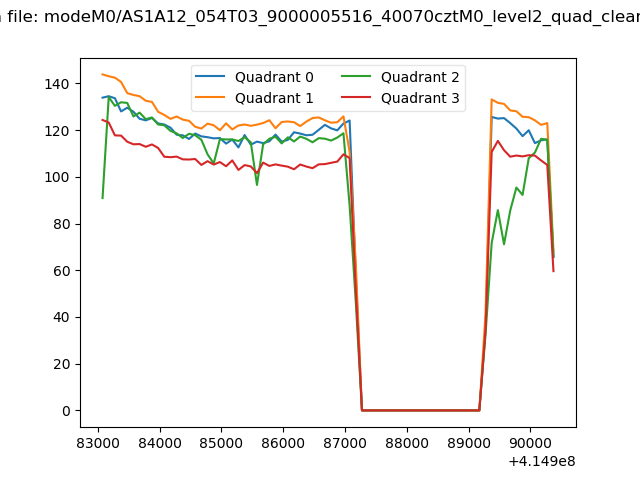 |
|
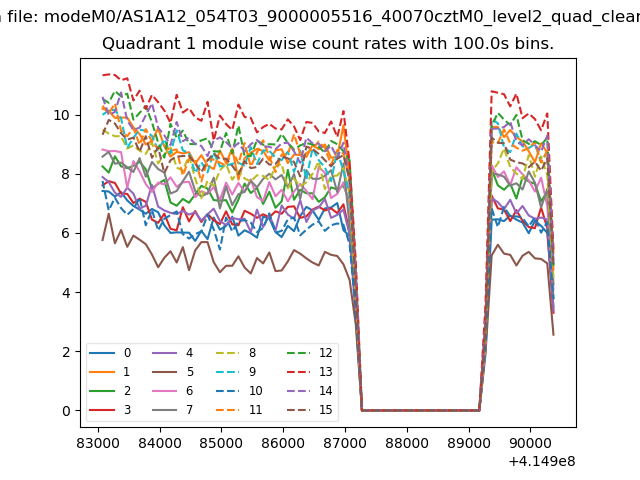
| Module-wise count rates for Quadrant A Data is divided into 100 sec bins |
 |
 |
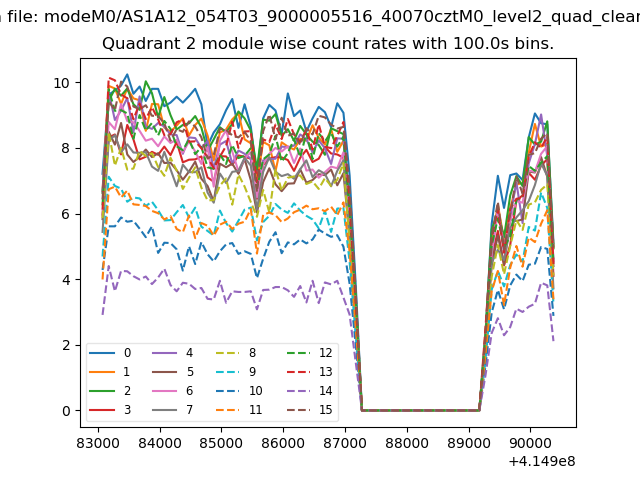
| Module-wise count rates for Quadrant B Data is divided into 100 sec bins |
 |
 |
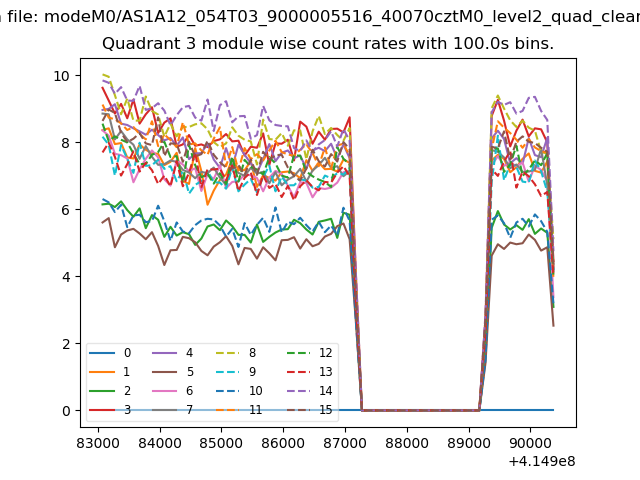
| Module-wise count rates for Quadrant C Data is divided into 100 sec bins |
 |
 |
| Module-wise count rates for Quadrant D Data is divided into 100 sec bins |
 |
 |
| Parameter | Plot |
|---|---|
| CZT HV Monitor | 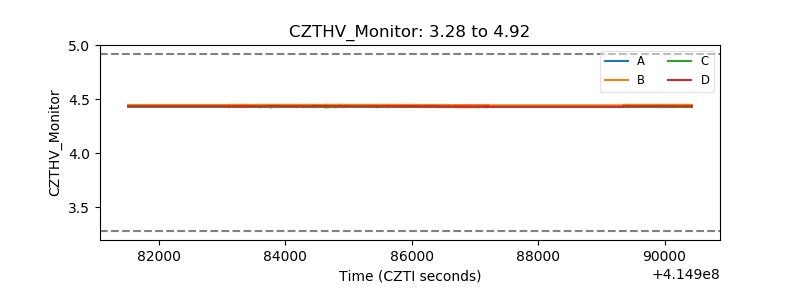 |
| D_VDD | 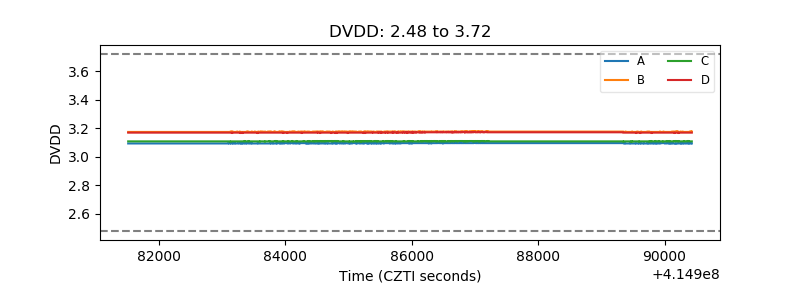 |
| Temperature 1 | 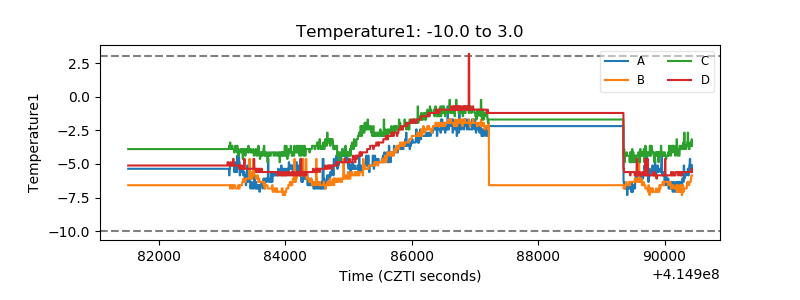 |
| Veto HV Monitor | 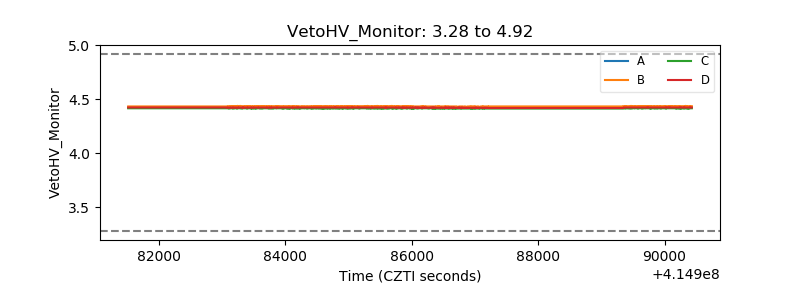 |
| Veto LLD | 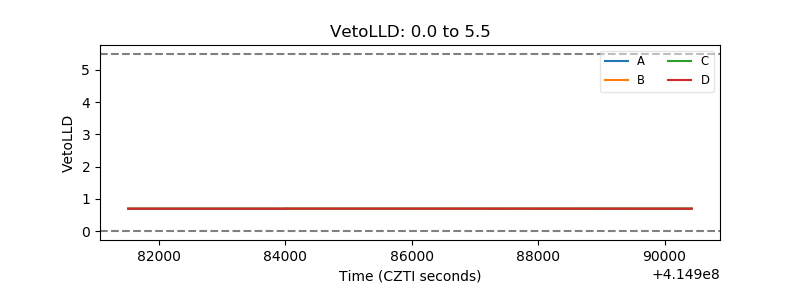 |
| Alpha Counter |  |
| _CPM_Rate | 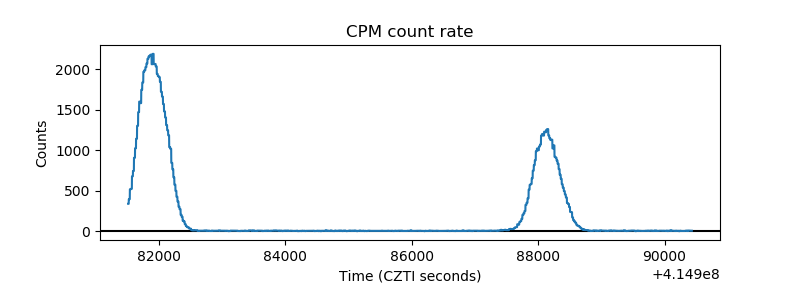 |
| CZT Counter | 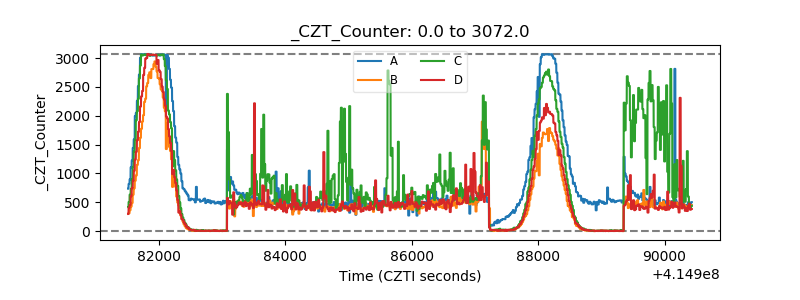 |
| +2.5 Volts monitor | 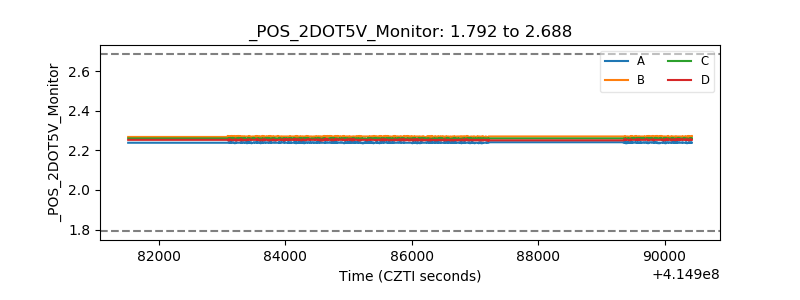 |
| +5 Volts monitor | 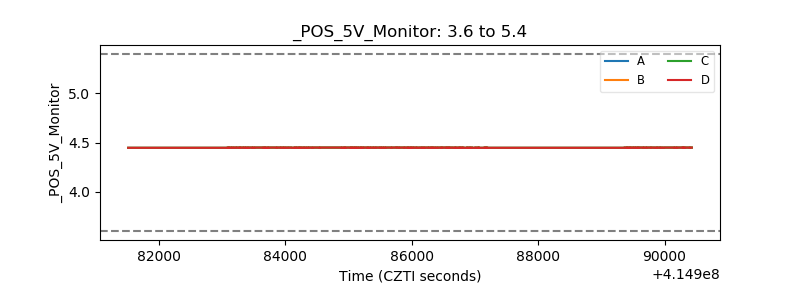 |
| _ROLL_ROT | 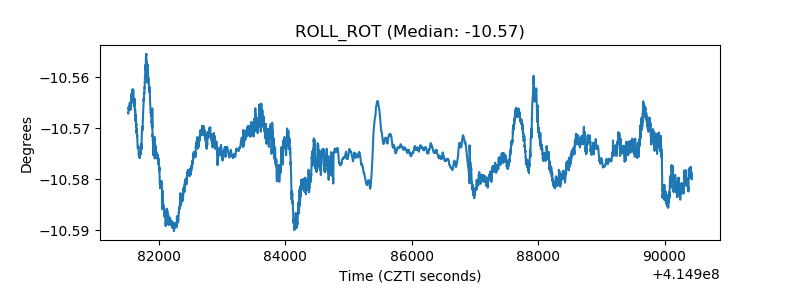 |
| _Roll_DEC | 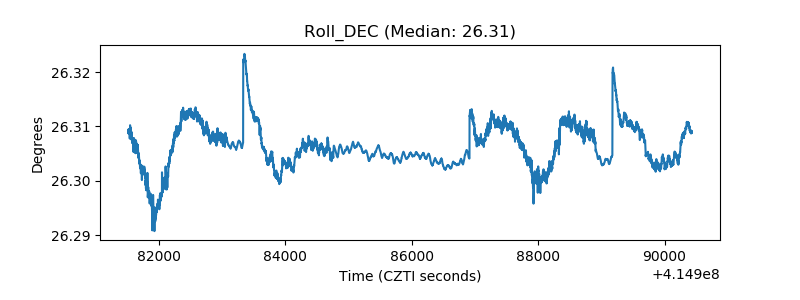 |
| _Roll_RA | 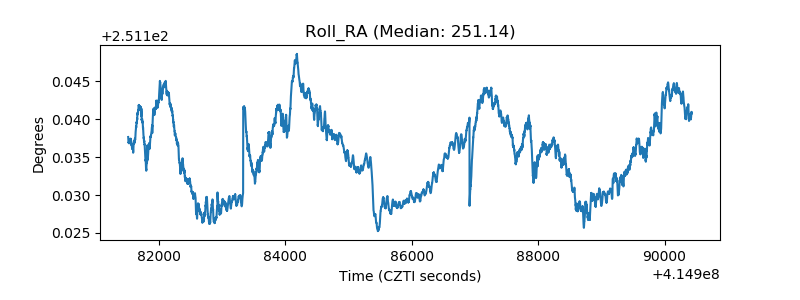 |
| Veto Counter |  |