| Param | Original file | Final file |
|---|---|---|
| Filename | modeM0/AS1A12_054T03_9000005516_40071cztM0_level2.fits | modeM0/AS1A12_054T03_9000005516_40071cztM0_level2_quad_clean.evt |
| Size (bytes) | 374,088,960 | 89,856,000 |
| Size | 356.8 MB | 85.7 MB |
| Events in quadrant A | 3,549,743 | 596,134 |
| Events in quadrant B | 2,439,141 | 636,756 |
| Events in quadrant C | 4,556,785 | 572,267 |
| Events in quadrant D | 2,890,899 | 546,161 |
| Mode M9 | |||
|---|---|---|---|
| Quadrant | BADHDUFLAG | Total packets | Discarded packets |
| A | 0 | 26 | 0 |
| B | 0 | 26 | 0 |
| C | 0 | 26 | 0 |
| D | 0 | 27 | 0 |
| Mode SS | |||
|---|---|---|---|
| Quadrant | BADHDUFLAG | Total packets | Discarded packets |
| A | 0 | 106 | 0 |
| B | 0 | 106 | 0 |
| C | 0 | 106 | 0 |
| D | 0 | 106 | 0 |
| Mode M0 | |||
|---|---|---|---|
| Quadrant | BADHDUFLAG | Total packets | Discarded packets |
| A | 0 | 13824 | 2 |
| B | 0 | 10871 | 1 |
| C | 0 | 17138 | 1 |
| D | 0 | 12520 | 1 |
| Quadrant | Total seconds | Saturated seconds | Saturation percentage |
|---|---|---|---|
| A | 5282 | 192 | 3.634987% |
| B | 5282 | 30 | 0.567967% |
| C | 5282 | 378 | 7.156380% |
| D | 5282 | 108 | 2.044680% |
Noise dominated data is calculated using 1-second bins in cleaned event files. If a bin has >2000 counts, and if more than 50% of those come from <1% of pixels, then it is considered to be noise-dominated and hence unusable.
| Quadrant | # 1 sec bins | Bins with >0 counts | Bins with >2000 counts | High rate bins dominated by noise | Noise dominated (total time) | Noise dominated (detector-on time) | Marked lightcurve |
|---|---|---|---|---|---|---|---|
| A | 7405 | 5283 | 193 | 193 | 2.61% | 3.65% | 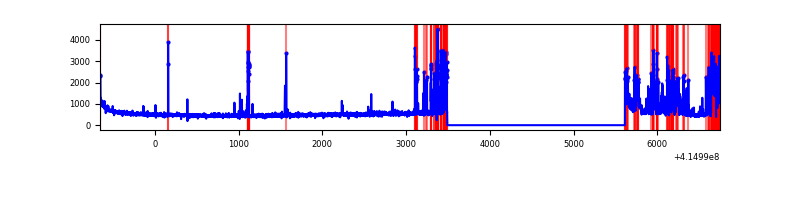 |
| B | 7405 | 5283 | 22 | 22 | 0.30% | 0.42% | 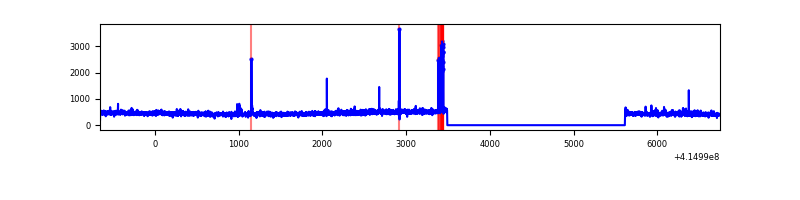 |
| C | 7405 | 5283 | 429 | 429 | 5.79% | 8.12% | 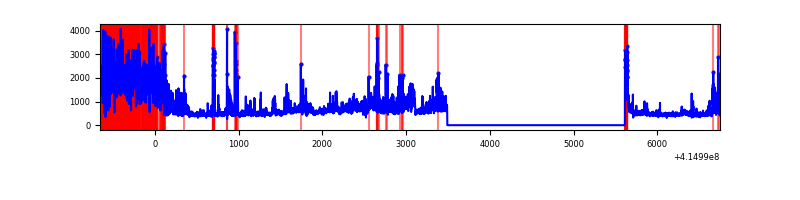 |
| D | 7405 | 5283 | 79 | 79 | 1.07% | 1.50% | 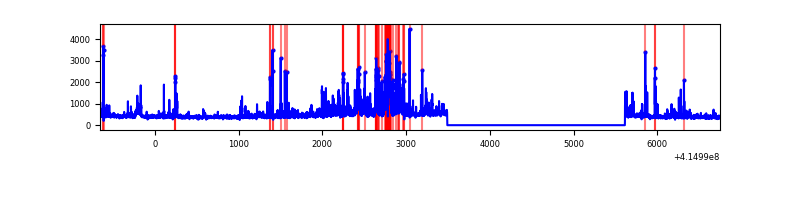 |
Top three noisy pixels from each quadrant. If the there are fewer than three noisy pixels in the level2.evt file, extra rows are filled as -1
| Pixel properties | Quadrant properties | ||||||
|---|---|---|---|---|---|---|---|
| Quadrant | DetID | PixID | Counts | Sigma | Mean | Median | Sigma |
| A | 2 | 79 | 871922 | 7526.09 | 571 | 560 | 115.8 |
| A | 10 | 83 | 448391 | 3867.99 | 571 | 560 | 115.8 |
| A | 6 | 10 | 8940 | 72.38 | 571 | 560 | 115.8 |
| B | 5 | 32 | 62251 | 557.49 | 579 | 564 | 110.7 |
| B | 0 | 230 | 28607 | 253.43 | 579 | 564 | 110.7 |
| B | 4 | 171 | 28036 | 248.27 | 579 | 564 | 110.7 |
| C | 9 | 187 | 1980862 | 15320.63 | 555 | 560 | 129.3 |
| C | 15 | 214 | 217085 | 1675.15 | 555 | 560 | 129.3 |
| C | 0 | 10 | 88949 | 683.82 | 555 | 560 | 129.3 |
| D | 2 | 249 | 265598 | 1955.91 | 556 | 542 | 135.5 |
| D | 12 | 227 | 137269 | 1008.94 | 556 | 542 | 135.5 |
| D | 2 | 250 | 128048 | 940.9 | 556 | 542 | 135.5 |
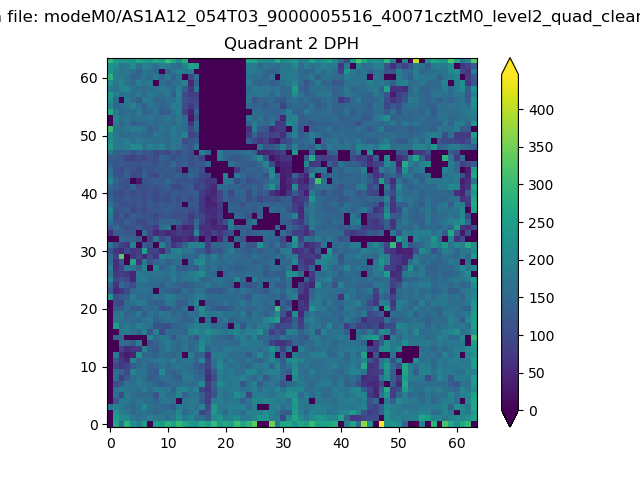
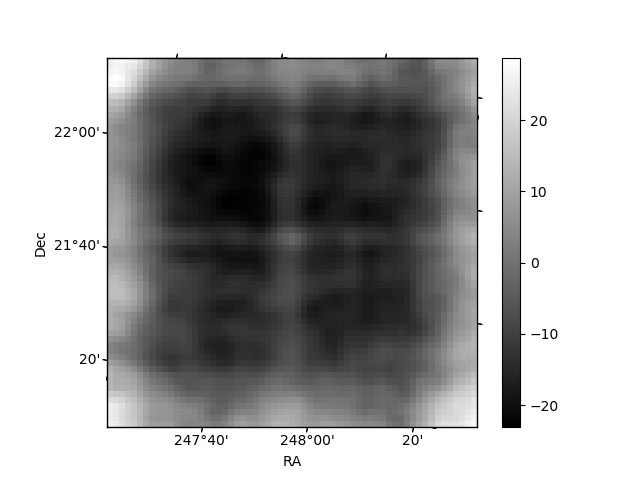
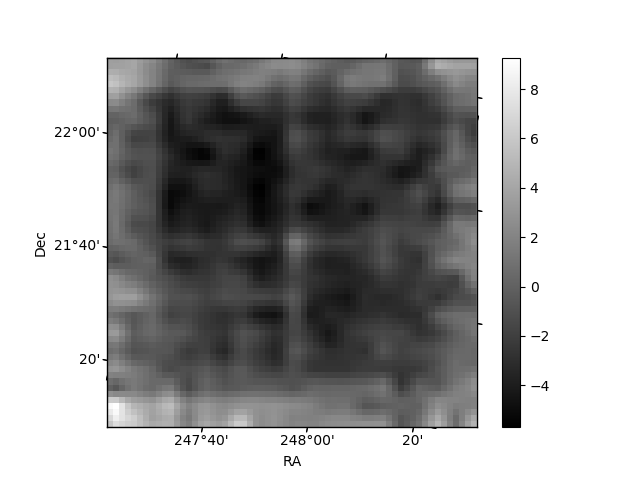
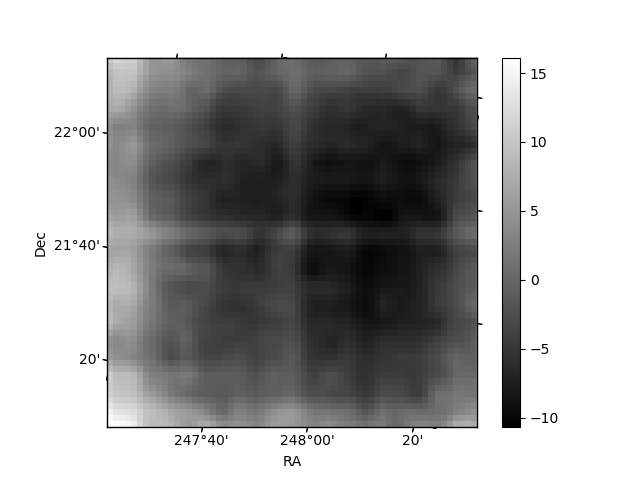
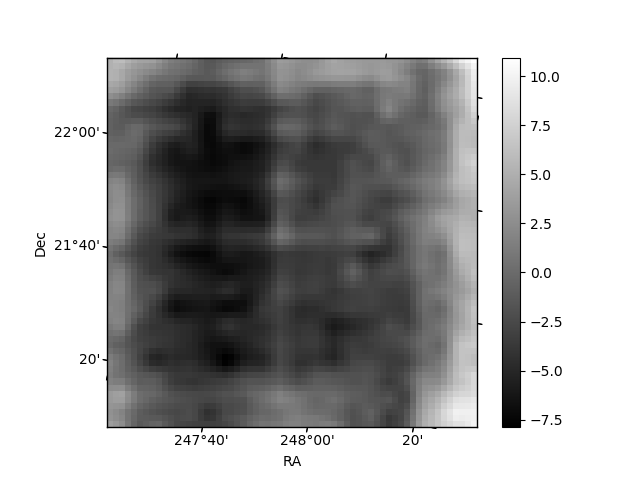
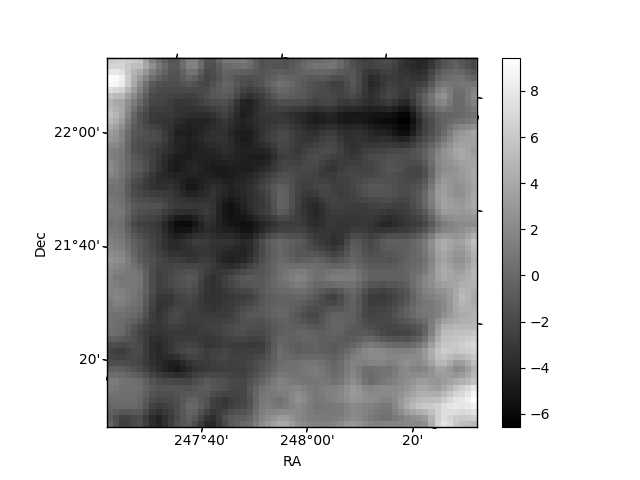
Histogram calculated using DETX and DETY for each event in the final _common_clean file
| Quadrant A | 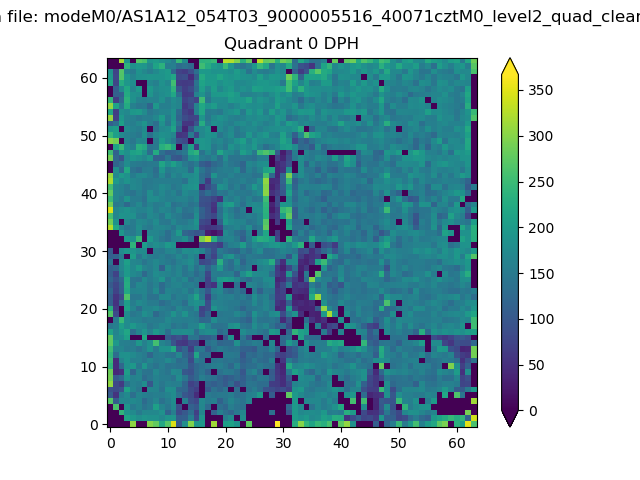 |
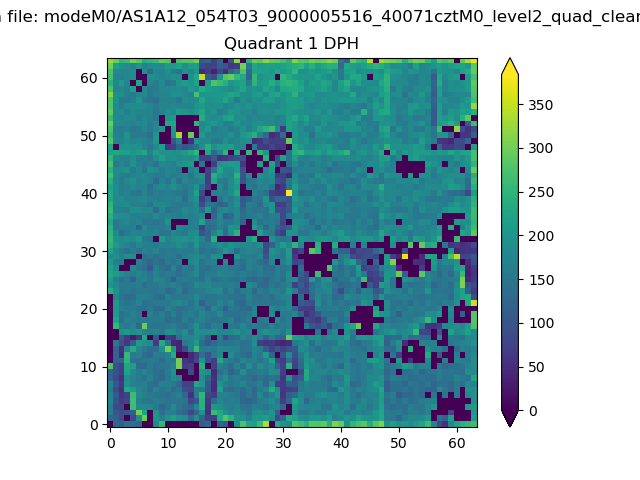 |
Quadrant B |
|---|---|---|---|
| Quadrant D | 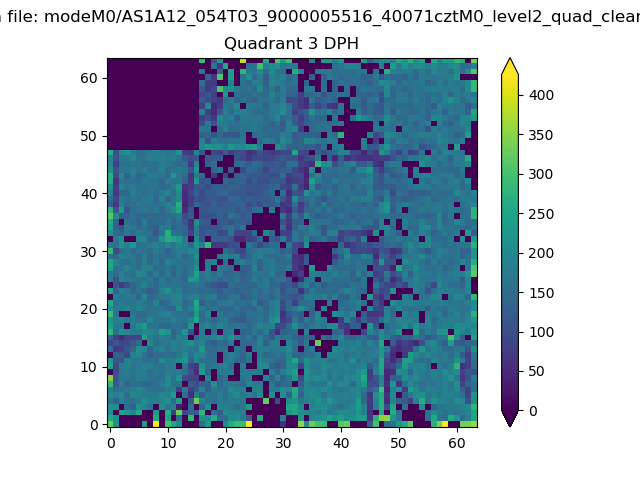 |
 |
Quadrant C |
| Plot type | Count rate plots | Images |
|---|---|---|
| Comparison with Poisson distribution Blue bars denote a histogram of data divided into 1 sec bins. Red curve is a Poisson curve with rate = median count rate of data. |
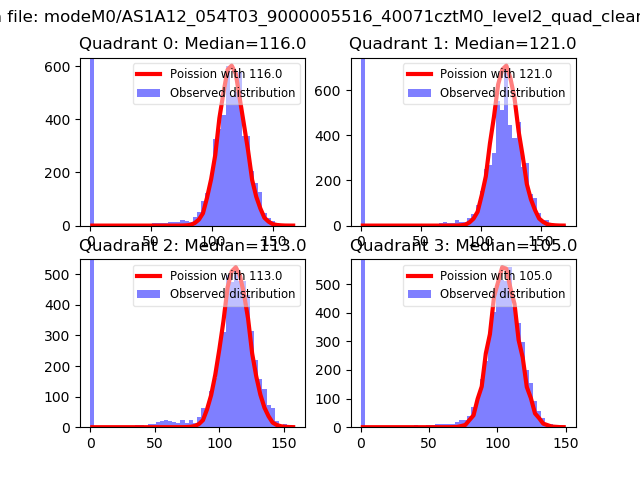 |
 |
| Quadrant-wise count rates Data is divided into 100 sec bins |
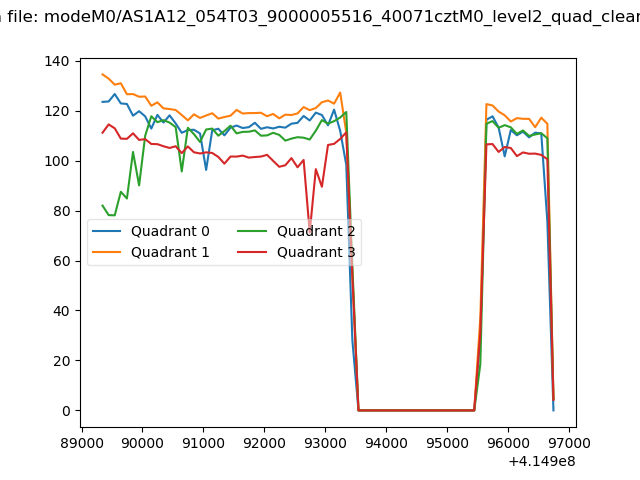 |
|
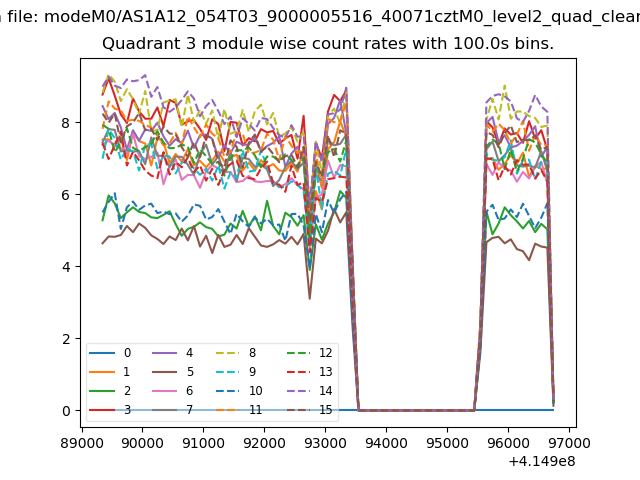
| Module-wise count rates for Quadrant A Data is divided into 100 sec bins |
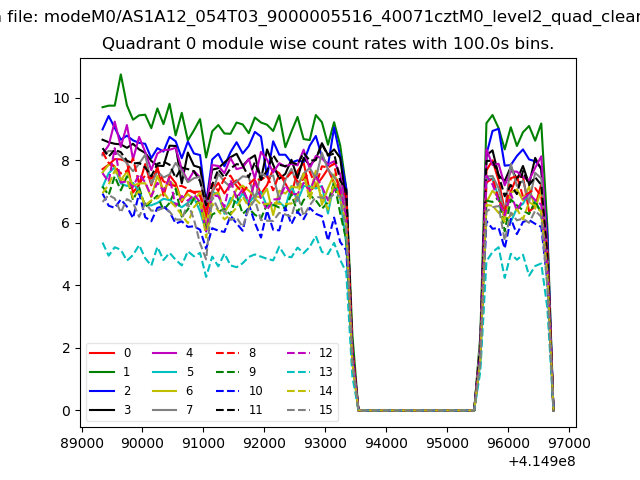 |
 |
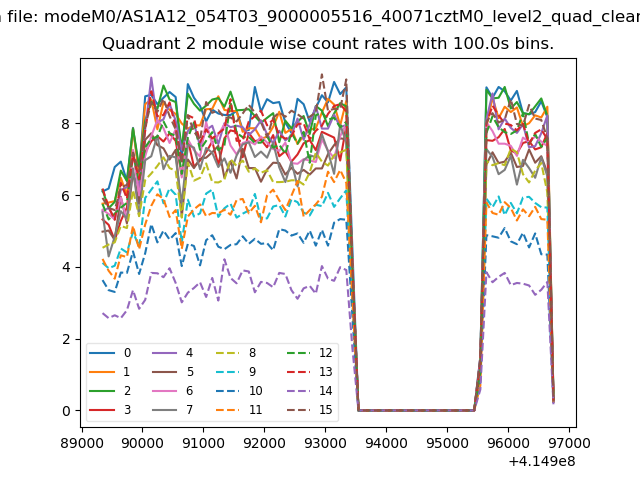
| Module-wise count rates for Quadrant B Data is divided into 100 sec bins |
 |
 |
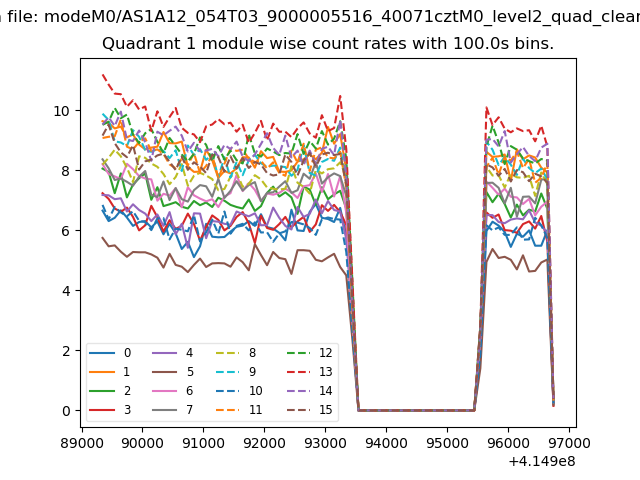
| Module-wise count rates for Quadrant C Data is divided into 100 sec bins |
 |
 |
| Module-wise count rates for Quadrant D Data is divided into 100 sec bins |
 |
 |
| Parameter | Plot |
|---|---|
| CZT HV Monitor | 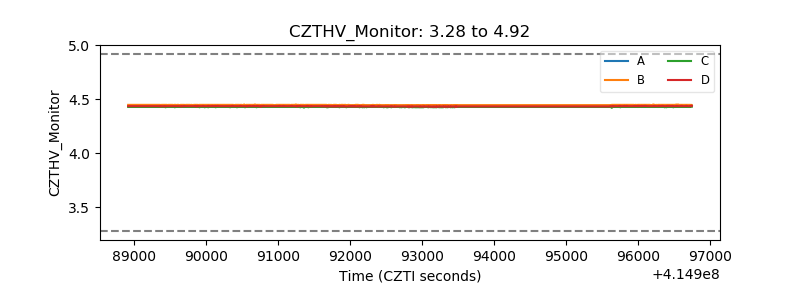 |
| D_VDD | 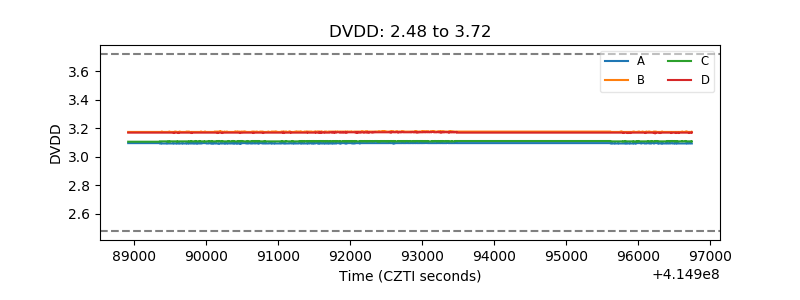 |
| Temperature 1 | 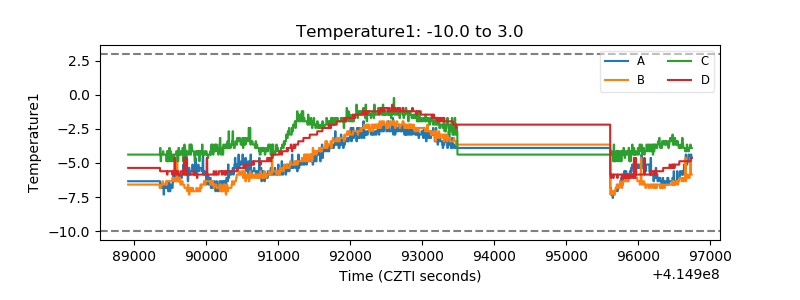 |
| Veto HV Monitor | 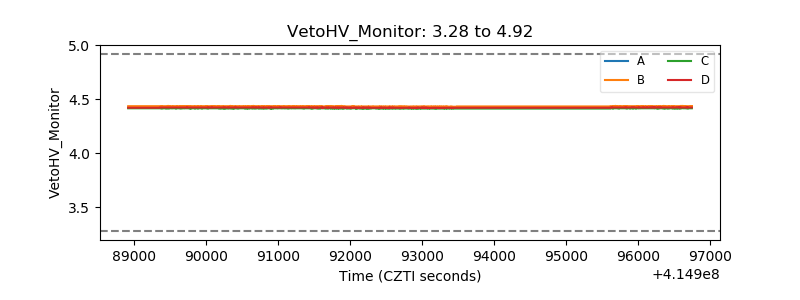 |
| Veto LLD | 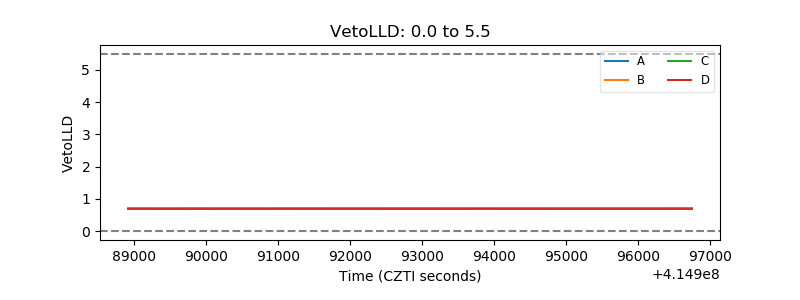 |
| Alpha Counter | 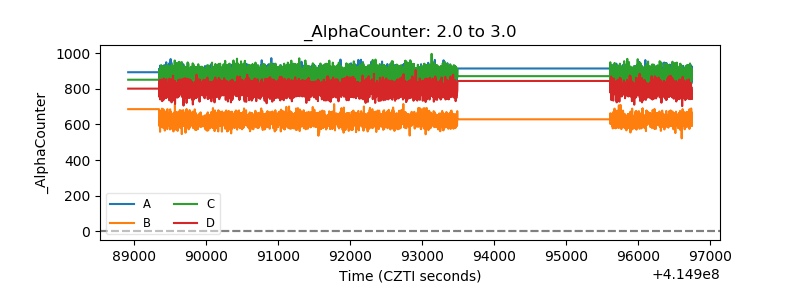 |
| _CPM_Rate | 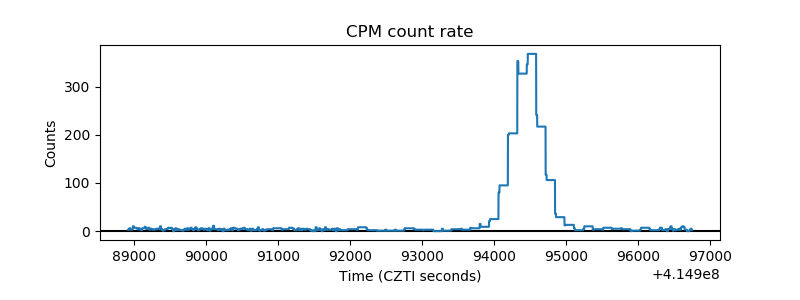 |
| CZT Counter | 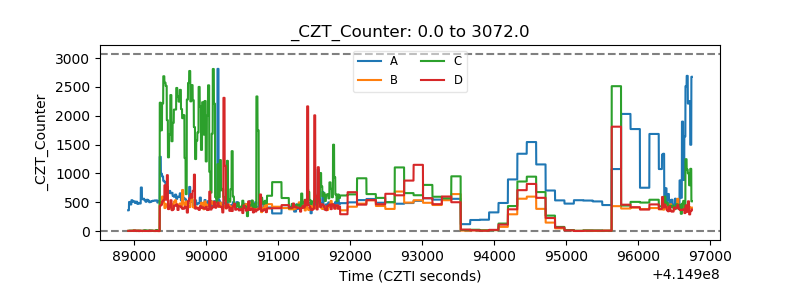 |
| +2.5 Volts monitor |  |
| +5 Volts monitor | 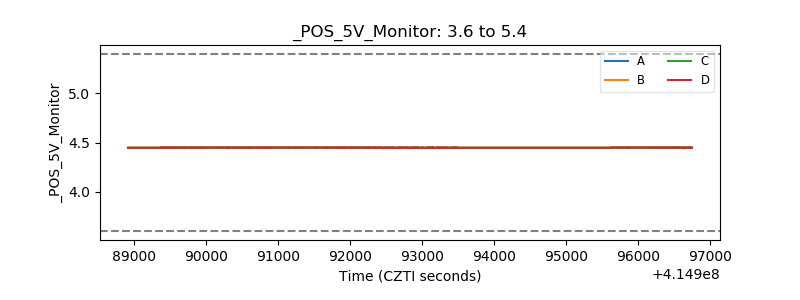 |
| _ROLL_ROT | 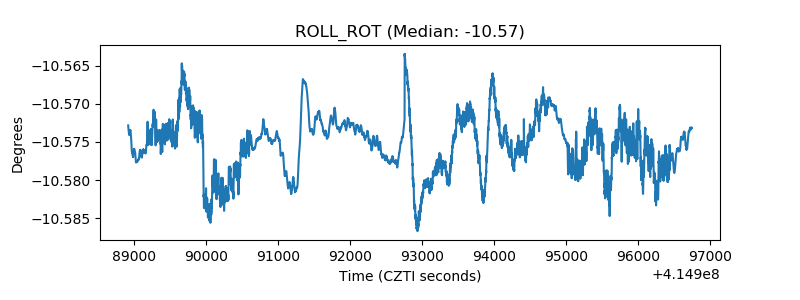 |
| _Roll_DEC | 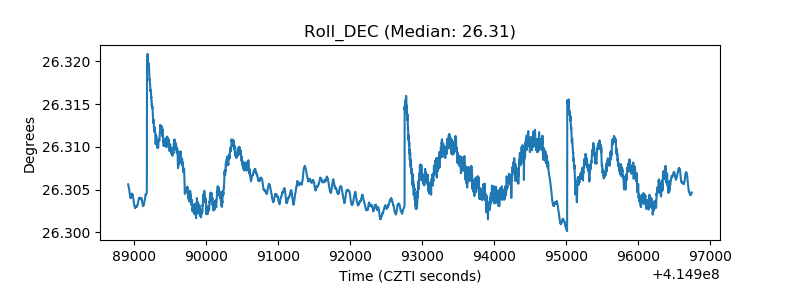 |
| _Roll_RA | 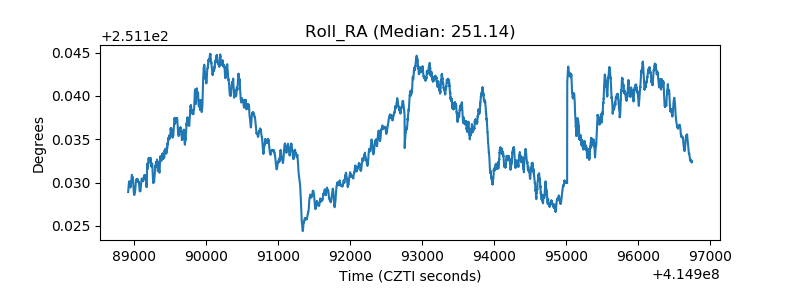 |
| Veto Counter | 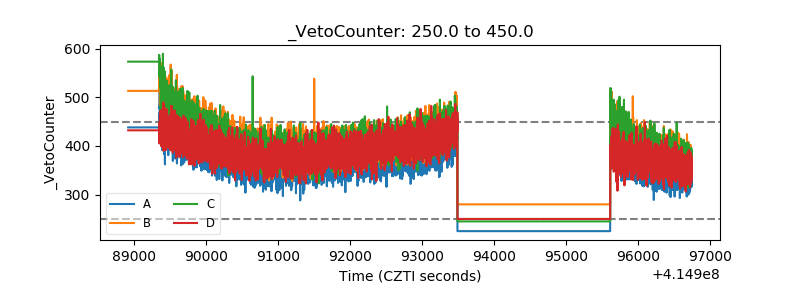 |